HAL Id: hal-00472043
https://hal.univ-brest.fr/hal-00472043
Submitted on 9 Apr 2010
HAL is a multi-disciplinary open access
archive for the deposit and dissemination of
sci-entific research documents, whether they are
pub-lished or not. The documents may come from
teaching and research institutions in France or
abroad, or from public or private research centers.
L’archive ouverte pluridisciplinaire HAL, est
destinée au dépôt et à la diffusion de documents
scientifiques de niveau recherche, publiés ou non,
émanant des établissements d’enseignement et de
recherche français ou étrangers, des laboratoires
publics ou privés.
Effects of an iron-light co-limitation on the elemental
composition (Si, C, N) of the marine diatoms
Thalassiosira oceanica and Ditylum brightwellii
Eva Bucciarelli, Philippe Pondaven, Géraldine Sarthou
To cite this version:
Eva Bucciarelli, Philippe Pondaven, Géraldine Sarthou. Effects of an iron-light co-limitation on the
el-emental composition (Si, C, N) of the marine diatoms Thalassiosira oceanica and Ditylum brightwellii.
Biogeosciences, European Geosciences Union, 2010, 7, pp.657-669. �hal-00472043�
www.biogeosciences.net/7/657/2010/
© Author(s) 2010. This work is distributed under the Creative Commons Attribution 3.0 License.
Biogeosciences
Effects of an iron-light co-limitation on the elemental composition
(Si, C, N) of the marine diatoms Thalassiosira oceanica and Ditylum
brightwellii
E. Bucciarelli, P. Pondaven, and G. Sarthou
Universit´e Europ´eenne de Bretagne, France
Universit´e de Brest, CNRS, IRD, UMR 6539 LEMAR, IUEM; Technopˆole Brest Iroise, Place Nicolas Copernic, 29280 Plouzan´e, France
Received: 29 May 2009 – Published in Biogeosciences Discuss.: 17 July 2009 Revised: 8 January 2010 – Accepted: 28 January 2010 – Published: 16 February 2010
Abstract. We examined the effect of iron (Fe) and Fe-light
(Fe-L) co-limitation on cellular silica (BSi), carbon (C) and nitrogen (N) in two marine diatoms, the small oceanic diatom
Thalassiosira oceanica and the large coastal species Ditylum brightwellii. We showed that C and N per cell tend to
de-crease with increasing Fe limitation (i.e. decreasing growth rate), both under high light (HL) and low light (LL). We ob-served an increase (T. oceanica, LL), no change (T.
ocean-ica, HL) and a decrease (D. brightwellii, HL and LL) in BSi
per cell with increasing degree of limitation. The compari-son with literature data showed that the trend in C and N per cell for other Fe limited diatoms was similar to ours. Inter-specific differences in C and N quotas of Fe limited diatoms observed in the literature seem thus to be mostly due to vari-ations in cell volume. On the contrary, there was no global trend in BSi per cell or per cell volume, which suggests that other interspecific differences than Fe-induced variations in cell volume influence the degree of silicification. The relative variations in C:N, Si:C and Si:N versus the relative variation in specific growth rate (i.e. µ:µmax) followed the same
pat-terns for T. oceanica and D. brightwellii, whatever the irradi-ance level. However, the variations of C:N under Fe limita-tion reported in the literature for other diatoms are contrasted, which may thus be more related to growth conditions than to interspecific differences. As observed in other studies, Si:C and Si:N ratios increased by more than 2-fold between 100% and 40% of µmax. Under more severe limitation (HL and
LL), we observed for the first time a decrease in these ratios.
Correspondence to: E. Bucciarelli
(eva.bucciarelli@univ-brest.fr)
These results may have important biogeochemical implica-tions on the understanding and the modelling of the oceanic biogeochemical cycles, e.g. carbon and silica export.
1 Introduction
Warming of the climate system is now unequivocal and very likely due to the atmospheric increase of greenhouse gases such as carbon dioxide (CO2)(IPCC, 2007). The rate of
change in atmospheric CO2, depends, however, not only on
human activities but also on oceanic biogeochemical pro-cesses (Falkowski et al., 2000). Oceanic ecosystems indeed strongly affect the composition of the atmosphere, through CO2uptake by phytoplankton, and the export of that organic
carbon from the surface to the ocean interior. In this regard, the phytoplanktonic group of the diatoms is thought to play a major role (Sarthou et al., 2005). These siliceous species contribute up to 40% of the global oceanic primary pro-duction of carbon (Nelson et al., 1995) and the termination of their massive blooms export large quantities of organic carbon and biogenic silica from upper layers to the deep ocean (Smetacek, 1999). These export events may partly control the partitioning of carbon in the atmosphere-ocean-sediment system over geological timescales (Barber and His-cock, 2006; Falkowski et al., 1998). Since the 1990s, it has been convincingly shown that the subnanomolar oceanic concentrations of iron (Fe) are low enough to limit primary production and in particular diatom growth in at least 40% of the ocean (de Baar et al., 2005). Iron limitation also induces a decoupling in the use of macronutrients by phytoplankton, likely to influence the cycling of the major biogeochemical
cycles (C, N, P, Si, S) over geological time scales (de Baar and La Roche, 2003). For example, it is now well admit-ted that Fe-limiadmit-ted diatoms generally increase their cellular Si:N and Si:C ratios, which may have large consequences for biogeochemical cycles, e.g. the efficiency and strength of the biological carbon pump, and the depletion of Si be-fore N, driving the system towards Si limitation (Marchetti and Cassar, 2009; Sarthou et al., 2005). This increase has been attributed to increased Si content and decreased C and N content (e.g. Takeda, 1998; Timmermans et al., 2004). It is then usually assumed in biogeochemical models that di-atom Si content, Si:N and Si:C ratios increase under limiting conditions (e.g. Aumont et al., 2003; Moore et al., 2004). However, two recent studies indicated no change or even a weak decrease in cellular biogenic silica of Fe-limited cells of Chaetoceros dichaeta (Hoffmann et al., 2007) and some clones of Pseudonitzschia (Marchetti and Harrison, 2007). In those cases, an increase in Si:N and Si:C ratios under Fe limiting conditions was due to a greater decrease in C and N contents than in biogenic silica. Marchetti and Cassar (2009) proposed that such discrepancies between studies may be due to the level of Fe deficiency, different culture conditions and implemented methodology, in situ shifts in diatom species composition, interspecific differences, and/or change in cell size and diatom morphology.
Other abiotic parameters, like irradiance, also control pri-mary production and influence the elemental stoichiometry of phytoplankton (Geider and La Roche, 2002). Besides, ir-radiance may be a determining factor in diatom species suc-cession and distribution (Timmermans et al., 2007). Fe-light co-limitation occurs in the subarctic Pacific Ocean (Maldon-aldo et al., 1999), subantarctic waters (Boyd et al., 1999), central North Atlantic (Moore et al., 2006) and eastern North Pacific (Hopkinson and Barbeau, 2008). Co-limitation by Fe and light may even better describe the HNLC regions than Fe alone (de Baar et al., 2005). Iron and light indeed interplay at the biochemical level, because phytoplanktonic cells need higher Fe:C for growth under low light (Sunda and Hunts-man, 1997). However, despite the importance of this envi-ronmentally relevant co-limitation, very few studies explored its impact on the coupling of the major biogeochemical cy-cles.
In the present study, we examined the effect of Fe limita-tion and Fe-light co-limitalimita-tion on cellular silica, carbon and nitrogen in the small oceanic diatom Thalassiosira
ocean-ica and the large coastal species Ditylum brightwellii over a
large range of Fe limitation and at two different irradiances. We then compared our results to literature data, taking into account the degree of Fe limitation.
2 Materials and methods 2.1 Culture conditions
Batch cultures of the centric diatoms Thalassiosira
ocean-ica (CCMP 1005, axenic, small solitary oceanic species
from the Sargasso Sea, ca. 80 µm3)and Ditylum brightwellii (CCMP 358, axenic, large solitary coastal species from the Gulf of Mexico, ca. 16 000 µm3) were grown at 20◦C in polycarbonate bottles. Cultures were grown under cool white fluorescent light at an irradiance of 75 (high light: HL) and 7.5 µmol photons m−2s−1 (low light: LL) and a 14 h:10 h light:dark cycle. The culture media (see below) were steril-ized by micro wave treatment (Keller et al., 1988). Cultures were grown as duplicates or triplicates at each Fe concentra-tion. Cultures were gently mixed twice a day by hand to pre-vent cell sedimentation. Both species were pre-acclimated to each culture condition (Fe concentration and irradiance level) until their growth rate remained constant over several days. When filtered, at least 10 generations have been grown in the same conditions and at an equivalent growth rate (see Sup-plementary Material: http://www.biogeosciences.net/7/657/ 2010/bg-7-657-2010-supplement.pdf). Cultures were sam-pled in the mid-exponential phase of growth for total cell concentration (CC), biogenic silica (BSi), and particulate (i.e. cellular) carbon (C) and nitrogen (N). Samples were col-lected at the same time of the day to avoid diel cycle varia-tions between treatments.
2.2 Culture media
The complete medium consisted of artificial AQUIL sea-water enriched with 300 µmol L−1 nitrate, 10 µmol L−1
phosphate, 100 µmol L−1silicate, 0.55 µg L−1 vitamin B12,
0.5 µg L−1 biotin, 100 µg L−1 thiamin, 10 nmol L−1 selen-ite and 100 nmol L−1 molybdate (Price et al., 1988/1989). The medium also contained a trace metal ion buffer sys-tem consisting of 100 µmol L−1 ethylene diamine tetra acetic acid (EDTA), 19.6 nmol L−1 Cu, 50.3 nmol L−1 Co, 79.7 nmol L−1 Zn and 121 nmol L−1 Mn. The buffer sys-tem generated free ion concentrations of Cu, Co, Zn and Mn of 10−13.79, 10−10.88, 10−10.88and 10−8.27mol L−1, re-spectively, at pH 8.1 (Price et al., 1988/1989). Added iron concentrations to the medium ranged from 0 (no addition) to 500 nmol L−1. Background iron in the medium without EDTA (0.61 nmol L−1)was measured by ICP-MS after
pre-concentration onto an 8-HQ resin. Total iron pre-concentration was computed from the sum of added iron and the back-ground iron concentration. In this medium, inorganic iron concentrations ([Fe′]) can be estimated from total iron con-centrations, and depend on the irradiance (Sunda and Hunts-man, 1997). They varied between 0.9 and 699 pmol L−1 at HL and between 0.7 and 610 pmol L−1at LL (Table 1).
Table 1. Inorganic Fe concentrations in the medium ([Fe′], in
pmol L−1)at high light (HL) and low light (LL) for T. oceanica and
D. brightwellii. Starred values indicate that specific growth rates
were measured at these concentrations but not elemental composi-tion.
Fe′(pmol L−1)
Thalassiosira oceanica Ditylum brightwellii
HL LL HL LL 0.9 0.7 8.7 11* 2.2 2.0 11* 19* 7.8 6.8 12 37 43 13 13* 98* 112 37 15* 610 154 98 44 698 135 113* 610 699
2.3 Specific growth rate and volume per cell
No Coulter counter was available on site, and cellular con-centrations (CC, cells mL−medium1 ) were determined by mi-croscopic counts. Specific growth rate (µ, d−1)was deter-mined by linear regression of the natural log CC versus time. The cells exhibited a constant daily specific growth rate over several days before the experiment. During the samplings, 10 ml were fixed with 600 µl of 25% glutaraldehyde. The volume per cell (Vcell, µm3)was measured a week later with
a Z2 Coulter electronic particle counter for Thalassiosira
oceanica (LPI, Station Exp´erimentale d’Argenton d’Ifremer,
France). The cylinder shape of Ditylum brightwellii does not allow to use a Coulter counter: fifty randomly selected cells were digitized on an inverted microscope using an ana-logic Leica camera and analyzed with software image anal-ysis (Visilog 5) to determine the maximal width (a, µm) and length (A, µm). The average cell volume was determined using the geometric formula for a cylinder: Volume=π a2A.
2.4 Cellular nitrogen and carbon
All the glassware used for cell carbon and nitrogen deter-mination (filter holders, filtration funnels, and vials) were washed with 10% HCl, rinsed with Milli-Q water and dried. They were then pre-combusted at 450◦C for 4.5 h. Cells from culture samples were filtered as duplicates onto GF/F filters (pre-combusted as the glassware) and rinsed with arti-ficial seawater containing no nutrient. Samples were stored frozen at −20◦C and were dried before analysis. Samples
were analyzed using a Carlo-Erba NA-1500 elemental ana-lyzer. 3 0 0.4 0.8 1.2 1.6 0 100 200 300 400 500 600 700 800 HL LL (a) 0 0.4 0.8 1.2 1.6 0 100 200 300 400 500 600 700 800 [Fe'] (pmol L-1) HL LL (b) S p e ci fi c gr ow th r ate (d -1)
Fig. 1. Specific growth rate (µ, d−1)of (a) Thalassiosira oceanica and (b) Ditylum brightwellii versus inorganic iron concentration in
the medium ([Fe′], pmol L−1)under high light (HL, open symbols)
and low light (LL, closed symbols).
2.5 Biogenic silica (BSi)
Culture samples were filtered as duplicates onto 0.6 µm poly-carbonate membrane and rinsed with artificial seawater con-taining no nutrient. The filters were oven dried at 60◦C for 24 h, digested for 7 days in 2.9 mol L−1HF, and the re-sulting orthosilicic acid was measured by spectrophotometry (Ragueneau and Tr´eguer, 1994).
3 Results
3.1 Specific growth rate and volume per cell
The specific growth rate decreased with the irradiance and the inorganic iron concentrations in the medium for both species (Fig. 1a, b). The maximum specific growth rate (µmax)and the half-saturation constant for growth with
re-spect to iron (KµFe′)were determined using a Monod
sat-uration function (Table 2). When the irradiance decreased by 10-fold, µmax decreased by 1.8-fold and 1.6-fold for T. oceanica and D. brightwellii, respectively. In the same
time, KµFe′ increased by 2.3-fold for T. oceanica.
De-spite the large standard error at low light, a 1.4-fold in-crease in KµFe′ was significant for D. brightwellii between
HL and LL (ANOVA, p < 0.001, F =51.1). Maximum growth rates are within the range of values reported in the
Table 2. Maximum specific growth rate µ (d−1)and half-saturation constant for growth with respect to iron (KµFe′)for T. oceanica and D. brightwellii under high light (HL) and low light (LL). The squared correlation coefficient of the Monod saturation function versus
inorganic Fe concentration (R2)and the number of data used for the regression (n) are also given.
Thalassiosira oceanica Ditylum brightwellii
HL LL HL LL µmax(d−1) 1.18±0.02 0.65±0.02 1.60±0.04 0.98±0.07 KµFe′(pmol L−1) 1.29±0.17 3.01±0.43 25.4±1.99 36.5±9.79 n 20 24 19 10 R2 0.92 0.93 0.97 0.88 50 60 70 80 90 0 0.2 0.4 0.6 0.8 1 1.2 1.4 µ (d-1) Vce ll ( µ m 3 ) HL LL 3 757
Fig. 2. Cell volume (Vcell, µm3)of Thalassiosira oceanica versus
specific growth rate (µ, d−1)under high light (HL, open symbols)
and low light (LL, closed symbols).
literature at the same temperature and higher irradiances for T. oceanica (e.g. ∼0.9 d−1at 180 µmol photons m−2s−1,
Peers et al., 2005, 1.1 d−1 at 500 µmol photons m−2s−1, Sunda et al., 1991) and D. brightwellii (e.g. ∼1 d−1 at 100 µmol photons m−2s−1, Eppley and Rogers, 1970, and 1.2–1.9 d−1at 190 µmol photons m−2s−1, Goldman, 1999).
The volume per cell of T. oceanica did not vary under Fe limitation at HL (Vcell=79.0±1.2 µm3, n=15, CI=95%)
ex-cept at the lowest specific growth rate (Vcell=62.9±2.3 µm3,
n=2, CI=95%) (Fig. 2). The volume per cell of this species decreased significantly between HL and LL (t-test, p < 0.01) and remained stable at LL whatever the Fe concentration (Vcell=61.2±2.1 µm3, n=16, CI=95%). In other Fe-limited
experiments at HL, µ decreased down to 0.1 d−1, and values of Vcellwere similar to those observed here under LL
(Buc-ciarelli, unpublished data). The difference between HL and LL in the present study is thus most likely due to a decrease in the specific growth rate, and not to a direct effect of light limitation.
While we did not measure any change in cell volume due to glutaraldehyde preservation for T. oceanica, the use of glu-taraldehyde induced an increase (up to 3-fold) in cell volume of D. brightwellii that could not be corrected. As a result, the elemental compositions of both diatoms are presented on
a per cell basis to allow interspecific comparisons. Data of
T. oceanica are also discussed on a per cell volume basis.
3.2 Cellular nitrogen and carbon
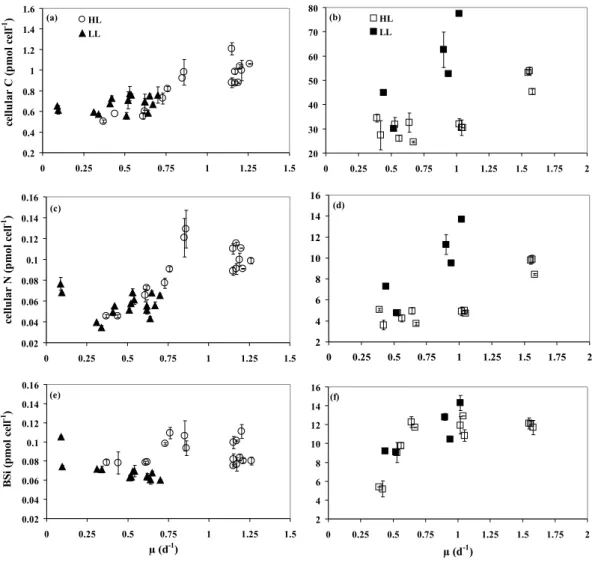
The trends in variations in cellular carbon were similar for both diatoms under HL. Cellular C decreased with Fe lim-itation under HL from ∼1 pmol cell−1 to ∼0.5 pmol cell−1 for T. oceanica (Fig. 3a) and from ∼50 pmol cell−1 to
∼30 pmol cell−1 for D. brightwellii (Fig. 3b). At a
given growth rate, the C content was higher under LL than under HL for D. brightwellii and almost similar for
T. oceanica. Indeed, when µ varied between 0.4 and
1.05 d−1 for D. brightwellii and between 0.4 and 0.75 d−1 for T. oceanica, the average values of the C content at LL and HL were respectively 53.6±15.7 pmol cell−1 (n=5, CI=95%) and 30.0±2.1 pmol cell−1 (n=9, CI=95%) for
D. brightwellii, and 0.70±0.04 pmol cell−1(n=12, CI=95%)
and 0.59±0.07 pmol cell−1 (n=5, CI=95%) for T.
ocean-ica. However, when considering cell volume, C con-centration for T. oceanica was significantly higher under LL (11.2±0.6 mol L−cell1, n=12, CI=95%) than under HL (8.4±1.1 mol L−cell1, n=5, CI=95%). Under LL, cellular C decreased with Fe limitation for D. brightwellii (from
∼80 pmol cell−1to ∼30 pmol cell−1)but did not change for
T. oceanica (0.67±0.07 pmol cell−1and 11.0±1.0 mol L−cell1, mean±SD, n=16).
For both species and light conditions, at µ higher than 0.1 d−1, the nitrogen content decreased with Fe limitation (Fig. 3c, d). At a given specific growth rate, the average value was similar for T. oceanica under LL and HL, on a per cell and on a cell volume basis (for µ between 0.4 and 0.75 d−1, 0.057±0.004 pmol cell−1and 0.92±0.06 mol L−cell1,
n=12, CI=95%, under LL, and 0.061±0.013 pmol cell−1and 0.84±0.11 mol L−cell1, n=5, CI=95%, under HL). It decreased from ∼0.1 pmol cell−1 at 1.2 d−1 to ∼0.04 pmol cell−1 at 0.3 d−1. At the most severe Fe-L co-limitation (µ=0.09 d−1), the nitrogen content of T. oceanica increased up to 0.07 pmol cell−1(i.e. 1.2 mol L−cell1). For D. brightwellii, the average value was higher at LL than at HL (for µ between 0.4 and 1.05 d−1, 9.32±3.04 pmol cell−1, n=5, CI=95%, and 4.56±0.36 pmol cell−1, n=9, CI=95%, respectively).
3 2 4 6 8 10 12 14 16 0 0.25 0.5 0.75 1 1.25 1.5 1.75 2 µ (d-1) (f) 20 30 40 50 60 70 80 0 0.25 0.5 0.75 1 1.25 1.5 1.75 2 HL LL (b) 0.2 0.4 0.6 0.8 1 1.2 1.4 1.6 0 0.25 0.5 0.75 1 1.25 1.5 ce ll u la r C ( p m o l ce ll -1 ) HL LL (a) 0.02 0.04 0.06 0.08 0.1 0.12 0.14 0.16 0 0.25 0.5 0.75 1 1.25 1.5 ce ll u la r N ( p m o l ce ll -1) (c) 2 4 6 8 10 12 14 16 0 0.25 0.5 0.75 1 1.25 1.5 1.75 2 (d) 0.02 0.04 0.06 0.08 0.1 0.12 0.14 0.16 0 0.25 0.5 0.75 1 1.25 1.5 µ (d-1) B S i (p m o l c el l -1) (e) 774 775 776 777 778 779 780 781 782 783 784 785 786 787 788 789
Fig. 3. Carbon (a, b), nitrogen (c, d) and biogenic silica (e, f) per cell (in pmol cell−1)versus specific growth rate (µ, d−1)of Thalassiosira
oceanica (left panels) and Ditylum brightwellii (right panels) under high light (HL, open symbols) and low light (LL, closed symbols).
It decreased approximately from 11.5 to 5 pmol cell−1 at 1 d−1 (LL and HL, respectively) and from 6 pmol cell−1 to 4.5 pmol cell−1at 0.5 d−1(LL and HL, respectively).
3.3 Biogenic silica (BSi)
The BSi content of T. oceanica was scattered under Fe limitation at HL and did not change significantly with the specific growth rate, either on a per cell (Fig. 3e) or per cell volume basis (r2 <0.1, p > 0.25, n=17). For µ between 0.4 and 0.75 d−1, the average BSi per cell was lower under LL than under HL on a per cell basis (0.065±0.002 pmol cell−1, n=9, CI=95%, and
0.083±0.008 pmol cell−1, n=5, CI=95%, respectively) but similar on a per cell volume basis (1.06±0.05 mol L−cell1, n=9, CI=95% and 1.16±0.11 mol L−cell1, n=5, CI=95%). Under LL, it increased with Fe limitation for µ decreasing from 0.7 to 0.1 d−1, per cell (r2=0.60, p < 0.01, n=13) and per cell volume (r2=0.72, p < 0.01, n=13). The reverse trend
was observed for D. brightwellii, with a decrease with Fe limitation (µ < 0.6 d−1)for both light conditions (Kruskall Wallis test, χ2=12.55, p=0.0057, n=18) and similar values at a given specific growth rate under low and high light (for µ between 0.4 and 1.05 d−1, 11.2±2.0 pmol cell−1, n=5,
CI=95%, and 9.89±1.89 pmol cell−1, n=9, CI=95%,
respec-tively) (Fig. 3f).
3.4 Elemental ratios C:N, Si:C and Si:N
When the specific growth rate varied between 0.4 and 1.05 d−1 for D. brightwellii and between 0.4 and 0.75 d−1
for T. oceanica, the average value of the molar ratio C:N was lower at LL than at HL for D. brightwellii (respectively 5.84±0.32 mol mol−1, n=5, CI=95%, and 6.58±0.28 mol mol−1, n=9, CI=95%) and similar at LL and HL for T. oceanica (respectively 12.33±0.56 mol mol−1,
n=12, CI=95%, and 10.06±1.77 mol mol−1, n=5, CI=95%) (Fig. 4a, b).
3 0 0.05 0.1 0.15 0.2 0 0.25 0.5 0.75 1 1.25 1.5 S i: C ( m o l m o l -1 ) (c) 0.5 1 1.5 2 2.5 0 0.25 0.5 0.75 1 1.25 1.5 µ (d-1) S i: N ( m o l m o l -1) (e) 5 10 15 20 0 0.25 0.5 0.75 1 1.25 1.5 C :N ( m o l m o l -1 ) HL LL (a) 0 0.2 0.4 0.6 0 0.25 0.5 0.75 1 1.25 1.5 1.75 2 (d) 0.5 1 1.5 2 2.5 3 3.5 0 0.25 0.5 0.75 1 1.25 1.5 1.75 2 µ (d-1) (f) 5 6 7 8 9 0 0.25 0.5 0.75 1 1.25 1.5 1.75 2 HL LL (b) 798 799 800 801 802 803 804 805 806 807 808 809 810 811 812
Fig. 4. Molar ratios of C:N (a, b), Si:C (c, d) and Si:N (e, f) versus specific growth rate (µ, d−1)of Thalassiosira oceanica (left panels) and
Ditylum brightwellii (right panels) under high light (HL, open symbols) and low light (LL, closed symbols).
It increased for both diatoms when the specific growth rate decreased (∼1.6-fold for T. oceanica and 1.4-fold for
D. brightwellii), except at the most severe Fe-L co-limitation
for T. oceanica, where it equalled the non limited value. Mo-lar ratios Si:C (Fig. 4c, d) and Si:N (Fig. 4e, f) did not fol-low the same patterns for the two species. For T. oceanica, Si:C increased by ∼1.8-fold and 1.4-fold under Fe limita-tion and Fe-L co-limitalimita-tion respectively, and Si:N increased by ∼2-fold and 1.5-fold under Fe limitation and Fe-L co-limitation respectively, with the exception of the most severe Fe-L co-limitation where a decrease was observed. When the specific growth rate varied between 0.4 and 0.75 d−1 for T. oceanica, the average value of Si:C was lower under LL than under HL (respectively 0.09±0.01 mol mol−1, n=9, and 0.14±0.01 mol mol−1, n=5, CI=95%), while the average value of Si:N was equivalent under LL and HL (respectively 1.13±0.09 mol mol−1, n=9, and 1.40±0.26 mol mol−1, n=5, CI=95%). For D. brightwellii, Si:C and Si:N increased re-spectively by 2-fold and 2.4-fold under Fe-limitation down to a specific growth rate of 0.6 d−1. Below 0.6 d−1, the
ra-tios decreased to similar values as for non limited conditions. Under Fe-L co-limitation, the same pattern was observed, but it was harder to characterize due to the lower number of val-ues. Besides, Si:C and Si:N were lower at LL than at HL for
µ >0.6 d−1, and similar for µ < 0.6 d−1.
To compare the effects of the limitations on the two di-atoms, we will use in the discussion section the R ratio, de-fined as the relative variation of a given parameter between a limiting condition and the Fe-replete condition (e.g., at a specific growth rate µ, R(Si:N)µ=(Si:N)µ: (Si:N)µmax). The
degree of Fe limitation will be defined by its impact on the growth rate using the ratio µ:µmax(i.e. R(µ)), with the value
of maximum growth rate measured at the highest Fe concen-tration, either under HL (e.g.: µmax∼1.2 d−1for T. ocean-ica), or under LL (e.g.: µmax∼0.7 d−1for T. oceanica).
4 Discussion
4.1 Growth parameters and the decoupling of cellular C and N
The half-saturation constants for growth with respect to iron (KµFe′, Table 2) agree well with previous studies, showing
a much lower value, i.e. a better adaptation to limitation (Fe and Fe-L) of a small diatom than of a large one (Sunda and Huntsman, 1995; Timmermans et al., 2001b, 2004). Once the limitation is relieved, the smallest cells should have the highest growth rates according to allometric relationship be-tween µmaxand cell volume (Sarthou et al., 2005). However,
this allometric relationship is very scattered and in our study the largest diatom would outgrow the smallest one due to its higher maximum specific growth rate. The better adapta-tion of T. oceanica can be explained by a more favorable sur-face to volume ratio for a small species than for a bigger one (Hudson and Morel, 1990) and a general lower Fe require-ment for growth in the oceanic species than in the coastal species (Sunda and Huntsman, 1995; Sunda et al., 1991). For example, oceanic diatoms can synthesize flavodoxin instead of ferredoxin (La Roche et al., 1995). It has also recently been shown that T. oceanica uses the copper-containing plas-tocyanin instead of the functionally equivalent Fe-containing cytochrome c6 (Peers and Price, 2006), and has a different photosynthetic apparatus from a coastal species, i.e. lower cellular concentrations of Fe-rich cytochrome b6/f and PSI (Strzepek and Harrison, 2004). This could also explain how cellular C remained constant for T. oceanica with increasing Fe limitation under LL (Fig. 3a). Cells acclimatize to low light by increasing their Fe content and Fe:C ratio, i.e. their photosynthetic capacity (Strzepek and Price, 2000; Sunda and Huntsman, 1997). Its photosynthetic apparatus allows
T. oceanica to decrease its cellular iron requirements but not
its photosynthetic rates (Strzepek and Harrison, 2004), which may help this species to maintain its C content under LL and increasing Fe limitation. On the contrary, the C con-tent of D. brightwellii decreased under LL with increasing Fe limitation. However, although not measured in our study, it is known that the size of this species shows a large plastic-ity. It increases by 4-fold under Cu toxicity (from ∼25 000 to ∼100 000 µm3, Rijstenbil and Gerringa, 2002), and de-creases from 4500 to 3000 µm3 when irradiance decreases from 110 to ∼10 µmol photons m−2s−1(Waite et al., 1992). The decrease in C content could thus be compensated for by a 2-fold decrease in cell volume.
The inefficiency of photosynthesis also reduces the effi-ciency of nitrate and nitrite reduction by lowering the amount of reductants. This directly disrupts the metabolism of ni-trogen, whose energetic needs are important (Muggli et al., 1996; Timmermans et al., 1994). Besides, Fe is the metal at the center of the nitrate and nitrite reductases. These com-bined effects of Fe limitation on N metabolism may explain why we observed a stronger effect of Fe on N than on C of
Fe and Fe-L (co-)limited cells, except at the most severe de-gree of limitation for T. oceanica (i.e. at the highest dede-gree of Fe-L co-limitation). If we exclude these two singular points, N content indeed decreased by 60% and 50% for T.
ocean-ica and D. brightwellii respectively (same relative decrease at
LL and HL, Fig. 3c, d) while C content decreased by ∼40% for T. oceanica and D. brightwellii at HL and did not vary (T. oceanica) or decreased by 40% (D. brightwellii) at LL. As indicated above, however, at the highest degree of Fe-L (co)-limitation for T. oceanica, the N content doubled while C remained stable. This sharp increase might be explained by the high level of Fe limitation, even more important under LL. It has indeed been suggested that under severe Fe stress,
T. oceanica may produce a Fe reductase that is also a
plas-malemma bound form of nitrate reductase (Maldonado and Price, 2000). In that case, severely Fe-limited cells might in-crease their N quota while increasing Fe uptake. Our results give support to this hypothesis.
Many other studies focused on the intracellular C and/or N quota of Fe-limited diatoms. Their conclusions are rarely similar, even for the same species. To better compare all of these studies, we considered the relative variation in C and N per cell (i.e. R(C) and R(N)), versus the relative variation in the specific growth rate, i.e. R(µ) for 14 other Fe-limited species in six other studies (5 species of Pseudonitzschia: Marchetti and Harrison, 2007; 6 species of Thalassiosira including T. oceanica: Gallinari et al., 2010; Maldonado and Price, 1996; Timmermans et al., 2004; Actinocyclus sp.: Muggli et al., 1996; Timmermans et al., 2004;
Fragilariop-sis kerguelenFragilariop-sis: Hoffmann et al., 2007; Timmermans et al.,
2004; Corethron pennatum : Timmermans et al., 2004; and
Chaetoceros dichaeta: Hoffmann et al., 2007). Results are
reported on Fig. 5a and b. If we exclude the two values of
T. oceanica at the most severe limitation, R(C) and R(N)
tend to decrease when Fe or Fe-L co-limitation increases (for R(C): r2=0.58, p < 0.00001, n=63, and R(N): r2=0.54,
p <0.00001, n=87). However, when considering the N or C quota per cell volume (when available: Gallinari et al., 2010; Maldonado and Price, 1996; Marchetti and Harrison, 2007; Muggli et al., 1996), there is no significant trend in R(C) or R(N), as also observed by Price (2005) for T. weissflogii. Interspecific differences in C and N quotas of Fe-limited di-atoms observed in the literature seem thus to be mostly due to variations in cell volume.
Given the importance of cell volume in comparing the dif-ferent species and studies, we considered the relative varia-tion in C:N, i.e. R(C:N), versus the relative variavaria-tion in the specific growth rate, i.e. R(µ). In our study, and exclud-ing the two values of T. oceanica at the most severe lim-itation, we observed a similar increase with limitation for both species and both limitations (r2=0.31, p=0.0001, n=47) (Fig. 6a). The relative variation in C:N of the other species cited above, however, does not show any dependency on
R(µ)(r2=0.003, p=0.8, n=24, data not shown). Growth con-ditions and species difference have been invoked to explain
0 0.5 1 1.5 2 2.5 0 0.2 0.4 0.6 0.8 1 1.2 R ( C ) Db HL Db LL To HL To LL F. kerguelensis C. dichaeta
Pseudonitzschia Actinocyclus Thalassiosira
(a) 0 0.5 1 1.5 2 2.5 0 0.2 0.4 0.6 0.8 1 1.2 R ( N ) Db HL Db LL To HL To LL F. kerguelensis C. dichaeta
Pseudonitzschia Actinocyclus Thalassiosira
C. pennatum (b) 0 0.5 1 1.5 2 2.5 3 3.5 4 0 0.2 0.4 0.6 0.8 1 1.2 µ:µmax R ( B S i) Db HL Db LL To HL To LL F. kerguelensis C. dichaeta
Pseudonitzschia Actinocyclus Thalassiosira
C. pennatum (c) 822 823 824 825 826 827 828 829 830 831 832 833 834 835 836 837 838 839 840 841 842 843 844 845
Fig. 5. Relative variation in (a) cellular C (R(C)), (b) cellular
N (R(N)) and (c) cellular BSi (R(BSi)) versus relative variation
in specific growth rate (µ:µmax)for Thalassiosira oceanica (To,
HL: open circles, LL: closed triangles), Ditylum brightwellii (Db, HL: open squares, LL: closed squares), Fragiloriopsis
kerguelen-sis (F. kerguelenkerguelen-sis, *, Hoffmann et al., 2007; Timmermans et
al., 2004), Chaeotoceros dichaeta (C. dichaeta, •, Hoffmann et al., 2007), Pseudonitzshia heimii type 1, Pseudonitzshia cf. heimii type 2, Pseudonitzshia cf. turgidula, Pseudonitzshia multiseries,
Pseudonitzshia cf. calliantha (Pseudonitzshia, +, Marchetti and
Harrison, 2007), Actinocyclus sp. (Actinocyclus, x, Muggli et al., 1996; Timmermans et al., 2004), Thalassiosira partheneia,
Thalas-siosira pseudonana, ThalasThalas-siosira weissflogii, ThalasThalas-siosira sub-tilis, Thalassiosira oceanica 13-1, Thalassiosira oceanica 1003, Thalassiosira sp. (Thalassiosira, –, Gallinari et al., 2010;
Maldon-ado and Price, 1996; Timmermans et al., 2004), Corethron
penna-tum (C. pennapenna-tum, ♦, Timmermans et al., 2004).
these contrasting results (Price, 2005). However, in the same growth conditions, we did not observe a significant interspe-cific difference in our study. The contrasting results observed on the coupling or decoupling of C and N under Fe limitation may thus be more related to growth conditions (temperature, length of the daily cycle. . . ) than to interspecific differences.
0 0.5 1 1.5 2 0 0.2 0.4 0.6 0.8 1 1.2 R ( C :N ) Db HL Db LL To HL To LL (a) 0 0.5 1 1.5 2 2.5 3 0 0.2 0.4 0.6 0.8 1 1.2 R ( S i: C ) (b) 0 0.5 1 1.5 2 2.5 3 0 0.2 0.4 0.6 0.8 1 1.2 µ : µmax R ( S i: N ) (c) 847 848 849 850 851 852 853 854 855 856 857 858 859 860 861 862 863 864 865 866 867 868 869 870
Fig. 6. Relative variation in molar ratio (a) C:N (R(C:N)), (b) Si:C
(R(Si:C)), (c) Si:N (R(Si:N)) versus relative variation in specific
growth rate (µ:µmax)for Thalassiosira oceanica (To, HL: open
cir-cles, LL: closed triangles) and Ditylum brightwellii (Db, HL: open squares, LL: closed squares).
4.2 Biogenic silica and ratios Si:C, Si:N
Most of the studies show an increase in biogenic silica un-der Fe limitation. We also observed a significant increase in the degree of silicification of Fe-L co-limited T.
ocean-ica, but no clear trend under Fe limitation (Fig. 3e). The
increase under Fe-L co-limitation may be due to light limi-tation only. Claquin et al. (2002) indeed showed that light limitation increases the amount of biogenic silica per cell of
Thalassiosira pseudonana. Two recent studies also showed
no change or a weak decrease in cellular biogenic silica of Fe-limited cells of Chaetoceros dichaeta (Hoffmann et al., 2007) and some clones of Pseudonitzschia (Marchetti and Harrison, 2007), respectively. These results are observed be-tween two values (“low Fe” and “high Fe”), but the effect of Fe on silicification may depend on the degree of Fe limita-tion (this study; Timmermans et al., 2004). However, there is no significant trend in R(BSi) versus R(µ) when comparing
different diatoms, either on a per cell (Fig. 5c) or per cell volume basis (data not shown). This suggests interspecific differences in terms of silicification in response to Fe or Fe-L limitation.
Marchetti and Harrison (2007) invoke different mecha-nisms likely to induce a decrease in biogenic silica under Fe limitation, like the changes in cell volume, cell morphology and the existence of soluble pools. A change in cell vol-ume with iron and light limitation has indeed been shown for some diatom species (e.g. Hoffman et al., 2008; Timmer-mans et al., 2001a). In our study, the observed decrease in BSi per cell with increasing Fe limitation could be compen-sated for by a 2.3-fold decrease in cell volume under HL and a 1.4-fold decrease under LL. As stated above, such varia-tions in cell volume can occur for D. brightwellii (e.g. Ri-jstenbil and Gerringa, 2002; Waite et al., 1992).
Although we did not study cell morphology or soluble pools, these hypotheses may also be valid for D. brightwellii. Indeed, this species has spines, which may contain a large fraction of biogenic silica (e.g. C. gracilis, Rogerson et al., 1986). Timmermans et al. (2001a) observed more/longer spines for the Fe-limited diatoms C. calcitrans and C.
bre-vis when grown at LL. A decrease in their number or length
in D. brightwellii, due to Fe and light limitations, may thus affect the BSi content. Besides, Chisholm et al. (1978) showed that for D. brightwellii, the intracellular pool of Si may represent up to 50% of total cellular Si, and the size of internal soluble pool can be influenced by environmental variables (Martin-J´ez´equel et al., 2000). However, although these mechanisms may explain why we observed a variation in the silicification of diatoms, the underlying processes are not explained. The causal link between iron and silicification has still to be discovered. A few hypotheses can be proposed, based on the silicification process and the possible role of the frustule as a defense mechanism.
It is known that the energy for silicon metabolism is closely linked to respiration (Martin-J´ez´equel et al., 2000). Iron limitation can impair respiration in microalgae (Allen et al., 2008; Petroutsos et al., 2009), which may disrupt silici-fication in diatoms. Another effect might be the control of Fe on the cell cycle via the cellular growth rate. Claquin et al. (2002) indeed showed for light and nutrient (N, P)-limited cells of T. pseudonana a relationship between the in-creased length of the G2 phase (during which Si is assimi-lated) and the higher degree of silicification under limitation. The increase in silicification of T. oceanica under the Fe-L co-limitation may indeed be due to an increase in the G2 phase duration (Claquin and Bucciarelli, 2010). However, limitation does not seem to systematically induce an increase in the G2 phase length, since it was not observed for our Fe-limited cells of T. oceanica (Claquin and Bucciarelli, 2010). If this is not a general rule, then Fe limitation might decrease the length of the G2 phase for species such as D. brightwellii, and decrease their silicification. More studies are obviously needed to verify this hypothesis.
This difference between the two species may also be re-lated to their ability to escape grazing. Predation avoidance mechanisms include larger size and spines (Irigoien et al., 2005). The frustule is also an effective protection against zooplankton grazing (Hamm et al., 2003). A recent study showed a grazing-induced increase in cell wall silicifica-tion in the marine diatom T. weissflogii (Pondaven et al., 2007). Under energy limitation (Fe and Fe-L), large cells with spines that are not as sensitive as small ones to grazing may reduce their silicification and save on respiratory energy. On the contrary, smaller cells which are easier to graze may need stronger frustules. Besides, even when small enough to be ingested whole by their predators, more silicified diatoms better survive the gut passage of copepods (Jensen and Bath-mann, 2007).
Under mild Fe limitation (µ > 40% µmax), we observed an
increase in Si:C and Si:N ratios (Fig. 4c–f), which has been noted previously by other studies (see review by Marchetti and Cassar, 2009). We also noted a decoupling between Si, C and N under Fe-L co-limitation, which has been described recently for in situ studies (Hopkinson and Barbeau, 2008; Moore et al., 2007) but not for monospecific laboratory cul-tures yet. As changes in BSi were lower than in C or N under LL or HL at a given specific growth rate, the differences in Si:C and Si:N between the two irradiances depended mainly on the differences in the C and N contents. Under LL, the higher C content and the lower BSi value (for T. oceanica) and higher C and N content (for D. brightwellii), compared to HL conditions, induced a lower value of Si:C for T.
ocean-ica at a given specific growth rate and a lower value of Si:C
and Si:N for D. brightwellii at µ > 0.6 d−1. Besides,
un-der severe limitation, we observed a decrease in these ratios. This pattern was especially clear for D. brightwellii. The de-crease observed in this species was due to a larger dede-crease in biogenic silica under Fe limitation (by 60%) than in the cellular N and C content (by 50% and 40%, respectively).
When comparing the relative variation in these ratios ver-sus the relative decrease in µ, both limitations and both species showed very similar patterns (Fig. 6). R(Si:C) and
R(Si:N) increased significantly from 100% to ∼40% of
µmax: R(Si : C)=2.11(±0.17)−1.07(±0.22) · R(µ); r2=0.48, p <0.00001, n =28 and R(Si : N)=2.40(±0.22)−1.53(±0.29) · R(µ); r2=0.52, p <0.00001, n =28
For values of µ:µmaxbelow 40%, R(Si:N) tends to decrease
down to values close to 1, i.e. close to the value at µmax:
R(Si : N)=0.05(±0.59) + 4.93(±1.70) · R(µ);
A decrease in R(Si:C) is also significant for µ:µmaxbetween
20% and 40% (i.e. if the two lowest growth rates are not taken into account):
R(Si : C)=−0.65(±0.74) + 6.09(±2.12) · R(µ);
r2=0.58, p <0.05, n =8
Such a decrease has never been observed yet. Our results are difficult to compare with in situ Fe fertilization data, among other things because of shifts in the phytoplanktonic com-munity towards large cells after Fe addition, which prevents from comparing µ and µmax. Such shifts were not observed
during onboard Fe addition experiments along the Califor-nia coast, where large phytoplankton dominated both control and Fe treated samples at most of the stations (Firme et al., 2003). In that study exploring the impact of Fe limitation on ratios of particulate nutrients, 34 out of 44 stations presented some form of Fe limitation, and BSi:PON and BSi:POC were generally found to decrease in Fe amended samples com-pared to the control (Firme et al., 2003). However, out of 25 stations that were considered Fe-limited, where no change in phytoplankton size classes occurred after Fe addition, and where elemental composition was measured, BSi:PON and/or BSi:POC ratios were similar in both treatments at 3 stations, and lower in the control at 5 stations. These results thus present interesting similarities with ours, and more stud-ies, both in vitro and in situ, should be conducted to further investigate the link between variations in the elemental com-position and variations in the specific growth rate.
4.3 Oceanographic relevance
Results indicating that diatoms increase their Si:N ratio under Fe limitation led to the assumption that (i) Fe increases the degree of silicification of diatoms and that (ii) more silicified, Fe limited diatoms would sink faster and that their frustule would be better preserved when reaching the seafloor, with implications for the use of opal as a paleoproxy (Hutchins and Bruland, 1998; Takeda, 1998; Boyle, 1998). In biogeo-chemical models which consider the cycling of major nutri-ents such as C, N, P or Si, it is thus usually assumed that diatom Si content, Si:N and Si:C ratios increase under limit-ing conditions, and that biogenic silica is efficiently exported below the mixed layer depth because of a lower reminer-alisation rate than organic C, N or P (e.g. Aumont et al., 2003; Fasham et al., 2006; Moore et al., 2004). This gen-eral mechanism fuels the so-called “silica pump” in systems like the Southern Ocean or the Equatorial Pacific (Dugdale et al., 1995). However, in the Southern Ocean, the drawdown of silicic acid occurs during the diatom spring bloom, when limitations (e.g. iron and light) are relieved. In the Ross Sea for example, large silicic acid drawdown and subsequent ex-port of biogenic silica to the deep ocean are concomitant with the diatom bloom (SO-JGOFS AESOPS program, Landry et al., 2002; Nelson et al., 2002; Sigmon et al., 2002). In the Indian sector of the Southern Ocean, in situ observations
and results from a coupled physical-biogeochemical model also suggest that more than 80% of the annual C and Si ex-port occur between December and March at the end of the spring bloom (Pondaven et al., 1998, 2000). Additionally, the production of fecal pellets and the formation of aggre-gates, which are both a major source of biogenic matter to-wards the deep ocean, increase at the end of blooms (Thorn-ton, 2002), and BSi is better preserved in fecal pellets and aggregates (Moriceau et al., 2007). All together, these ob-servations suggest that most of the silica pump occurs during bloom events, under non limiting conditions.
Our results show that a large diatom may be more silici-fied under conditions of optimal growth than when its spe-cific growth rate is <∼ 40% of µmax due to Fe and Fe-L
limitations (Fig. 3f). If this pattern also holds for other large diatoms, especially HNLC ecologically relevant species, it might reinforce the impact of the spring bloom on the silicon sink. Besides, less silicified, Fe limited diatoms may dissolve more rapidly. Although this pattern has not been documented yet, high dissolution rates of biogenic silica have indeed been reported in Fe-limited systems such as the Southern Ocean (Beucher et al., 2004).
Overall, our results suggest that the decoupling between Si, C and N in surface waters of Fe and Fe-L limited areas may be less straightforward than previously thought. These results may have important implications for the understand-ing of the biogeochemical cycles and estimates of biogenic matter export.
5 Conclusions
General trends in the elemental composition of Fe limited and Fe-L co-limited diatoms could be determined by taking into account our results and literature data, and by consider-ing the degree of limitation (i.e. reduction in growth rate).
We showed that C and N per cell tend to decrease with Fe and Fe-L co-limitation for all species, but an increase in C:N with increasing limitation was only significant for the species we studied. Contrasting results between literature data on C and N contents in Fe-limited diatoms may be more related to growth conditions and cell volume variations than to in-terspecific differences. On the whole, these results show that using a constant C:N ratio to infer Si:C from Si:N, as often done for modelling and in situ experiments, may lead to a bias.
On the contrary, there was no significant trend in silica content when comparing different Fe or Fe-L limited di-atoms, which suggests that other interspecific differences than Fe-induced variations in cell volume influence the de-gree of silicification. The mechanisms controlling the sili-cification process are not fully elucidated yet and a few hy-potheses can be proposed to explain the role of iron in sili-cification. They include (i) the direct effect of Fe on silicon metabolism through the impairment of respiration, (ii) the
indirect control of Fe on the cell cycle via the cellular growth rate.
Variations in Si:C or Si:N seem to be more constrained, at least under mild limitation. For µ:µmax>40%, a clear trend
is indeed observed, with an increase in Si:N ratio with in-creasing limitation. Under more severe limitation, Si:N and Si:C tend to decrease. More in vitro, in situ and modelling studies are needed in that range of limitation, in order to fur-ther investigate the link between variations in the elemental composition, variations in the specific growth rate, and their impact on the biogeochemical cycles at the ecosystem level. Acknowledgements. The authors would like to thank two
anony-mous reviewers and D. Hutchins for their insightful comments
which improved this manuscript. This work was funded by
the support from the European Commission’s Marine Science and Technology Programme under Contract EVK2-1999-00227 (IRONAGES, “Iron Resources and Oceanic Nutrients – Advance-ments of Global Environment Simulations”) and the BOA project (ANR-05-BLAN-0153). The iron concentration in the background
medium was measured by M. Gallinari. A. Masson performed
carbon and nitrogen measurements. J. Helias is thanked for his help with the Fe limited cultures of T. oceanica.
Edited by: U. Riebesell
The publication of this article is financed by CNRS-INSU.
References
Allen, A. E., La Roche, J., Maheswari, U., Lommer, M., Schauer, N., Lopez, P. J., Finazzi, G., Fernie, A. R., and Bowler, C.: Whole-cell response of the pennate diatom Phaeodactylum
tri-cornutum to iron starvation, Proc. Natl. Acad. Sci., 105, 10438–
10443, 2008.
Aumont, O., Maier-Reimer, E., Blain, S., and Monfray, P.: An ecosystem model of the global ocean including Fe, Si, P co-limitations, Global Biogeochem. Cycles, 17(2), 1060, doi:10.1029/2001GB001745, 2003.
Barber, R. T. and Hiscock, M. R.: A rising tide lifts all phytoplank-ton: growth response of other phytoplankton taxa in diatom-dominated blooms, Global Biogeochem. Cycles, 20, GB4S03, doi:10.1029/2006GB002726, 2006.
Beucher, C., Tr´eguer, P., Corvaisier, R., Hapette, A. M., and Elskens, M.: Production and dissolution of biosilica, and chang-ing microphytoplankton dominance in the Bay of Brest (France), Mar. Ecol. Progr. Ser., 267, 57–69, 2004.
Boyd, P., LaRoche, J., Gall, M., Frew, R., and McKay, R. M. L.: Role of iron, light, and silicate in controlling algal biomass in subantarctic waters SE of New Zealand, J. Geophys. Res., 104, 13395–13408, 1999.
Boyle, E.: Pumping iron makes thinner diatoms, Nature, 393, 733– 734, 1998.
Chisholm, S. W., Azam, F., and Eppley, R. W.: Silicic acid incor-poration in marine diatoms on light:dark cycles: use as an essay for phased cell division, Limnol. Oceanogr., 23, 518–529, 1978. Claquin, P., Martin-J´ez´equel, V., Kromkamp, J. C., Veldhuis, M. J. W., and Kraay, G. W.: Uncoupling of silicon compared with carbon and nitrogen metabolisms and the role of the cell cycle in continuous cultures of Thalassiosira pseudonana (Bacillario-phyceae) under light, nitrogen, and phosphorus control, J. Phy-col., 38, 922–930, 2002.
Claquin, P. and Bucciarelli, E.: Cell cycle and silicification: Impact of an iron-light co-limitation on the marine diatom Thalassiosira
oceanica, in preparation, 2010.
de Baar, H. J. W. and La Roche, J.: Trace metals in the oceans: evolution, biology and global change, in: Marine science fron-tiers for Europe, edited by: Wefer, G., Lamy, F., and Mantoura, F., Springer-Verlag, Berlin Heidelberg New York Tokyo, 79–105, 2003.
de Baar, H. J. W., Boyd, P., Coale, K. H., Landry, M. R., Tsuda, A., Assmy, P., Bakker, D. C. E., Bozec, Y., Barber, R. T., Brzezinski, M. A., Buesseler, K. O., Boy´e, M., Croot, P. L., Gervais, F., Gor-bunov, M. Y., Harrison, P. J., Hiscock, W. T., Laan, P., Lancelot, C., Law, C. S., Levasseur, M., Marchetti, A., Millero, F. J., Nish-ioka, J., Nojiri, Y., van Oijen, T., Riebesell, U., Rijkenberg, M. J. A., Saito, H., Takeda, S., Timmermans, K. R., Veldhuis, M. J. W., Waite, A. M., and Wong, C. S.: Synthesis of iron fertilization experiments: from the Iron Age in the Age of Enlightenment, J. Geophys. Res., 110, C09S16, doi:10.1029/2004JC002601, 2005. Dugdale, R. C., Wilkerson, F. P., and Minas, H. J.: The role of a silicate pump in driving new production, Deep Sea Res., 42, 697–719, 1995.
Eppley, R. W. and Rogers, J. N.: Inorganic nitrogen assimilation of Ditylum brightwellii, a marine plankton diatom, J. Phycol., 6, 344–351, 1970.
Falkowski, P., Scholes, R. J., Boyle, E., Canadell, J., Canfield, D., Elser, J., Gruber, N., Hibbard, K., H¨ogberg, P., Linder, S., Mackenzie, F. T., Moore III, B., Pedersen, T., Rosenthal, Y., Seitzinger, S., Smetacek, V., and Steffen, W.: The global car-bon cycle: a test of our knowledge of Earth as a system, Science, 290, 291–296, 2000.
Falkowski, P. G., Barber, R. T., and Smetacek, V.: Biogeochemical controls and feedbacks on ocean primary production, Science, 281, 200–206, 1998.
Fasham, M. J. R., Flynn, K. J., Pondaven, P., Anderson, T. R., and Boyd, P. W.: Development of a robust marine ecosystem model to predict the role of iron in biogeochemical cycles: A compar-ison of results for iron-replete and iron-limited areas, and the SOIREE iron-enrichment experiment, Deep Sea Res., 53, 333– 366, 2006.
Firme, G. F., Rue, E. L., Weeks, D. A., Bruland, K. W., and Hutchins, D. A.: Spatial and temporal variability in phytoplank-ton iron limitation along the California coast and consequences for Si, N,and C biogeochemistry, Global Biogeochem. Cycles, 17, 1016, doi:1010.1029/2001GB001824, 2003.
Gallinari, M., Bucciarelli, E., Moriceau, B., and Ragueneau, O.: Dissolution properties of biogenic silica from diatoms grown under iron-replete and iron-limited conditions, in preparation, 2010.
Geider, R. J. and La Roche, J.: Redfield revisited: variability of C:N:P in marine microalgae and its biochemical basis, Eur. J. Phycol., 37, 1–17, 2002.
Goldman, J. C.: Inorganic carbon availability and the growth of large marine diatoms, Mar. Ecol. Prog. Ser., 180, 81–91, 1999. Hamm, C. E., Merkel, R., Springer, O., Jurkojc, P., Maier, C.,
Prechtel, K., and Smetacek, V.: Architecture and material prop-erties of diatom shells provide effective mechanical protection, Nature, 421, 841–843, 2003.
Hoffmann, L. J., Peeken, I., and Lochte, K.: Effects of iron on the elemental stoichiometry during EIFEX and in the diatoms
Fragilariopsis kerguelensis and Chaetoceros dichaeta,
Biogeo-sciences, 4, 569–579, 2007,
http://www.biogeosciences.net/4/569/2007/.
Hoffmann, L. J., Peeken, I., and Lochte, K.: Iron, silicate, and light co-limitation of three Southern Ocean diatom species, Polar Biol., 31, 1067–1080, 2008.
Hopkinson, B. M. and Barbeau, K. A.: Interactive influences of iron and light limitation on phytoplankton at subsurface chloro-phyll maxima in the eastern North Pacific, Limnol. Oceanogr., 53, 1303–1318, 2008.
Hudson, R. J. M. and Morel, F. M. M.: Iron transport in marine phytoplankton: kinetics of cellular and medium coordination re-actions, Limnol. Oceanogr., 35, 1002–1020, 1990.
Hutchins, D. A. and Bruland, K. W.: Iron-limited diatom growth and Si:N uptake ratios in a coastal upwelling regime, Nature, 393, 561–564, 1998.
IPCC: IPCC fourth assessment report: Synthesis report, http:// www.ipcc.ch/pdf/assessment-report/ar4/syr/ar4 syr.pdf, 2007. Irigoien, X., Flynn, K. J., and Harris, R. P.: Phytoplankton blooms:
a ‘loophole’ in microzooplankton grazing impact?, J. Plankton Res., 27, 313–321, 2005.
Jensen, S. and Bathmann, U.: Algae viability within copepod fae-cal pellets: evidence from microscopic examinations, Mar. Ecol. Progr. Ser., 337, 145–153, 2007.
Keller, M. D., Bellows, W. K., and Guillard, R. R. L.: Microwave treatment for sterilization of phytoplankton culture media, J. Exp. Mar. Biol. Ecol., 117, 279–283, 1988.
Landry, M. R., Selph, K. E., Brown, S. L., Abbott, M. R., Measures, C. I., Vink, S., Allen, C. B., Calbet, A., Christensen, S., and Nolla, H.: Seasonal dynamics of phytoplankton in the Antarctic
Polar Front region at 170◦W, Deep Sea Res., 49, 1843–1865,
2002.
La Roche, J., Murray, H., Orellana, M., and Newton, J.: Flavodoxin expression as an indicator of iron limitation in marine diatoms, J. Phycol., 31, 520–530, 1995.
Maldonado, M. T. and Price, N. M.: Influence of N substrate on Fe requirements of marine centric diatoms, Mar. Ecol. Prog. Ser., 141, 161–172, 1996.
Maldonado, M. T., Boyd, P. W., Harrison, P. J., and Price, N. M.: Co-limitation of phytoplankton growth by light and Fe during winter in the NE subarctic Pacific Ocean, Deep Sea Res. II, 46, 2475–2485, 1999.
Maldonado, M. T. and Price, N. M.: Nitrate regulation of Fe reduc-tion and transport by Fe-limited Thalassiosira oceanica, Limnol. Oceanogr., 45, 814–826, 2000.
Marchetti, A. and Harrison, P. J.: Coupled changes in the cell mor-phology and the elemental (C, N , and Si) composition of the pennate diatom Pseudo-nitzschia due to iron deficiency Limnol.
Oceanogr., 52, 2270–2284, 2007.
Marchetti, A. and Cassar, N.: Diatom elemental composition and morphological changes in response to iron limitation: a brief re-view with potential paleoceanographic applications, Geobiology, 7, 419–431, 2009.
Martin-J´ez´equel, V., Hildebrand, M., and Brzezinski, M. A.: Silicon metabolism in diatoms: implications for growth, J. Phycol., 36, 1–20, 2000.
Moore, C. M., Mills, M. M., Milne, A., Langlois, R., Achterberg, E. P., Lochte, K., Geider, R. J., and La Roche, J.: Iron limits pri-mary productivity during spring bloom development in the cen-tral North Atlantic, Global Change Biol., 12, 626–634, 2006. Moore, C. M., Hickman, A. E., Poulton, A. J., Seeyave, S., and
Lu-cas, M. I.: Iron-light interactions during the CROZet natural iron bloom and EXport experiment (CROZEX): II – Taxonomic re-sponses and elemental stoichiometry, Deep Sea Res., 54, 2066– 2084, 2007.
Moore, J. K., Doney, S. C., and Lindsay, K.: Upper ocean
ecosystem dynamics and iron cycling in a global three-dimensional model, Global Biogeochem. Cycles, 18, GB4028, doi:10.1029/2004GB002220, 2004.
Moriceau, B., Soetaert, K., Gallinari, M., and Ragueneau, O.: Im-portance of particles formation to reconstruct water column bio-genic silica fluxes, Global Biogeochem. Cycles, 21, GB3012, doi:10.1029/2006GB002814, 2007.
Muggli, D. L., Lecourt, M., and Harrison, P. J.: Effects of iron and nitrogen source on the sinking rate, physiology and metal com-position of an oceanic diatom from the subarctic Pacific, Mar. Ecol. Prog. Ser., 132, 215–227, 1996.
Nelson, D. M., Tr´eguer, P., Brzezinski, M. A., Leynaert, A., and Qu´eguiner, B.: Production and dissolution of biogenic silica in the ocean, Revised global estimates, comparison with regional data and relationship to biogenic sedimentation, Global Bio-geochem. Cycles, 9, 359–372, 1995.
Nelson, D. M., Anderson, R. F., Barber, R. T., Brzezinski, M. A., Buesseler, K. O., Chase, Z., Collier, R. W., Dickson, M. L., Franc¸ois, R., Hiscock, M. R., Honjo, S., Marra, J., Martin, W. R., Sambrotto, R. N., Sayles, F. L., and Sigmon, D. E.: Verti-cal budgets for organic carbon and biogenic silica in the Pacific sector of the Southern Ocean, 1996–1998., Deep Sea Res., 49, 1645–1674, 2002.
Peers, G., Quesnel, S.-A., and Price, N. M.: Copper requirements for iron acquisition and growth of coastal and oceanic diatoms, Limnol. Oceanogr., 50, 1149–1158, 2005.
Peers, G. and Price, N. M.: Copper-containing plastocyanin used for electron transport by an oceanic diatom, Nature, 441, 341– 344, 2006.
Petroutsos, D., Terauchi, A. M., Busch, A., Hirschmann, I., Mer-chant, S. S., Finazzi, G., and Hippler, M.: PGRL1 Participates in Iron-induced Remodeling of the Photosynthetic Apparatus and in Energy Metabolism in Chlamydomonas reinhardtii, J. Biol. Chem., 284, 32770–32781, 2009.
Pondaven, P., Fravalo, C., Ruiz-Pino, D., Tr´eguer, P., Qu´eguiner, B., and Jeandel, C.: Modelling the silica pump in the Permanently Open Ocean Zone of the Southern Ocean, J. Marine Syst., 17, 587–619, 1998.
Pondaven, P., Ragueneau, O., Tr´eguer, P., Hauvespre, A., Dezileau, L., and Reyss, J.-L.: Resolving the ’opal pradox’ in the Southern Ocean, Nature, 405, 168–172, 2000.
Pondaven, P., Gallinari, M., Chollet, S., Bucciarelli, E., Sarthou, G., Schultes, S., and Jean, F.: Grazing-induced changes in cell wall silicification in a marine diatom, Protist, 158, 21–28, 2007. Price, N. M., Harrison, G. I., Hering, J. G., Hudson, R. J., Nirel, P.
M. V., Palenik, B., and Morel, F. M. M.: Preparation and chem-istry of the artificial algal culture medium Aquil, Biol. Oceanogr., 6, 443–461, 1988/1989.
Price, N. M.: The elemental stoichiometry and composition of an iron-limited diatom, Limnol. Oceanogr., 50, 1159–1171, 2005. Ragueneau, O. and Tr´eguer, P.: Determination of biogenic silica in
coastal waters : applicability and limits of the alkaline digestion method, Mar. Chem., 45, 43–51, 1994.
Rijstenbil, J. W. and Gerringa, L. J. A.: Interactions of algal ligands, metal complexation and availability, and cell responses of the diatom Ditylum brightwellii with a gradual increase in copper, Aquat. Toxic., 56, 115–131, 2002.
Rogerson, A., DeFreitas, S. W., and McInnes, A. G.: Growth rates and ultrastructure of siliceous setae of Chaetoceros gracilis (Bac-cilariophyceae), J. Phycol., 22, 56–62, 1986.
Sarthou, G., Timmermans, K. R., Blain, S., and Tr´eguer, P.: Growth physiology and fate of diatoms in the ocean: a review, J. Sea Res., 53, 25–42, 2005.
Sigmon, D. E., Nelson, D. M., and Brzezinski, M. A.: The Si cycle in the Pacific sector of the Southern Ocean: seasonal diatom pro-duction in the surface layer and export to the deep sea, Deep Sea Res., 49, 1747–1763, 2002.
Smetacek, V.: Diatoms and the Ocean Carbon Cycle, Protist, 150, 25–32, 1999.
Strzepek, R. F. and Price, N. M.: Influence of irradiance and tem-perature on the iron content of the marine diatom Thalassiosira
weissflogii (Bacillariophyceae), Mar. Ecol. Prog. Ser., 206, 107–
117, 2000.
Strzepek, R. F. and Harrison, P. J.: Photosynthetic architecture dif-fers in coastal and oceanic diatoms, Nature, 431, 689–692, 2004. Sunda, W. G., Swift, D. G., and Huntsman, S. A.: Low iron require-ment for growth in oceanic phytoplankton, Nature, 351, 55–57, 1991.
Sunda, W. G. and Huntsman, S. A.: Iron uptake and growth lim-itation in oceanic and coastal phytoplankton, Mar. Chem., 50, 189–206, 1995.
Sunda, W. G. and Huntsman, S. A.: Interrelated influence of iron, light and cell size on marine phytoplankton growth, Nature, 390, 389–392, 1997.
Takeda, S.: Influence of iron availability on nutrient consumption ratio of diatoms in oceanic waters, Nature, 393, 774–777, 1998. Thornton, D. C. O.: Diatom aggregation in the sea: mechanisms
and ecological implications., Eur. J. Phycol., 37, 149–161, 2002. Timmermans, K. R., Stolte, W., and de Baar, H. J. W.: Iron-mediated effects on nitrate reductase in marine phytoplankton, Mar. Biol., 121, 389–396, 1994.
Timmermans, K. R., Davey, M. S., van der Wagt, B., Snoek, J., Gei-der, R. J., Veldhuis, M. J. W., Gerringa, L. J. A., and de Baar, H. J. W.: Co-limitation by iron and light of Chaetoceros brevis, C.
dichaeta and C. calcitrans (Bacillariophyceae), Mar. Ecol. Prog.
Ser., 217, 287–297, 2001a.
Timmermans, K. R., Gerringa, L. J. A., de Baar, H. J. W., van der Wagt, B., Veldhuis, M. J. W., de Jong, J. T. M., Croot, P. L., and Boye, M.: Growth rates of large and small Southern Ocean di-atoms in relation to availability of iron in natural seawater, Lim-nol. Oceanogr., 46, 260–266, 2001b.
Timmermans, K. R., van der Wagt, B., and de Baar, H. J. W.: Growth rates, half-saturation constants, and silicate, nitrate, and phosphate depletion in relation to iron availability of four large, open ocean diatoms from the Southern Ocean, Limnol. Oceanogr., 49, 2141–2151, 2004.
Timmermans, K. R., Veldhuis, M. J. W., and Brussaard, C. P. D.: Cell death in three marine diatom species in response to different irradiance levels, silicate, or iron concentrations, Aquat. Microb. Ecol., 46, 253–261, 2007.
Waite, A. M., Thompson, P. A., and Harrison, P. J.: Does energy control the sinking rates of marine diatoms?, Limnol. Oceanogr., 37, 468–477, 1992.
![Table 1. Inorganic Fe concentrations in the medium ([Fe ′ ], in pmol L −1 ) at high light (HL) and low light (LL) for T](https://thumb-eu.123doks.com/thumbv2/123doknet/13747791.437511/4.892.464.819.91.473/table-inorganic-concentrations-medium-pmol-high-light-light.webp)