Double-Sided Microchannel Patterning and Through-Hole Production Using Injection Molding of Polypropylene
By
Nancy Diaz
Submitted to the Department of Mechanical Engineering in Partial Fulfillment of the Requirements for the Degree of
Bachelor of Science at the
Massachusetts Institute of Technology February 2008
MASSACHUSETTS INSTITE OF TECHNOLOGY
AUG 14 2008
LIBRARIES
C 2008 Nancy Diaz. All rights reserved.
The author hereby grants to MIT permission to reproduce and to
distribute publicly paper and electronic copies of this thesis document in whole or in part in any medium now known or hereafter created.
,1 Signature of Author...
I
Certified by... ... Nancy Diaz Department of Mechanical Engineering- February 1, 2008
...
David E. Hardt Professor of Mechanical Engineering Thesis SupervisorAccepted by..
John H. Leinhard V Chairman, Undergraduate Thesis Committee
Double-Sided Microchannel Patterning and Through-Hole
Production Using Injection Molding of Polypropylene
By Nancy Diaz
Submitted to the Department of Mechanical Engineering on February 1, 2008 in Partial Fulfillment of the Requirements for the
Degree of Bachelor of Science in Mechanical Engineering ABSTRACT
An experimental study was conducted on injection molded polypropylene parts with microchannels and through-holes. The quality of the microchannels and through-holes was observed with optical microscope and SEM images. A part-to-part variation analysis was conducted for ten parts by averaging the channel height, channel width, and hole diameter measurements obtained with an optical profilometer. The results were compared to a research study previously conducted on hot embossed and through-hole punched parts.
The walls of the injection molded microchannels were observed to be smoother than the hot embossed microchannels, but ridges were detected on the outmost channels of the injection molded parts which resulted in measurement errors. The through-holes of the injection molded parts formed completely, without burrs or flash, in contrast to the through-hole punched parts where the quality of the hole varied by the substrate material. The average variance ratio of the channel height and width of the injection molded parts was 0.83% and 0.21% respectively, when the sites containing ridges (sites 1 and 4 of the top side) were not included in the calculation. The average channel height variance ratios were approximately the same for injection molding and hot embossing, while injection molding had less than half the variance ratio for the channel width. The hole diameter variance ratios of the injection molded parts averaged 0.094%, making it better than the other dimensions. No consistent expansion or shrinkage rate was observed in the injection molded parts, but the hot embossed sites primarily experienced shrinkage.
Thesis Supervisor: Professor David E. Hardt Title: Professor of Mechanical Engineering
Table of Contents TABLE OF CONTENTS ... 5 LIST OF FIGURES ... 6 LIST OF TABLES ... ACKNOWLEDGEMENTS ... 8 1 INTRODUCTION ... ... 9
2 FABRICATION METHODOLOGIES OF MICROFLUIDIC DEVICES... 11
2.1 HOT EMBOSSING AND THROUGH-HOLE PUNCHING... 11
2.1.1 M old Fabrication and Experiment ... 12
2.1.2 Part-to-Part Variation Analysis of Embossed and Punched Polycarbonate Parts... ... 13
2.1.3 Hole Formation and Surface Texture ... 15
2.2 INJECTION M OLDING ... .. ... 16
3 EXPERIMENTAL PROCEDURE ... 19
3.1 INJECTION M OLDED PART DESIGN ... ... 19
3.2 MOLD DESIGN AND FABRICATION... ... 20
3.3 INJECTION MOLDING THE MICROCHANNELS AND THROUGH-HOLES...22
3.3.1 Post Fracture... ... ... ... ... 23
3.4 MEASURING THE MICROCHANNELS AND THROUGH-HOLES ... ... ... 24
3.4.1 M easurem ent P atterns ... 24
3.4.2 Measurement Stitching ... ... 25
3.4.3 Repeatability Tests... 26
4 RESULTS AND DISCUSSION ... 28
4.1 Q UALITATIVE A NALYSIS ... ... ... 28
4.1.1 H ole Form ation ... 28
4.1.2 Surface Texture... ... 31
4.2 PART-TO-PART VARIATION ANALYSIS ... 34
5 CONCLUSIONS ... ... 40
6 FUTURE W ORK ... ... 42
REFERENCES ... 44
APPENDIX A: INJECTION MOLDING PROCESSING CONDITIONS ... .... 46
DETERMINING THE FINAL CONDITIONS ... ... 46
FINAL PROCESSING CONDITIONS ... .. ... ... 46
List of Figures
Figure 1: H ot em bossing setup ... ... 12
Figure 2: Brass core mold for hot embossing and through-hole punching... 13
Figure 3: Location of the measured sites on the hot embossing mold [8] ... 14
Figure 4: SEM image of hot embossed PC part [5] ... ... 15
Figure 5: SEM image of 0.5 mm hole punched in COP [5] ... 16
Figure 6: Embossed 0.5 mm channel in COP [5] ... 16
Figure 7: Injection m olding m achine... ... 18
Figure 8: Top side of the injection molded part design... ... .. 20
Figure 9: Bottom side of the injection molded part design... 20
Figure 10: D raw ing of core m old (in.)... 21
Figure 11: Drawing of cavity mold (in.) ... 22
Figure 12: (a) Post fracture sequence on core mold and (b) final injection molded part ... 23
Figure 13: Measurement pattern for the "top" of the part (cavity side)... . 25
Figure 14: Measurement pattern for the "bottom" of the part (core side) ... 25
Figure 15: Run chart for determining the standard deviation of the optical profilometer ... 26
Figure 16: Run chart for determining the procedure variability ... 27
Figure 17: Injection m olded part... ... 28
Figure 18: SEM image of tilted back (core) side, channel 2 ... ... 29
Figure 19: SEM image of top (cavity) side, channel 2 ... ... 29
Figure 20: Optical microscope image of (a) tilted part on the back side and (b) zoomed in view30 Figure 21: SEM images of (a) channel 3 on the top side and (b) channel 2 on the bottom side.. 30
Figure 22: SEM image of tilted view of hole from the top side ... . 31
Figure 23: Optical microscope image of (a) channel 2 on top side and (b) zoomed in view ... 32
Figure 24: Optical microscope image of (a) a tilted view of channel 3 on top side and (b) a zoomed in view ... 32
Figure 25: SEM image of (a) channel 1 on top side and (b) zoomed in image of channel 1 ... 33
Figure 26: SEM image of channel 2 on the top side... ... 33
Figure 27: Optical microscope images of (a) channel 1 and (b) channel 2 on cavity mold ... 34
Figure 28: Leveled channel data for Part 71, site 3 on the top side ... 35
Figure 29: Run charts for site 1 on the top of the part ... ... 35
Figure 30: Rotating the channel profile of site 1 of part 31 on the top side ... 36
Figure 31: "Leveled" data of site 1 of part 31 on the top side ... 37
Figure 32: Run charts for hole diameters measured from the bottom side... 38
Figure 33: Run charts for site 2 on the top of the part ... ... 48
Figure 34: Run charts for site 3 on the top of the part ... ... 48
Figure 35: Run charts for site 4 on the top of the part ... ... 48
Figure 36: Run charts for site 1 on the bottom of the part... ... 49
Figure 37: Run charts for site 2 on the bottom of the part... ... 49
Figure 38: Run charts for site 3 on the bottom of the part... ... 49
List of Tables
Table 1: Channel dimensions of 20 hot embossed PC parts [5] ... 14
Table 2: Average variance ratio of the 20 hot embossed PC parts ... 14
Table 3: Injection molding processing conditions ... .22
Table 4: Stitching areas for the bottom side ... 26
Table 5: Channel measurements for the top and bottom of 10 PP parts ... 36
Table 6: Standard deviation over the average measured part dimensions ... 38
Table 7: Percent expansion and shrinkage of the average injection molded dimensions ... 39
Acknowledgements
I would like to thank Professor David E. Hardt for his guidance in helping me realize my thesis project. I would also like to acknowledge Ph.D. candidate, Aaron Mazzeo, for helping me commence my research, introducing me to the Zygo, and guiding me through the statistical analysis of my project. I would also like to thank Patrick McAtamney for his assistance with designing and manufacturing the molds for hot embossing and injection molding, as well as David Dow for his assistance with injection molding the microfluidic devices; both are technical instructors at the Laboratory for Manufacturing and Productivity machine shop. Machine shop instructor Mark Belanger from the Edgerton Student Shop was a tremendous help in machining the molds used in the hot embossing and through-hole punching process. The optical microscope images were made possible by Jim Serdy and Professor Emanuel Sachs of the Laboratory for Manufacturing and Productivity for allowing the use of their optical microscope. I would like to thank Brian Anthony for having provided me with the Angled Viewing and Illumination (ANVIL) Image Metrology (IM) images of the injection molded parts. Lastly, but most definitely not least, I would like to thank my family and friends for having supported me throughout my time here at MIT.
1 Introduction
The worldwide microfluidic device industry has grown to nearly $2 billion USD [1]. Initially, these devices were primarily used in inkjet printing, but their applications have expanded to flow cytometry, cell sorting, DNA sequencing, mixing, polymeric change reactions, and bioassays to name a few examples [2].
Microfluidic devices were originally manufactured with glass and silicon through processes such as photolithography and etching [3]. Recently, there has been a gradual shift towards the use of plastic because of its lower cost, "favorable properties," and a faster manufacturing rate [4]. Another breakthrough in the microfluidic device industry was the ability to manufacture double-sided embossed parts. Double-sided devices allow for more complex microfluidic channel designs and a smaller part area, which can be particularly beneficial when the micromachining work area is limited.
In this study, injection molded double-sided microchannel and through-holes will be compared to hot embossed and through-hole punched parts with a focus on the quality of the parts produced. Hot embossed and through-hole punched parts were manufactured and a part-to-part variation analysis was conducted in a previous study. The goals of this research project are to:
1. Manufacture injection molded double-sided microchannel and through-hole parts 2. Conduct a qualitative analysis that compares both processes in regards to
a. Hole formation b. Surface texture
3. Conduct a part-to-part variation analysis on ten injection molded parts to compare to hot embossing and through-hole punching, specifically analyzing the
a. Channel height b. Channel width
2 Fabrication Methodologies of Microfluidic Devices
Initially, microfluidic devices were made by relatively expensive processes such as photolithography and wet/dry etching. The manufacturing processes for microfluidic devices have grown to include but are not limited to: injection molding, hot embossing, casting, and laser processing. Sections 2.1 and 2.2 will describe the "hot embossing and through-hole punching"
and injection molding processes, respectively.
2.1 Hot Embossing and Through-Hole Punching
The hot embossing of microscale features has existed since the 1990s. Embossing consists of heating a substrate polymer to a temperature slightly above the glass transition temperature and then deforming the material plastically with a formed tool. In most cases with microscale features, embossing has been limited to patterning of only one side of the substrate. However, the need to facilitate complex fluid network designs requires multiple layers of channels with through-hole vias for interlayer flow. In recent work at MIT, the ability to both emboss and
create holes in a polymer substrate in a one-step process has been investigated [5].
To combine double-sided hot embossing and through-hole punching two molds must first be manufactured for creating the microscale features. A punching mold, also known as the core mold, contains posts for piercing the polymer structure and embossing features like channels, for example. The receptor mold, also known as the cavity mold, contains holes that serve as the receptor for the posts and embossing features, if desired.
Once the molds are manufactured and ready for embossing, a thin polymer substrate must be cut to the desired dimension. The punching and receptor molds are secured in a die set for proper alignment and this system is inserted into the platens of a controlled heating and cooling unit. The polymer substrate is then placed on the receptor mold. The molds and polymer
substrate are heated to a temperature near the polymer's glass transition temperature. Since the polymer substrate is not heated to the point where it becomes molten and it is instead deformed at the quasi-solid state, hot embossing is not constricted to a small range of part thicknesses [6].
Once the embossing temperature is reached, it is held constant as the die set is compressed at a specified velocity. The substrate is first punched then embossed since the thickness of the part is generally larger than the embossed feature. The size of embossed features can "range from several micrometers to hundreds of micrometers" [7]. The system is kept at a predetermined pressure or force for the part's "hold time," after which it is cooled to a demolding temperature, the molds are separated, and the part is removed.
rlgure 1: not emoossing setup
2.1.1 Mold Fabrication and Experiment
At the Laboratory for Manufacturing and Productivity (LMP) molds were designed and manufactured for hot embossing and through-hole punching double-sided microfluidic devices with channels and through-hole vias in a one-step process [5]. Polymethlymethacrylate (PMMA), polycarbonate (PC), and cyclic olefin polymer (COP) were used as the polymer
substrates in this experiment. The punching mold included posts with varying conical tip geometries of 250, 45", and 900 half angles, post diameters of 0.5, 0.75, 1, and 2 mm, and channel heights of 0.102 mm (see Figure 2 below). The receptor holes had a diameter greater than the post diameter by 0.002 in. (50 gm) to provide sufficient clearance while punching through the polymer substrate.
Figure 2: Brass core mold for hot embossing and through-hole punching
The molds were machined on a conventional CNC mill using a 1/16 in. flat end mill with a spindle speed less than 7,500 rpm. The molds and polymer substrate were heated to a temperature between 135 and 1430C and were held at a hold time ranging between 2 and 3 minutes. The most time consuming step in the process was heating the die set, molds, and substrate to the desired temperature. This step took approximately 15 minutes; a length of time which is dependent on the efficiency of the heat transfer system.
2.1.2 Part-to-Part Variation Analysis of Embossed and Punched Polycarbonate Parts The average channel heights and widths of twenty embossed PC parts were calculated by Mazzeo [5] using the Zygo NewVision 5000 optical profilometer and the data averaging and feature extraction method described in [2]. Table 1 below presents the resulting statistical data
from which it was concluded that the average variance ratio' for the channel height was below
0.5% and for the channel width was below 0.9% (see Table 2).
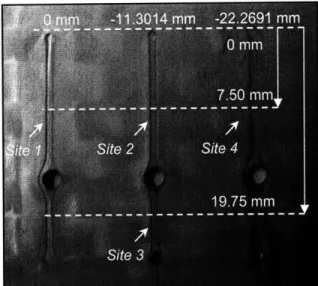
Site 3 X: -22.8 mm Y: 19.8 mm Site 2 X: -11.4 mm Y: 12.3 mm Site 1 X: 0 mm Y: 3.4 mm
Figure 3: Location of the measured sites on the hot embossing mold [8] Table 1: Channel dimensions of 20 hot embossed PC parts [5]
Meas. Ave. Std. Meas. Ave. Std.
Mold Part Dev. Mold Part Dev.
Height Height Part Width Width Part
(lrm) (pm) Height (Ipm) (jpm) Width
(jm) (Jm) Site 117.2 115.2 0.811 487.3 481.5 4.40 1 Site 120.3 118.6 0.415 514.8 539.1 5.83 2 Site 120.9 119.3 0.396 489.3 485.4 2.99 3 Ave 119.5 117.7 0.541 497.14 502.0 4.41
Table 2: Average variance ratio of the 20 hot embossed PC parts
Channel Height Channel Width
Ave. Variance Ratio 0.46% 0.87%
2.1.3 Hole Formation and Surface Texture
The hole quality and surface replication seemed to be a function of the material used. By comparing Figure 4 with Figure 5 (taken with a Scanning Electron Microscope [SEM]), one notes that the variation of hole formation in through-hole punched parts spans a very wide spectrum and differed dramatically for PC and COP. The holes of both Figure 5 and Figure 6 had undesirable rough edges. The quality of the channels varied as well by material. The hot
embossed features in the PC parts (see Figure 4) were much smoother than the features in the COP parts (see Figure 6). Specifically, the walls of the channels were flatter and had a lower surface roughness in the PC parts than in the COP parts.
rfigure o: mDoossea u.z mm cnannel in cUr 151
2.2 Injection Molding
Hot embossing consists of the deformation of a substrate in a quasi solid state while injection molding requires molten polymer which is injected into the core and cavity molds. Hot embossing therefore requires less energy than injection molding, resulting in a lower cost of production. Additionally, the low flow rate of the hot embossing substrate makes it possible to create delicate microstructures; internal stresses are avoided, so high-aspect ratio parts are much more feasible than with injection molding [4, 9]. The primary advantage of injection molding over hot embossing is that it generally has a much faster cycle time for polymer fabrication. An
injection molded microfluidic device can be produced in less than half a minute while hot embossed parts typically require more than 10 minutes per part, where time is predominantly spent heating the mold and polymer substrate. Recently though, it has been shown that the total cycle time for hot embossed parts can be accomplished in a fraction of a minute [10].
The injection molding process can be summarized by the functions of the four main machine components:
* an injection unit to melt, inject, and pack the polymer into the cavity mold, * a clamping unit to open and close the molds,
* a drive system to deliver power to the injection molding machine,
* and a control system to control the motions of the machine and optimize the processing conditions [11 ].
In the injection molding process, the core and cavity molds are first installed in the injection molding machine (see Figure 7 below) and the molds are closed with a specified clamping force or pressure. The polymer is fed through a hopper and enters the injection barrel by the force of gravity. The polymer is melted with heaters and injected through a nozzle into the cavity mold typically by a screw system [ 11]. Once the material is packed (slightly overfilling the mold) to accommodate for the volumetric shrinkage of the resin, the molds are cooled so that the polymer may solidify. The molds are then released and the part is ejected from the core mold with ejector pins.
3 Experimental Procedure
The objective of this study is to injection mold double-sided microchannels and through-holes so that a part-to-part variation analysis can be conducted and compared to a previous study of hot embossing and through-hole punching. In order to do so, core and cavity molds were machined on a HAAS VF-OE with toolpaths which were created on Mastercam 9.1. The test parts were injection molded with polypropylene on an Engel E980/3 injection molding machine and a Zygo optical profilometer was used to measure the hole diameters, channel heights, and channel widths. Once the measurement data was obtained, a part-to-part variation analysis was conducted on every tenth part of the 100 produced with the final processing conditions, and statistical data was generated using the analysis method of Mazzeo [5] for the channel widths, channel heights, and hole diameters.
3.1
Injection Molded Part Design
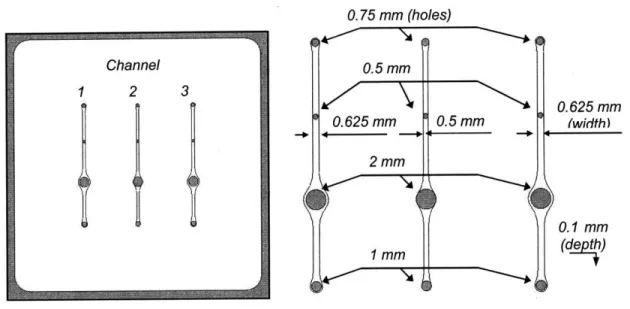
The injection molded part was designed to be double-sided to not only mimic current microfluidic device designs, but also to provide more features for analysis. The nominal hole diameters varied from 0.5 mm to 2 mm as can be seen in Figure 8 and Figure 9. One channel on both the top and bottom side was kept as a control to resemble the hot embossed parts that were manufactured in Mazzeo [5]. Channel 2 on the top side was kept at the width of the smallest hole diameter, 0.5 mm, while channels 1 and 3 were increased in width by 25% of the smallest hole diameter or 1.25* dpot. On the bottom side, channel 4 represented the control with a 1 mm width and channels 1, 2, and 3 had widths of 1.25*dpo,,t similar to the top side. Both sides had channel heights of 0.1 mm (0.004 in.) and the part had a thickness of 0.0625 in.
0. 75 mm (holes)
0.5 mm
0.625 mm 0.5 mm 1mm2 mm
1 mm
m 0.625 m (width) 0.1 mmFigure 8: Top side of the injection molded part design
0. 75 mm (holes)
0.5 mm
2 mm
1 mm
Figure 9: Bottom side of the injection molded part design
3.2 Mold Design and Fabrication
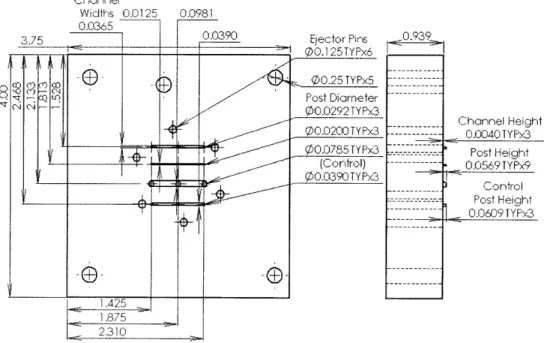
Core and cavity molds were designed for injection molding the double-sided microchannels and holes that resembled those previously produced through hot embossing and through-hole punching techniques [5]. As can be seen in Figure 10, the posts were made 60 [tm taller than the 1/16 in. (1.5875 mm) part thickness to minimize flash [12]. The area of the entire part
Channel
2
3
Channel 2 4 _ _ i 0.9375 mm twidth) * 0.625 mm 2.5 mm 0.1 mm 1 mm ~I1I~1I~C(lb~a~ t~l~sd47 ; I '.M- ; ý , " ' t ,_ , -- A--was 2 in. by 2 in. (see Figure 11) to increase the distance between the ejector pin and the features. The molds were machined from aluminum 6061-T6 on a HAAS VF-OE with pocket and contour toolpaths which were defined in Mastercam 9.1. In determining which diameter end mill should be used, it was ideal to choose a large diameter that fit the smallest distance between the channels so that a fast spindle speed and feed rate was possible. Therefore, a new 0.25 in. end mill was used so that burr formation on the mold was minimal.
Channel 0.939 Channel Height --- 0.0040TYPx3 Post Height 0.0569TYPx9 Control Post Height 0.0609TYPx3 - - - - - - ---.
Runner Runner
)1A )C
Figure 11: Drawing of cavity mold (in.)
3.3 Injection Molding the Microchannels and Through-Holes
The parts were injection molded out of polypropylene on an Engel E980/3 injection molding machine with a 25 mm set screw. The principle injection molding parameters can be found in Table 3 below:
Table 3: Injection molding processing conditions
Parameter Value Unit
Clamping force 30 tons
Set screw feed stroke 0.80 in Injection hold time 8.0 S
Cooling time 15 S
Polymer temperature 400 "F
The temperature listed is approximately the temperature of the molten polypropylene entering the cavity mold; the temperature of the molds could not be obtained. To minimize flash and short shots the initial, nominal conditions for polypropylene were altered. This included changing the clamping force, set screw feed stroke, pressure, injection speed, and the injection stroke as detailed in Appendix A. Sixty-five parts were made before the ideal processing
conditions were found. An additional 10 parts were made at the ideal conditions to ensure that flash was not produced and the molds were adequately filled. Once confirmed, 100 parts were injection molded that were used in the part-to-part variation analysis described in section 3.4 below. All parts were made in a continuous time slot at an average rate of 28 seconds per part. A comprehensive list of the final injection molding processing conditions can also be found in Appendix A.
3.3.1 Post Fracture
During the period of time when the injection molding processing conditions were being finalized, seven posts were fractured on the core mold. The first post fractured during the ejection of part number 9. This was a 0.5 mm post, the smallest post diameter, and it was at the edge of the channel (see Figure 12). It was followed by the fracture of another 0.5 mm post located on the opposite edge of the same channel during the ejection of part number 14. By part number 59 during this experimental run, the seventh and final post had fractured (a 1 mm post). This was the post which was closest to an ejector pin relative to the other 1 mm posts on the same channel. The remaining 1 mm posts and all 2 mm posts remained intact throughout the rest of the experimental runs and during the final run.
Figure 12: (a) Post fracture sequence on core mold and (b) final injection molded part
4 5 3
6
The fracture of these posts was caused by a large pull-out force during ejection, indicating a significant normal force on the pin sides after the part had cooled. This was most likely caused by shrinkage of the material around the posts, roughness of the pin side walls, and possibly a small burr at the top of the post.
3.4 Measuring the Microchannels and Through-Holes
3.4.1 Measurement Patterns
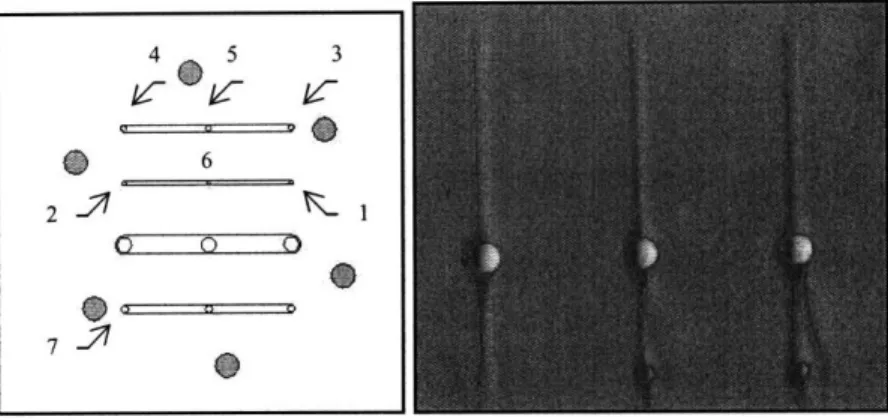
A Zygo optical profilometer with MetroPro 8.1.5 software was used to measure the channel height, channel width, and hole diameter of every tenth part. A minimum of one site per channel was selected for measurement on both the "top" (cavity side) and "bottom" (core side) of the injection molded device. The hole diameters were measured from the bottom side to avoid measurement errors caused by the misalignment of the hole and channel. All sites were measured with a 20 times magnification lens and 0.4 image zoom. A pattern of the sites which were measured can be seen in Figure 13 and Figure 14. Although sites 2 and 3 theoretically had the same widths, both sites were measured to detect any variability in the width of the channel. Sites 1 and 4 were measured with an extended upward scan of 200 im since the surface roughness of the outer walls prevented an accurate measurement with a shorter scan length. Sites 2 and 3 were smoother so a bipolar scan was conducted at 150 gtm to obtain a higher resolution. When measuring the hole diameters a 40[m bipolar scan was used also to obtain a higher resolution and to decrease the measurement time. The Zygo measurements were saved in
Figure 13: Measurement pattern for the "top" of the part (cavity side)
Figure 14: S(core side)
3.4.2 Measurement Stitching
The widths of sites 1, 2, and 4 and the diameter of holes 1 and 2 of the bottom side of the part exceeded the measurable area of the lens. To account for this, the sites were measured multiple times across the width. The measurements were thereafter "stitched" together. This was done automatically by using the stitch control option in MetroPro and setting a specified "X and Y Size" to measure. These values are tabulated in Table 4 for all stitched sites on the bottom of the part. The scan began at the site location identified in Figure 14 and swept across the specified area from the top right, scanning towards the left. If necessary, the scan continued to the next
row sweeping from right to left again until it reached the bottom left corner of the specified area. The size of the measurable area in one screenshot was approximately 0.9 mm tall by 0.7 mm wide, so the channels that were stitched together consisted of only one row of scanning, but multiple shifts to the left, while the hole measurements contained multiple rows and shifts. A 25% overlap of the sites was used for more accurate stitching.
Table 4: Stitching areas for the bottom side
Site AX [mm] AY [mml 1 1.50 0.65 2 2.80 0.65 3 -4 1.30 0.65 Hole 1 1.18 1.20 Hole 2 2.36 2.25 3.4.3 Repeatability Tests
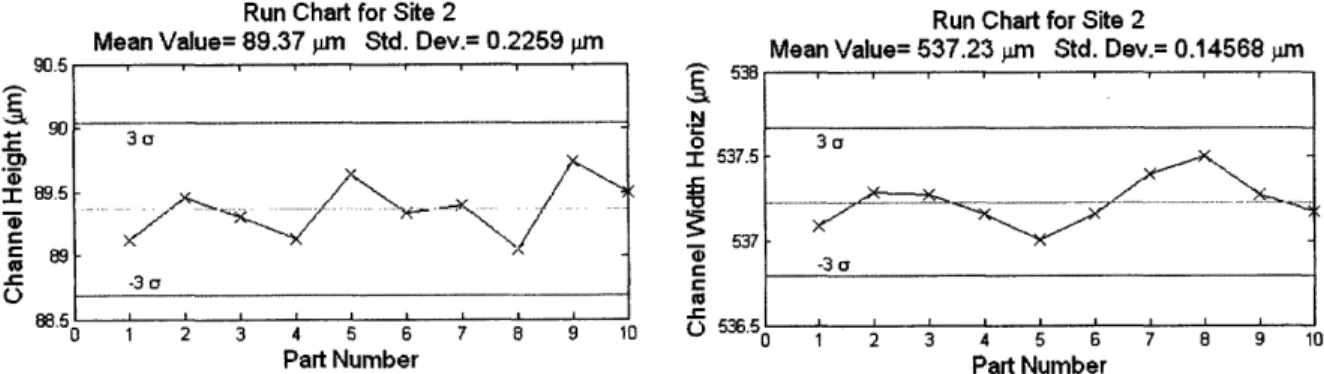
To insure that accurate measurements were taken on the optical profilometer, two repeatability tests were conducted. First, an injection molded part was continuously measured, ten times at the same site without moving the part or altering the magnification. Figure 15 shows that the standard deviation of the channel height and width were 0.226 and 0.146 jim, respectively, and the variance ratio of the channel height was 0.253%. Although the width was six times the height, the variance ratio was only 0.0271%. The statistical analysis used to obtain these results will be explained in section 4.2.
Run Chart for Site 2 Run Chart for Site 2
Mean Value= 89.37 pm Std. Dev.= 0.2259 pm Mean Value= 537.23 pm Std. Dev.= 0.14568 pm
90.5 . .. -• 390 0 e- ~0 5 337.5 ". ... . .. S"537 S89 . S -3o 88.556 0 1 2 3 4 5 6 7 8 9 10 536.5 30 -3 a S1 2 3 4 5 6 7 8 10
Part Number Part Number
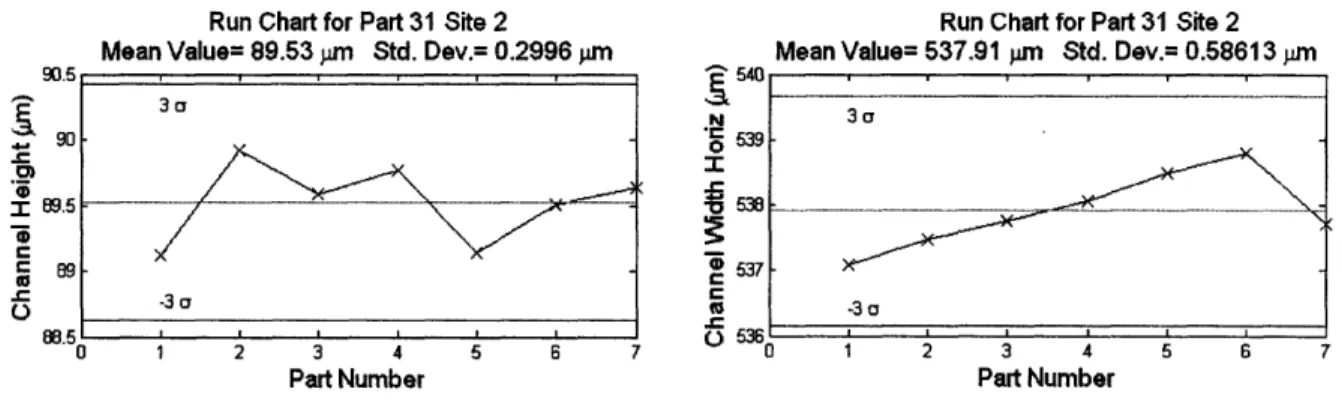
Seven measurements were then taken of part number 31. Between each measurement, the part was removed from the stage, the magnification was altered, the stage was moved, the part was reinserted onto the stage, the magnification was set, and the top side of part 31 was re-measured at site 2. This was done to calculate the variation in the procedure itself so that the part-to-part variation analysis could be validated. The pertinent results were a standard deviation of 0.300 gim for the channel height and 0.586 Lpm for the channel width (see Figure 16), and variance ratios of 0.335% and 0.109% for the channel height and width, respectively.
Run Chart for Part 31 Site 2 Run Chart for Part 31 Site 2 Mean Value= 89.53 j.im Std. Dev.= 0.2996 pim Mean Value= 537.91 jm Std. Dev.= 0.58613 jim
_. _ _ , 1 1 I 34U .N 3 90 - 539 S89 '~ 537 - -3 o -3a I.5I ! 536561 1 I I L 0 1 2 3 4 5 6 7 0 1 2 3 4 5 6
Part Number Part Number
Figure 16: Run chart for determining the procedure variability
4 Results and Discussion
4.1 Qualitative Analysis
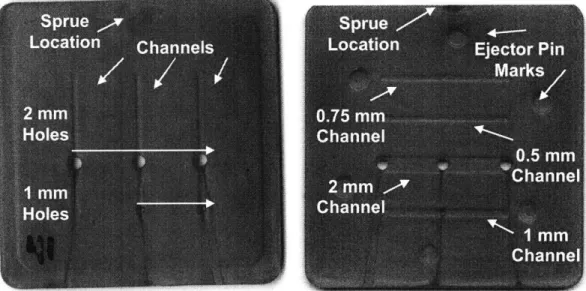
One hundred parts were injection molded in a continuous time slot averaging 28 seconds per part using the ideal conditions listed in Table 3. The Angled Viewing and Illumination (ANVIL) Image Metrology (IM)2 image of the injection molded part, Figure 17, highlights the relative placement of the channels and holes on the part. Only three 2 mm holes and two 1 mm holes were made because of the post fracture previously described in section 3.3.1.
pSue
* Cae
20m
Hole
Figure 17: Injection molded part
4.1.1 Hole Formation
The injection molded parts had better hole formation than the hot embossed parts. Even when the processing conditions of the injection molding machine were not finalized, the holes did not contain any significant burrs on the edges, only some evidence of internal burrs (see Figure 18). Figure 19 shows that some flash was present initially and qualitatively confirms that the core and cavity molds were misaligned since the hole was offset relative to the channel on
2 ANVIL-IM is a new method under development at the MIT Laboratory for Manufacturing and
Productivity (LMP)
Sprue
Mak
2 mrn
the cavity side. More importantly, the mold misalignment varied from part to part, indicating a lack of precision in the injection molding machine clamp mechanism.
(prior to finalizing the injection molding processing conditions)
Figure 19: SEM image of top (cavity) side, channel 2 (prior to finalizing the injection molding processing conditions)
The improvement made to the holes of the injection molded parts after the processing conditions were finalized was dramatic. Figure 20 and Figure 21 confirm that the holes formed completely and no flash is evident. This is in contrast to the punched through-holes, where in some instances the material was not completely removed and large burrs were formed as was mentioned in section 2.1.3. Another positive outcome which resulted from finalizing the process
condition of the injection molding machine was that the hole walls were now smooth as is shown
in Figure 22. Overall, the hole formation of the injection molded parts proved to be of better
quality than the through-hole punched parts because of the lack of flash on the hole and the lack
of burrs lining the edge and inside wall of the hole.
Figure 20: Optical microscope image of (a) tilted part on the back side and (b) zoomed in view
Figure 21: SEM images of (a) channel 3 on the top side and (b) channel 2 on the bottom side
IM image of tilted view of hole from the top side 4.1.2 Surface Texture
The surface texture of microchannels is also particularly important because a rough wall can lead to undesirable changes in the velocity profile and pressure drop of a microfluidic device [13]. The surface texture of the injection molded parts was expected to be better than the hot embossed parts since the injection molded parts have to solidify and conform to the shape of the mold. Optical microscope and SEM images were obtained to verify this hypothesis. No surface texture variations between channels 1, 2, and 3 (on the top side of the part) were visible without magnification of the part. However, as was mentioned in section 3.4.1 there was an inconsistency in the profile of the three channels because a larger scan was required to measure the height of channels 1 and 3. By comparing Figure 23 and Figure 24 taken with an optical microscope, the existence of a ridge on the right wall of channel 3 is evident, which is not present on channel 2.
gure 23: Uptical microscope i hRHHUI & UH wp slue ana to} zoomeo m view
Figure 24: Optical microscope image of (a) a tilted view of channel 3 on top side and (b) a zoomed in view
SEM images clarified the inconsistency in the surface texture of the channels. The roughness
of the outer edge of channel 1 (see Figure 25) was evident in comparison to channel 2 (see Figure 26), confirming the rough profile of channel 1 when it was measured. This possibly resulted from the close proximity of the ejector pins to the channels. If the part was not completely cooled upon ejection, the left and right set of ejector pins could have deformed channels 1 and 3 on the top side of the part by making the channels forcefully encompass the
protruding channel edges of the core mold. Note that the floor of the channel was fairly smooth and that the intersection of the floor and wall is slightly rough, but far better than the top edge.
Figure 25: SEM image of (a) channel 1 on top side and (b) zoomed in image of channel 1
Optical microscope images were taken of the cavity mold to confirm that the rough surface texture was a result of the injection molding process and not the mold itself. Comparing Figure 27 (a) with (b), one notes that the edges of channels 1 and 2 (channels 3 and 2 respectively on the top side of the part) have no distinct difference in roughness. In fact, channel 2 had slightly more burrs than channel 1.
rigure r /: upucal microscope images oi (a) channel I and (b) channel 2 on cavity mold
In comparison to the hot embossed channels, the floor of the injection molded microchannels was much smoother than the embossed COP channels, but about the same as the embossed PC channels. The ridges on the outer edges of channels 1 and 3 in the injection molded parts did not exist on the hot embossed parts. This can be partly because the hot embossed parts were slowly demolded by hand. If the cooling time of the injection molded parts was increased, the deformation of the channels may be avoided.
4.2 Part-to-Part Variation Analysis
In order to obtain the height and width measurements of the sites, the files were first converted from .xyz to .mat, then the average height and widths were calculated on MATLAB. The technique used to calculate these measurements and the statistical data resembled that done by Mazzeo [2]. The profile of the measured channel was rotated and the average height was calculated, as well as the horizontal width. In Figure 28, the height is the distance between the top and bottom horizontal lines. The horizontal width is the distance between the midpoints of the channel. The standard deviation of the average channel height, channel width, and hole diameter for the ten parts was calculated and a run chart, like that in Figure 34, was produced for
each site. A complete list of the data can be found in Table 5 below for all sites, and the remaining run charts are in Appendix B.
Image Flipped Average Height--89.4547 pum
XZ Horiz. Width=534.8308 p.m XZ Midpt Dist.=534 8309 pLm
RL Mean Value= 9 IUo . 00 I 95 - 90 (-o -500 -400 -300 -200 -100 0 100 200 300 400 500 Xeveled (JIM)
Figure 28: Leveled channel data for Part 71, site 3 on the top side
In Chart for Site 1 Run Chart for Site 1
4 08 ,,m td De v = 2 752 ,,rn Mean Value= 683.18 mrn Std. Dev.= 5.0103 ji
7uu 690 680 670 r~rn 0 2 4 6 8 10 U z 4 0 a lu
Part Number Part Number
Figure 29: Run charts for site 1 on the top of the part
Table 5 shows that the standard deviation of the average part width on the top side varies from 0.965 to 5.01 [m, which is a large span for only four sites. This was attributed to the effects of the ridges on the channels 1 and 3. Since the ridge made the channel height appear much larger than it was and the height and width measurement calculator rotates the profile about the top of the part, the rotating function overcompensated for the ridge (see Figure 30). This overcompensation resulted in a height and width that are too large as can be seen in Figure
31. Since the width also proves to be much larger because of the existing ridges, the
3 c -3 a I I I f I I I I I I · · · .' " .· . . - '"" ~nr /UU 85, vvu 7 P 7 *7
inconsistency in the ridges from part to part explains the 3.36 and 5.01 ptm standard deviations of sites 1 and 4 on the top side.
Table 5: Channel measurements for the top and bottom of 10 PP parts
I
Meas. Mold Ave. Part Std. Dev. Meas. Mold Ave. Part IStd. Dev. I90.07 I 0.601 I 3 543.5 532.6 0.965 94.89 90.49 0.551 1 1030 1032 2.38 102.3 96.58 1.07 2 2533 2504 2.91 106.3 85.16 0.676 3 674.7 673.2 2.30 101.5 100.7 0.616 4 970.5 973.4 2.17 106.0 102.4 1.20
Hole Meas. Mold Diameter (pm) Ave. Part Diameter (pm) Standard Deviation (pm)
1 972 958.6 2.24 2 2043 1969 3.00 Z centered vs Xcentered 100 F I I 50 Cu _ -50. -100 150I I I 500 -4 300 -200 .100 0 100 200 3u 400 5 Xcentered
Rotated by 2.6665 degrees about Y-axis
50 -0 . n I 500 -400 300 -200 -100 0 Xcentered Y rot 100 200 000 400 500
Figure 30: Rotating the channel profile of site 1 of part 31 on the top side II
I I
E
v
rJ
LD
CU
CU
Image Flipped Average Height=95.578 pn
XZ Horiz. Width=691.5422 p.m XZ Midpt Dist.=691.7854 pun
I0 Xleveled ( )
Figure 31: "Leveled" data of site 1 of part 31 on the top side
The standard deviation of the hole diameters were worse than the majority of the channel width and channel height standard deviations. Figure 32 shows that there is at least one outlier in
each of the hole diameter measurements. The run chart for the one 1 mm hole shows that part number 7 (part number 61 in the injection molding sequence) had a diameter measurement which approaches three standard deviations away from the mean value. If this measurement was removed, the standard deviation of the 1 mm hole diameter measurements would decrease from 2.25 Rm to 0.76 [tm. A similar outlier occurred with the 2 mm hole measurements where part number 9 (part number 81 in the injection molding sequence) was considerably above the mean. Once this outlier was removed, the standard deviation dropped to nearly two-thirds its original value, from a standard deviation of 3.00 [pm to 2.13 pim. The effect of removing this outlier was not as powerful as when the 1 mm hole diameters were adjusted, but it was indeed significant.
970
Run Chart fol' 1 mm holes
Mean Value: 958.6~n Std. Dev.: 2.249~
1980
Run Chart for 2 111m Holes
Mean Value: 1969.2).lffi Std. Dev.: 3.0029 ).lffi
4 5 6 Part Number 9 10 -3a 4 5 6 Part Number 8 10
Figure 32: Run charts for hole diameters measured from the bottom side
The average variance ratios of the channel height and width measurements were 0.83% and 0.21 % respectively, not taking into consideration sites 1 and 4 on the top side. Note that Mazzeo [5] reported an average variance ratio of less than 0.90/0 for hot embossed channel widths and
less than 0.5% for channel heights. The hole diameters had lower variance ratios than the
channel heights and channel widths. Therefore, hot embossing and injection molding had similar successes in replicating the channel height, but injection molding is slightly better at producing larger features, such as the channel width and hole diameter of low-aspect ratio parts.
Channel Avera e:
e
o ... ... o ~ Hole 1 2 1.110/0 0.790/0 0.61% 1.170/0 Diameter 0.080/0** 0.110/0** 0.230/0 0.120/0 0.340/0 0.220/0 Hole Avera e: 0.0940/0*Not included in the channel avera e calculations **Does not include outliers
As shown in Table 7, the percent expansion/shrinkage of the injection molded parts was not similar for all sites. The channel height of the 2 mm channel shrank the most (site 2 on the bottom side) by a massive 19.91%, while some features such as the channel heights of sites 1 and 4 on the bottom side expanded slightly. This variation is not as evident in the hot embossed and through-hole punched PC parts (see Table 8) where the part primarily experienced less than 2% shrinkage and 4.72% expansion for one site. Both hole diameters of the injection molded parts shrank, which was anticipated since multiple posts had fractured. Greater shrinkage of the injection molded parts in comparison to the hot embossed parts was also expected since polymer substrates which are hot embossed are not in molten state.
Table 7: Percent expansion and shrinkage of the average injection molded dimensions
2 -1.26% -5.12% 3 -2.02% -4.64% 1 0.17% -5.57% 2 -19.91% -1.14% 3 -0.21% -0.74% 4 0.30% -3.38% Hole Diameter 1 -1.31% 2 -3.67% Table 8: Percent ex p
ansion and shri s
Site Channel Heights Channel Widths
1 -1.71% -1.19%
2 -1.41% 4.72%
3 -1.32% -0.80%
'-1----1-~--1 -~~~---
-~-5 Conclusions
The goal of this study was to investigate the use of injection molding for producing microchannels and holes in polypropylene. The results of the test were in the form of specific dimensional measurements and their variations over a large number (100) of parts, as well as qualitative evaluation of the results. The results were then compared to similar tests performed using hot embossing and through-hole punching.
In the initial tests, seven posts on the tooling (used to produce the through holes) fractured and remained in the parts; however, for the remainder of the tool significant data was still produced. Also, ridges formed on the outer edges of the top side of the injection molded part. The surface texture of the channels produced in the injection molding process was much smoother, which is important in microfluidic applications. The holes formed completely and without burrs in the injection molded parts, so hole formation was better by injection molding
than through-hole punching.
In the part-to-part variation analysis, the sites of channels 1 and 3 had to be removed because of the ridges that formed on these channels. The injection molded channel widths had less than one-third the average variance ratio of the hot embossed channel widths, but the channel heights were slightly better when embossed in terms of repeatability. The hot embossing and through-hole punching process had better consistency in overall shrinkage of the dimensions as was expected. There was also minimal, if any, damage done to the core mold used for hot embossing whereas in the injection molding process seven posts were fractured because of the force applied to the cooled part from the ejector pins. The holes produced in the injection molded part had a very low standard deviation and variance ratio once the outliers were removed, which is
promising for the process and should be compared to measured through-hole punched parts when burrs are minimized.
6 Future Work
My first recommendation is that the core molds be redesigned to include a 1" or 20 draft angle on all posts to decrease the possibility of fracture. The use of steel dowel pins instead of posts milled directly into the core would also minimize the damage caused to the mold during the injection molding cycle. If plate interlocks were added to the mold design, the alignment of the molds could also improved to accommodate for the inprecise clamping mechanism of the injection molding machine [14].
I also recommend that further research be conducted on the injection molding of microfluidic devices with different material types such as polymethylmethacrylate (PMMA), polycarbonate (PC), and cyclic olefin polymer (COP) so that a direct comparison can be made to the hot embossing and through-hole punching analysis by material. With a part-to-part variation analysis for each material type, one can also note which material fares better than the others when injection molding on the microscale.
A more complex pattern can also be designed for further analysis on both the hot embossing and through-hole punching process and the injection molding process. For example, a mixer would exhibit parallel channels with a critical turning radius. This radius could be measured for both sides of the channel which would be especially important when injection molding since shrinkage is much greater than in hot embossing. Another possibility would be to incorporate high-aspect ratios in the design [15]. In this analysis, height to width ratios of 0.2, 0.133, 0.1, and 0.05 were used, so if the channels were designed to be much deeper one can note whether or not the variance ratios of the width and height dimensions increased dramatically.
Lastly, if the ridges on channels 1 and 3 cannot be removed I recommend that the statistical analysis program conducted on MATLAB be altered to account for the ridges in the rotation of
the profile. This way a more accurate measurement of the channel heights and widths may be obtained.
References
[1] K.H. Thaker, Design of a Micro-Fluidic Functional Testing System for Process Characterization of a Hot Micro-Embossing Machine, S.M. Thesis, Massachusetts Institute of Technology, June 2006, 1-31.
[2] A. Mazzeo and D.E. Hardt, "Toward the Manufacture of Micro and Nano Features with Curable Liquid Resins: Mold Materials and Part-to-part Dimensional Variation," International Symposium on Nanomanufacturing, Singapore, Jan 25, 2008.
[3] G.M. Whitesides and A.J. Stroock, "Flexible Methods for Microfluidics," Physics Today online, June 2001, retrieved on Nov 2007 from http://webster.aip.org/pt/vol-54/iss-6/p42.html#bio
[4] G.T. Shoji, Modeling and control of a hot micro-embossing machine, S.M. Thesis, Massachusetts Institute of Technology, 2006, 15-31.
[5] A. Mazzeo, N. Diaz, M. Dirckx, and D.E. Hardt, "Single-step through-hole punching and double-sided hot embossing of microfluidic channels," Plastics Encounter at ANTEC 2007 Conference Proceedings, Cincinnati, OH, 2007.
[6] O. R6tting, W. R6pke, H. Becker, C. Gdirtner, "Polymer microfabrication technologies," Journal of Microsystem Technologies, Vol 8, 2002, 32-36.
[7] Q. Wang, Process window and variation characterization of micro embossing process, S.M. Thesis, Massachusetts Institute of Technology, June 2006, 16-45.
[8] A. Mazzeo, N. Diaz, M. Dirckx, and D.E. Hardt, "Single-step through-hole punching and double-sided hot embossing of microfluidic channels," Presented at the Plastics Encounter at ANTEC 2007 Conference, Cincinnati, OH, Sept 12, 2007.
[9] M. Heckele, W. Bacher, K. D. Miiller, "Hot embossing -The molding technique for plastic microstructures," Journal of Microsystem Technologies, Vol 4, No 3, May 1998, 122-124.
[10] D. Yao, P. Nagarajan, R. Kuduva-Raman-Thanumoorthy, A.Y. Yi, and B.H. Kim, "Embossing-Based Process Variants for Polymer Microfabrication," International Symposium on Nanomanufacturing, Singapore, Jan 25, 2008.
[11] G. Pbtsch and W. Michaeli, Injection Molding: An Introduction, Hanser, New York, 1995, 57-79.
[12] Q. F. Polosky, "Injection Molding a Flash Free Microfluidic Structure," U.S. Patent No. 1,414,632, Washington, D.C.: U.S. Patent and Trademark Office, 2004.
[13] Y. Hu, C. Werner, and D. Li, "Influence of Three-Dimensional Roughness on Pressure-Driven Flow Through Microchannels," Journal of Fluids Engineering, Vol 125, Sept 2003, 871-879.
[14] J. Greener and R. Wimberger-Friedl, Precision Injection Molding: Process, Materials, and Applications, Hanser, Cincinnati, OH, 2006, 310.
[15] A.-C. Liou and R.-H. Chen, "Injection molding of polymer micro- and sub-micron structures with high-aspect ratios," The International Journal of Advanced Manufacturing Technology, Vol 28, No 11-12, May 2006, 1097-1103.
Appendix A: Injection molding processing conditions
Determining the Final Conditions
Part Set Screw Clamping Injection
Range Feed Stroke [in] Force [tons] Stroke
1-2 0.70 25 2 Short shot and considerable flash 3-5 0.80 25 2 Filled, but with flash
6-21 0.75 25 2 Flash was still present 22-23 0.90 30 2 Flash was still present 24-25 0.85 30 2 Flash was still present
Changed holding pressure [psi] 26 0.85 30 2 (400 500 700 x's 6 500 400)
Changed holding pressure [psi] 27-30 0.85 30 2 (300 400 500 600 x's 5 500 400) 31-51 0.80 30 2 Flash free, but short shot
52-55 0.80 30 2 Injection speed [in/s] (0.4 0.3 0.2 0.1) Changed holding pressure [psi] 56-64 0.80 30 2 (400 500 600 x's 6 500 400) 65-75 0.80 30 1 Flash free and completely filled
Final Processing Conditions
Parameter Value Unit
Clamping force 30 tons
Set screw feed stroke 0.80 in Screw feeding profile 75x5 rpm
Injection Stroke 1
Boost pressure 1399 psi Hydraulic pressure 73 psi Injection boost time 0.10 s
8.00 s
Elapsed injection time 0.62 s Injection hold time 8.0 s
Cooling time 15 s
Recycle time* 0.1 s
Sprue break** 0
*Time before molds close again after part has been ejected **No sprue break was used
Parameter Injection Speed
400
500
Profile0.41 0.31 0.21
Unit 0. 1 in/s Profile Unit6001 6001 6001 6001 6001 6001
500
400
psi
Parameter Holding Pressure ''Appendix B: Run Charts of Channel Heights and Widths Run Chart for Site 2
Mean Value= 90.07 rnm Std. Dev.= 0.6014 jim
0 2 4 6 8 10
Run Chart for Site 2
Mean Value= 539.22 pm Std. Dev.= 1.0362 pm
544 N S542 540-'I, C r 5 536 Part Number 2 4 6 Part Number
Figure 33: Run charts for site 2 on the top of the part
Mean Value=
Run Chart for Site 3
90.49 pm Std. Dev.= 0.5505 prm
- J3o
-3 cy .. ... ... . ... .
. ....
Run Chart for Site 3
Mean Value= 532.56 pm Std. Dev.= 0.9649 pnm
C N "534 0 532 ~530 -c T 628 2 4 6 8 10 0 Part Number 2 4 6 8 10 Part Number
Figure 34: Run charts for site 3 on the top of the part
110 a 108 t-2' 106 - 104 S102
Run Chart for Site 4
Mean Value= 104.7 pm Std. Dev.= 1.561 tpm
2 4 6 Part Number Me ^ 700 N 695 0 r an 685 -i _ rU U
Run Chart for Site 4
Value= 685.71 prm Std. Dev.= 3.2604 pm
2 4 6
Part Number
8 10
Figure 35: Run charts for site 4 on the top of the part
91 i-.) c M 90 e 89 (3 3o -3 88 3 o -3 a I i i I J3 F 'a 4-C Cr 'U r-0 3 o -o 3 -3 o 30 I -J o . ... ....... .. .... ..... .... 92 88 536 m I I I I "'" L I I I I -... --r · y vrcr -.. ' -...
Run Chart for Site 1
Mean Value= 96.58 jim Std. Dev.= 1.07 pm
Run Chart for Site 1
Mean Value= 1031.9 pm Std. Dev.= 2.375 pm
1020
2 4 6 8 10
Part Number
2 4 6 8 10
Part Number
Figure 36: Run charts for site 1 on the bottom of the part
Run Chart for Site 2
Mean Value= 85.16 pm Std. Dev.= 0.6764 jnm
Run Chart for Site 2
Mean Value= 2503.5 jmrn Std. Dev.= 2.9058 pm
1 2 3 4 5 6 7 8 9 1 Part Number . 2510 0 I 2505 2500 c 2495 S2-40 t• 7Ana 0 0 1 2 3 4 5 6 Part Number 7 8 9 10
Figure 37: Run charts for site 2 on the bottom of the part
Mean
Run Chart for Site 3
Value= 100.7 jm Std. Dev.= 0.6163 man
0 2 4 6
Part Number
Run Chart for Site 3
Mean Value= 673.24 pm Std. Dev.= 2.3009 pm
- 685 N 680 I -c. " 675 S670 t--r• c 8 10U U / //\ -3 a Part Number 8 10 Suy
Figure 38: Run charts for site 3 on the bottom of the part
30 -3 c i87 0-86 85 W 84 834 0 /~ '-' / 'N 3 //\-. - -- '' --- > " 102 101 4) I3 S100 (_ 99 C) 0 3a A' -JoL;
...
...
....
.
...
.
...
...
...
0 I -"i $ M X " " IU,3 & Lv---Run Chart for Site 4
Mean Value= 102.4 pm Std. Dev.= 1.196 pm Mean Value= 973.35 im Std. Dev.= 2.1745 Run Chart for Site 4 am
2 4 6 8 10
Part Number Part Number
Figure 39: Run charts for site 4 on the bottom of the part
4) -r c 100 -c 98 ( 3. . -- .. . .. 30r . . '• X A j \ / I --3 -3 os I · I I

![Figure 3: Location of the measured sites on the hot embossing mold [8]](https://thumb-eu.123doks.com/thumbv2/123doknet/14753087.581115/14.918.209.695.206.518/figure-location-measured-sites-hot-embossing-mold.webp)