Accurate measurement of in-plane thermal
conductivity of layered materials without metal film
transducer using frequency domain thermoreflectance
The MIT Faculty has made this article openly available. Please share
how this access benefits you. Your story matters.
Citation Qian, Xin et al. "Accurate measurement of in-plane thermal
conductivity of layered materials without metal film transducer using frequency domain thermoreflectance." Review of Scientific Instruments 91, 6 (June 2020): 064903
As Published http://dx.doi.org/10.1063/5.0003770
Publisher AIP Publishing
Version Author's final manuscript
Citable link https://hdl.handle.net/1721.1/125778
Terms of Use Creative Commons Attribution-Noncommercial-Share Alike
Accurate Measurement of In-plane Thermal Conductivity of Layered Materials without Metal Film Transducer using Frequency Domain Thermoreflectance
Xin Qian, Zhiwei Ding, Jungwoo Shin, Aaron J. Schmidt, and Gang Chen*
Department of Mechanical Engineering,
Massachusetts Institute of Technology, Cambridge, MA 02139, USA Corresponding Email: gchen2@mit.edu
Abstract
Measuring anisotropic thermal conductivity has always been a challenging task in thermal metrology. Although recent developments of pump-probe thermoreflectance techniques such as variable spot sizes, offset pump-probe beams and elliptical beams have enabled the measurement of anisotropic thermal conductivity, a metal film transducer for the absorption of the modulated pump laser beam and the detection of the thermoreflectance signal. However, the existence of the transducer would cause in-plane heat spreading, suppressing the measurement sensitivity to the in-plane thermal conductivity. In addition, the transducer film also adds complexity to data processing, since it requires careful calibration or fitting to determine extra parameters such as the film thickness and conductivity, and interface conductance between the transducer and the sample. In this work, we discussed the methodology for measuring in-plane thermal conductivity of layered semiconductors and semimetals without any transducer layer. We show that the removal of transducer results in the dominantly large sensitivity to in-plane thermal conductivity compared with other parameters, such as cross-plane thermal conductivity and the absorption depth of the laser beams. Transducerless frequency-domain thermoreflectance (FDTR) measurements are performed on three reference layered-materials, highly ordered
pyrolytic graphite (HOPG), molybdenum disulfide (MoS2) and bismuth selenide (Bi2Se3), and
demonstrated using the analytical thermal model that the measured in-plane thermal conductivity
hor’s peer reviewed, accepted manuscript. Howe
ver, the online
version of record will be different
from this
version
once it has bee
n copyedited an d typeset. PLEASE CIT E THIS ARTI C LE AS DOI: 10.1063/5.0003770
showed much-improved accuracy compared with conventional FDTR measurement with a transducer.
I. Introduction
Anisotropic materials are commonly found in lots of applications such as thermoelectrics,1, 2
power electronics3-5 and lithium-ion batteries.6-11 Characterizing anisotropic thermal conductivity
of these materials is not only of interest to scientific communities but also of fundamental importance to designing and advancing such technologies. In recent years, several pump-probe
techniques based on either time-domain thermoreflectance (TDTR)12, 13 or frequency-domain
thermoreflectance (FDTR)14-16 have been developed for measuring the anisotropic thermal
conductivity of materials. For example, the in-plane thermal conductivity 𝑘𝑟 and the cross-plane
thermal conductivity 𝑘𝑧 of transversely isotropic materials can be separately measured by tuning
the laser spot size and/or the modulation frequency of the lasers.5, 17-19 Further, the beam-offset
approach developed by Feser et al.20 and the elliptical beam approach by Jiang et al. 21 and Li et.
al. 22 were shown capable of measuring the in-plane anisotropic thermal conductivity using
TDTR. All these techniques require metal transducer films for the absorption of the pump beam and the detection of thermoreflectance to serve as the heater and the thermometer. The existence of metal films, however, would cause in-plane heat spreading that suppresses the sensitivity to the in-plane thermal conductivity, especially for transducers with high thermal conductivity such
as aluminum and gold.21, 23 Although using thinner transducers with low thermal conductivity
such as NbV helps to increase the measurement sensitivity,24 accurate measurement of 𝑘
𝑟
remains challenging for materials with low in-plane thermal conductivity 𝑘𝑟 < 5 W/mK. 23
hor’s peer reviewed, accepted manuscript. Howe
ver, the online
version of record will be different
from this
version
once it has bee
n copyedited an d typeset. PLEASE CIT E THIS ARTI C LE AS DOI: 10.1063/5.0003770
In this paper, we show that the in-plane thermal conductivity of layered semiconductors or semimetals can be accurately determined without using any metal transducers. Similar to the
method by Yang et. al., 25 we consider the optical absorption of a semi-infinite non-transparent
sample by solving a thermal model with nonhomogeneous source terms for volumetric heating. However, full thermal conductivity tensor is included in the thermal model such that it is applicable to any crystalline symmetry. Three layered materials are measured using both
conventional FDTR and beam-offset technique in this work, including HOPG, MoS2 and Bi2Se3
with in-plane thermal conductivity ranging from a few W/mK to ~2000 W/mK. Measurement results using both techniques showed excellent consistency and agree well with the literature values.
hor’s peer reviewed, accepted manuscript. Howe
ver, the online
version of record will be different
from this
version
once it has bee
n copyedited an d typeset. PLEASE CIT E THIS ARTI C LE AS DOI: 10.1063/5.0003770
II. Thermal Model with Light Absorption and Full Thermal Conductivity Tensor
Figure 1. Schematic of a semi-infinite sample during a pump-probe measurement with offset
pump and probe beam. The pump and probe lasers have 1/e absorption depths of 𝛿0 and 𝛿1,
respectively. The thermal properties of the semi-infinite sample include volumetric heat capacity
𝐶 and the thermal conductivity tensor 𝑘𝑖𝑗 where 𝑖, 𝑗 = (𝑥, 𝑦, 𝑧).
Figure 1 shows a measurement configuration with offset pump and probe beams on a semi-infinite solid. No crystalline symmetry is assumed here and the model includes the full thermal
conductivity tensor 𝑘𝑖𝑗. Using such configuration, the solution in principle can be used for any
type of anisotropy, and for either conventional FDTR measurement with overlapping pump and probe, or the beam-offset FDTR measurements. To model the optical absorption of the pump
laser, an exponentially decaying source terms is added to the heat equation:26
𝐶𝜕𝑇 𝜕𝑡 = 𝑘𝑖𝑗 𝜕2𝑇 𝜕𝑥𝑖𝜕𝑥𝑗+ 1 𝛿0𝑃(𝑥, 𝑦, 𝑡) ⋅ 𝑒 −𝛿𝑧 0 (1)
hor’s peer reviewed, accepted manuscript. Howe
ver, the online
version of record will be different
from this
version
once it has bee
n copyedited an d typeset. PLEASE CIT E THIS ARTI C LE AS DOI: 10.1063/5.0003770
where 𝐶 is the volumetric heat capacity, 𝑘𝑖𝑗 is the thermal conductivity tensor element with 𝑖, 𝑗 =
(𝑥, 𝑦, 𝑧) denotes the Cartesian coordinates, which is symmetric 𝑘𝑖𝑗 = 𝑘𝑗𝑖 due to the Onsager
reciprocity and time-reversal symmetry.27 𝑃(𝑥, 𝑦, 𝑡) is the profile of the heat generation at the
sample surface due to the pump laser. 𝛿0 is the absorption depth of the pump-laser. Instead of
surface heat flux, the laser heating in transducerless configuration is modeled as a volumetric
heat source with an exponential decaying profile. Such exponential form 1
𝛿0𝑃(𝑥, 𝑦, 𝑡) ⋅ 𝑒
−𝑧
𝛿0 can
be obtained by solving Maxwell’s equation in an absorbing media,28 which is valid as long as the
characteristic length of 𝛿0 is much longer than the diffusion length of the photo-excited
carriers.25, 29 Taking the Fourier transform to both in-plane coordinates 𝑥, 𝑦 and the to time 𝑡 such
that 𝑇(𝑡, 𝑥, 𝑦, 𝑧) → 𝜃(𝜔, 𝜉, 𝜂, 𝑧), the heat equation is rewritten as:
𝑖𝜔𝐶𝜃 = −(𝑘𝑥𝑥𝜉2+ 𝑘𝑦𝑦𝜂2+ 2𝑘𝑥𝑦𝜉𝜂)𝜃 + 𝑘𝑧𝑧𝑑 2𝜃 𝑑𝑧2 + 2𝑖(𝑘𝑥𝑧𝜉 + 𝑘𝑦𝑧𝜂) 𝑑𝜃 𝑑𝑧 + 1 𝛿0 𝑃(𝜉, 𝜂, 𝜔) ⋅ 𝑒− 𝑧 𝛿0 (2)
Eq. (2) can be rearranged as an inhomogeneous ordinary differential equation:
𝑑2𝜃 𝑑𝑧2 + 𝜆2 𝑑𝜃 𝑑𝑧− 𝜆1𝜃 + 1 𝑘𝑧𝑧𝛿0𝑃(𝜉, 𝜂, 𝜔) ⋅ 𝑒 −𝛿𝑧 0 = 0 (3) where 𝜆1 =𝑖𝜔𝐶 𝑘𝑧𝑧 + ( 𝑘𝑥𝑥 𝑘𝑧𝑧𝜉 2+2𝑘𝑥𝑦 𝑘𝑧𝑧 𝜉𝜂 + 𝑘𝑦𝑦 𝑘𝑧𝑧𝜂 2) (4) 𝜆2 = 2𝑖 (𝑘𝑥𝑧 𝑘 𝜉 + 𝑘𝑦𝑧 𝑘 𝜂) (5)
hor’s peer reviewed, accepted manuscript. Howe
ver, the online
version of record will be different
from this
version
once it has bee
n copyedited an d typeset. PLEASE CIT E THIS ARTI C LE AS DOI: 10.1063/5.0003770
With an adiabatic boundary condition (𝑑𝜃
𝑑𝑧)𝑧=0= 0 at the surface, the temperature response is
solved as: 𝜃(𝜔, 𝜉, 𝜂, 𝑧) = 𝑃(𝜉, 𝜂, 𝜔) 𝑘𝑧𝑧𝛼(1 − 𝜆2𝛿0 − 𝜆1𝛿02)⋅ (𝑒 −𝛼𝑧− 𝛼𝛿 0𝑒 −𝛿𝑧 0) (6) where 𝛼 =𝜆2 2 + √𝜆1 2+ (𝜆2 2) 2
. For a Gaussian pump beam, 𝑃(𝜉, 𝜂) = 1
2𝜋exp [−
𝑤02 8 (𝜉
2+ 𝜂2)]
where 𝑤0 is the 1/e2 radius.
Different from conventional FDTR model using surface reflection when the sample is coated with transducer, calculating transducerless FDTR signal needs to consider bulk reflection of the probe beam, and the reflectance generated by 𝜃 depends on the depth. Therefore the FDTR signal 𝐻(𝜔) is calculated by integrating the temperature response over the 𝑧 −dependent probe
profile:26 𝐻(𝜔, 𝑥0, 𝑦0) = ∬ [∫ 𝜃(𝜔, 𝜉, 𝜂, 𝑧) ⋅ 1 𝛿1 𝑆(𝜉, 𝜂, 𝑥0, 𝑦0) ⋅ 𝑒− 𝑧 𝛿1𝑑𝑧 ∞ 0 ] 𝑑𝜉𝑑𝜂 ℝ2 (7)
where the integration range for (𝜉, 𝜂) is the entire plane ℝ2 = (−∞, ∞) × (−∞, ∞), 𝛿1 is the
absorption depth of the probe beam as shown in Figure 1, and 𝑆(𝜉, 𝜂, 𝑥0, 𝑦0) =
1
2𝜋exp (−
𝑤12 8 (𝜉
2+ 𝜂2)) ⋅ exp(𝑖𝜉𝑥
0+ 𝑖𝜂𝑦0) is the Fourier transform of the probe laser profile
with 1/e2 radius of 𝑤1 and offset coordinate (𝑥0, 𝑦0) relative to the center of the pump beam. For
the semi-infinite sample, the integration of 𝑧 variable can be analytically obtained, and the final
result for frequency-domain and offset-dependent FDTR signal 𝐻(𝜔, 𝑥0, 𝑦0) is calculated as:
hor’s peer reviewed, accepted manuscript. Howe
ver, the online
version of record will be different
from this
version
once it has bee
n copyedited an d typeset. PLEASE CIT E THIS ARTI C LE AS DOI: 10.1063/5.0003770
𝐻(𝜔, 𝑥0, 𝑦0) = 1 4𝜋2∬ 𝒢(𝜉, 𝜂, 𝜔) ⋅ 𝑒 [−(𝑤0 2+𝑤 12)(𝜉2+𝜂2) 8 ]⋅ 𝑒(−𝑖𝜉𝑥0−𝑖𝜂𝑦0)𝑑𝜉𝑑𝜂 ℝ2 (8)
where the integration of 𝜉 and 𝜂 is over the entire plane ℝ2 = (−∞, ∞) × (−∞, ∞), and the
function 𝒢 is expressed as:
𝒢(𝜉, 𝜂, 𝜔) = 1 𝑘𝑧𝑧𝛼(1 − 𝜆2𝛿0− 𝜆1𝛿02)⋅ 𝛿0+ 𝛿1 − 𝛼𝛿0− 𝛼2𝛿 0𝛿1 (1 + 𝛼𝛿1)(𝛿0+ 𝛿1) (9)
Eqs. (8) and (9) can be used for analyzing both the conventional frequency-sweep FDTR
measurement by setting 𝑥0 = 𝑦0 = 0 , and the beam-offset measurement with the fixed
modulation frequency 𝜔 but varying the offset coordinates (𝑥0, 𝑦0).
Eqs (8-9) automatically recover the solution by Yang et al.25 when using overlapped pump
and probe beams and when the sample is transversely isotropic. In this case, the thermal
conductivity tensor can be reduced to a diagonal tensor with diagonal elements 𝑘𝑥𝑥 = 𝑘𝑦𝑦 = 𝑘𝑟
and 𝑘𝑧𝑧. Therefore, 𝜆2 = 0 and 𝜆1 = 𝑞2 =𝑖𝜔𝐶+𝑘𝑟𝜅2
𝑘𝑧𝑧 , where 𝑞 is the thermal wavenumber in
cylindrical symmetry and 𝜅2 = 𝜉2+ 𝜂2 is identical to the Hankel transform variable. Eq. (8) can
be further simplified as:
𝐻(𝜔) = 1 2𝜋𝑘𝑧𝑧∫ 𝛿0 + 𝛿1+ 𝑞𝛿0𝛿1 𝑞(1 + 𝑞𝛿0)(1 + 𝑞𝛿1)(𝛿0+ 𝛿1)⋅ 𝑒 (−𝑤02+𝑤8 12𝜅2) 𝜅𝑑𝜅 ∞ 0 (10)
which is identical to the result obtained by Yang et al. 25 It is clear that the FDTR signal can be
determined by a single effective radius, which is written as the root-mean-squared (RMS) radius
𝑤 =𝑤02+𝑤12
2 .
hor’s peer reviewed, accepted manuscript. Howe
ver, the online
version of record will be different
from this
version
once it has bee
n copyedited an d typeset. PLEASE CIT E THIS ARTI C LE AS DOI: 10.1063/5.0003770
To conclude this section, we briefly discuss the limitation of the model above. First, an exponentially decaying heat source term is only valid when the the charge carriers recombines
fast and the diffusion lengths of these carriers are smaller than the light absorption depth 𝛿0 and
𝛿1 . One typical case when the model in this work fails is crystalline silicon with slow
nonradiative recombination. Lifetime of photo-induced charge carriers in silicon could approach
microsecond (μs) scale and the diffusion length is estimated to even approach ~102 μm.30 As a
result, the nonradiative recombination of electrons and holes generates heat in much larger region beyond the exponentially decaying light intensity profile. Indeed we found the derived model above would not be able to fit FDTR signal for crystalline silicon (See more discussion in the Appendix). Another limitation is that Eq. (7) neglected the spatial oscillating part of the
reflectance change profile due to the interference incident and reflected probe light field,31 which
is only valid when the probe light absorption depth 𝛿1 is much smaller than half of the
wavelength in the media.25 A typical example for this case is indeed GaAs with 𝛿1 comparable to
the half-wavelength inside the media.32 Fortunately, this issue in GaAs can be partially solved by
limiting the measurement at low modulation frequency < 0.5 MHz (See more discussion in the Appendix). Finally, local equilibrium is also assumed when deriving the model, namely, lattice and charge carriers being at the same temperature. This model, however, might no longer be
valid if the electron-phonon interaction is weak and nonequilibrium transport is non-negligible.33
Transducerless FDTR measurement of thermal conductivity in isotropic thin films on a
transparent substrate has already been presented in ref 25, and extending the solution to fully
anisotropic thermal conductivity tensors will be done in the future. However, when the film
thickness is much smaller than 𝛿0 such as few-layer 2D materials, relative small absorptance and
reflectance of the sample might result in a very weak thermoreflectance signal.
hor’s peer reviewed, accepted manuscript. Howe
ver, the online
version of record will be different
from this
version
once it has bee
n copyedited an d typeset. PLEASE CIT E THIS ARTI C LE AS DOI: 10.1063/5.0003770
III. Measuring In-plane Thermal Conductivity without Transducer
Figure 2. (a) Schematic of conventional frequency-sweep FDTR measurement with overlapped
pump and probe beams. (b) Frequency-sweep FDTR signal obtained on the bare MoS2 sample
with the best fit value 𝑘𝑟 = 75 W/mK, 𝑘𝑧 = 5.7 W/mK. (c) Schematic of beam-offset
measurement by varying the pump-offset distance with respect to the probe beam. (d)
Out-of-phase beam-offset thermoreflectance signal obtained on the bare MoS2 sample at the modulation
frequency f = 0.14 MHz where FWHM of the out-of-phase signal is measured to obtain the
in-plane thermal conductivity 𝑘𝑥𝑥 along the offset direction (𝑥 in the figure). Inset shows that 𝑘𝑥𝑥
is extracted as 79 W/mK from the simulated FWHM curve.
hor’s peer reviewed, accepted manuscript. Howe
ver, the online
version of record will be different
from this
version
once it has bee
n copyedited an d typeset. PLEASE CIT E THIS ARTI C LE AS DOI: 10.1063/5.0003770
In this section, we discuss the measurement methodology of in-plane thermal conductivity using FDTR without transducer films. As shown in Figure 2, two measurement techniques are considered. The first technique is the conventional frequency-sweep FDTR measurement with overlapped pump and probe beams (Figure 2a), and the thermal conductivity is extracted by
fitting the thermal phase 𝜙 as shown in Figure 2b. The other technique is the beam-offset
technique as shown in Figure 2c where the out-of-phase thermoreflectance signal Y (imaginary part of 𝐻(𝜔)) at the fixed modulation frequency is measured as a function of the beam-offset distance as shown in Figure 2d. Then, by comparing the measured and the simulated full-width at half-maximum (FWHM), in-plane thermal conductivity along the offset direction can be
extracted as shown in Figure 2d inset.20
In the following discussions, we first show that without transducer films both the frequency-sweep measurement and the beam-offset measurement are dominantly sensitive to the in-plane thermal conductivity through sensitivity analysis in part A. In part B, error propagation in both frequency-sweep and beam-offset measurement will be discussed in detail. Finally, experimental
results obtained with HOPG, MoS2 and Bi2Se3 will be presented in part C.
A. Sensitivity Analysis
In general, the sensitivity of an observable 𝑦 with respect to a certain property 𝑥 is defined
as:34
𝑆𝑥𝑦 =𝜕 ln 𝑦
𝜕 ln 𝑥 (11)
The observable 𝑦 can be either the thermal phase angle 𝜙 for the frequency-sweep measurement, or the FWHM of the out-of-phase signal in the case of the beam-offset measurement. 𝑥 here can
hor’s peer reviewed, accepted manuscript. Howe
ver, the online
version of record will be different
from this
version
once it has bee
n copyedited an d typeset. PLEASE CIT E THIS ARTI C LE AS DOI: 10.1063/5.0003770
be any properties or input parameters of interest, such as volumetric heat capacity, absorption depths, spot radius, just to name a few. Sensitivity essentially quantifies the propagation of
relative change of 𝑥 into the change of 𝑦. For example, a 𝑆𝑥𝑦 = 0.5 indicates that 10% relative
change in 𝑥 would result in about 5% change of 𝑦. These sensitivities are also related to error propagation, which will be further discussed in part B.
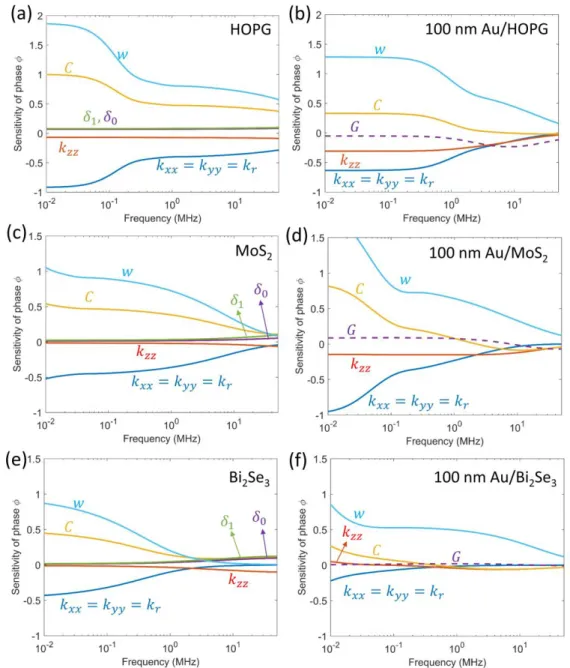
Figure 3 shows the sensitivity of the thermal phase 𝜙 to the physical properties for the three
reference layered samples, HOGP, MoS2 and Bi2Se3 with and without transducers. Nominal
parameters used to calculate the sensitivities are listed in Table I. Without the transducer, the sensitivity of thermal phase 𝜙 to in-plane thermal conductivity is systematically increased for all
three samples, especially for HOPG and Bi2Se3. It is intuitive to understand that the sensitivity to
the in-plane thermal conductivity is improved for all three samples, especially for Bi2Se3 with
low in-plane thermal conductivity 𝑘𝑟, because of the absence of heat spreading caused by the
transducer. Interestingly, the sensitivity to the absorption depths 𝛿0 and 𝛿1 are small for the three
samples compared with 𝑘𝑟, especially at low modulation frequencies. This is can be attributed to
the much larger thermal penetration dept than absorption depths. The thermal penetration depth
is defined as 𝑑𝑝𝑧 = √𝑘𝑧𝑧/𝜋𝐶𝑓 , where 𝑘𝑧𝑧 is the cross-plane thermal conductivity, 𝐶 is
volumetric heat capacity and 𝑓 is the modulation frequency. 𝑑𝑝𝑧 is on the order of a few μm
when modulation frequency is lower than 1 MHz, much larger than the light abosrption depths ~
10 nm, therefore the through plane temperature profile is determined by 𝑑𝑝𝑧 instead of 𝛿0 or 𝛿1.
We calculated the absorption depths according to the extinction coefficient of the materials (also included in Table I) at the wavelengths of the pump (400 nm) and the probe (532 nm) beams. These absorption depths are treated as fixed parameters when fitting the signal. The low
hor’s peer reviewed, accepted manuscript. Howe
ver, the online
version of record will be different
from this
version
once it has bee
n copyedited an d typeset. PLEASE CIT E THIS ARTI C LE AS DOI: 10.1063/5.0003770
sensitivity to 𝛿0 and 𝛿1 is also preferable, because this also means that uncertainty in these two
parameters can hardly propagate to 𝑘𝑟.
Figure 3. Calculated sensitivity of thermal phase 𝜙 to thermal properties of (a) bare HOPG
sample, (b) 100 nm Au coated HOPG, (c) bare MoS2 and (d) 100 nm Au coated MoS2, (e) bare
Bi2Se3 and (f) 100 nm Au coated Bi2Se3. Interface conductance is assumed as 40 MW/m2K for
all samples, spot radius used for sensitivity analysis is 𝑤 = 2.8 μm.
hor’s peer reviewed, accepted manuscript. Howe
ver, the online
version of record will be different
from this
version
once it has bee
n copyedited an d typeset. PLEASE CIT E THIS ARTI C LE AS DOI: 10.1063/5.0003770
Figure 4. Contour of sensitivity to (a) in-plane thermal conductivity 𝑘𝑟 and (b) cross-plane
thermal conductivity 𝑘𝑧 of Bi2Se3.
hor’s peer reviewed, accepted manuscript. Howe
ver, the online
version of record will be different
from this
version
once it has bee
n copyedited an d typeset. PLEASE CIT E THIS ARTI C LE AS DOI: 10.1063/5.0003770
Selecting appropriate spot radius and modulation frequency is especially important for measuring low in-plane thermal conductivity. In order to provide guidance to selecting spot
radius, Figure 4a shows the countour of sensitivity to in-plane thermal conductivity for Bi2Se3.
When fixing a spot radius, high sensitivity to 𝑘𝑟 is mostly in the low frequency range. To ensure
a high sensitivity (>0.3) to in-plane thermal conductivity, the spot size is preferably below 10 μm,
and the lower bound of frequency-sweep should be below 0.2 MHz. Since 𝑘𝑧 is an extra
unknown parameter, it would become difficult to determine 𝑘𝑟 if the sensitivity to 𝑘𝑧 is high.
Figure 4b shows the sensitivity map to cross-plane thermal conductivity 𝑘𝑧. As long as the
modulation frequency is below 40 MHz (corresponding to penetration depth 𝑑𝑝𝑧 ≥ 63 nm), the
sensitivity to 𝑘𝑧 can be suppressed below 0.1. Unlike conventional FDTR with transducers, it is
hard to improve the sensitivity to cross-plane thermal conductivity in the experimental frequency range (< 50 MHz for our implementation) of transducerless FDTR measurements.
While the above analysis showed that conducting frequency-sweep measurement without any
transducers is highly promising to obtain 𝑘𝑟 for materials with isotropic in-plane thermal
conductivity, it is still desirable to examine the sensitivity of beam-offset measurement especially for materials without in-plane symmetry, which solely measures the thermal conductivity along the offset direction. Figure 5 summarizes the sensitivity of FWHM of the out-of-phase signal for bare samples without transducers and samples coated with 100-nm Au
transducer films. It is clear that the sensitivity of the in-plane thermal conductivity 𝑘𝑥𝑥 along the
offset direction 𝑥 and the heat capacity 𝐶 are almost mirror image of each other, indicating that
the beam-offset measurement essentially measures the in-plane diffusivity 𝑘𝑥𝑥/𝐶, 20, therefore, 𝐶
cannot be independently determined by beam-offset measurement. Other than 𝑘𝑥𝑥 and C the
RMS spot radius 𝑤 is also one of the most sensitive properties, which is indeed the major source
hor’s peer reviewed, accepted manuscript. Howe
ver, the online
version of record will be different
from this
version
once it has bee
n copyedited an d typeset. PLEASE CIT E THIS ARTI C LE AS DOI: 10.1063/5.0003770
of uncertainty in beam-offset measurements.20 In this work, we directly determine the spot radius
𝑤 by fitting in-phase thermoreflectance signal of the beam-offset measurement on MoS2 and
Bi2Se3 where the in-phase signal at a high modulation frequency of 40 MHz is fitted with a
Gaussian beam profile exp (−𝑥02/𝑤2), where 𝑤 is the RMS spot radius.20 Another major
advantage of the beam-offset measurement is the negligible sensitivity to the cross-plane thermal
conductivity 𝑘𝑧𝑧, and the absorption depths 𝛿0 and 𝛿1. Therefore once the heat capacity is known,
the beam-offset measurement without transducer film can solely determine in-plane thermal conductivity.
Figure 5b, d and f shows the comparison for the beam-offset measurement on samples coated
with 100-nm Au films. Although sensitivity to 𝑘𝑥𝑥 is only moderately improved for HOPG and
MoS2 with relatively high in-plane thermal conductivity, the beam-offset measurement on bare
samples without transducers is much simpler. Transducerless measurements do not involve the
transducer thickness 𝑑𝐴𝑢 and the interface conductance 𝐺 , which needs to be independently
measured and adds complexity to the model. Removal of the transducer is particularly beneficial
for measuring low in-plane thermal conductivity materials such as Bi2Se3 as shown in Figure 5e.
For both conventional and transducerless beam-offset measurements, the thermoreflectance
signal is dominantly sensitive to 𝑘𝑥𝑥 if the modulation frequency is below 0.05 MHz. However,
the sensitivity to 𝑘𝑥𝑥 would be overwhelmed by additional properties such as transducer
thickness for the conventional beam-offset measurement, even if the modulation frequency is as low as 0.01 MHz.
For transducerless beam-offset measurements, there is a trade-off between the amplitude of the out-of-phase signal and the sensitivity to in-plane thermal conductivity. While Figure 5a, c
hor’s peer reviewed, accepted manuscript. Howe
ver, the online
version of record will be different
from this
version
once it has bee
n copyedited an d typeset. PLEASE CIT E THIS ARTI C LE AS DOI: 10.1063/5.0003770
always beneficial to perform beam-offset measurement at the lowest possible frequency. However, the amplitude of out-of-phase signal also decreases with lower modulation frequency.
For HOPG and MoS2 with higher in-plane thermal conductivity, the out-of-phase signal would
be at least one-order-magnitude smaller than the in-phase signal at low modulation frequency ~ 0.01 MHz. As a result, the measured FWHM would be easily affected by 1/𝑓 noise or slight
shift of the pump-phase. Therefore, the in-plane thermal conductivity of MoS2 and HOPG is
measured at 0.14 MHz to ensure the accurate detection of the out-of-phase signal. For Bi2Se3
with much low in-plane thermal conductivity, however, we choose the lowest modulation
frequency for beam-offset measurement to ensure the high sensitivity to 𝑘𝑥𝑥. The sample
measurement discussion will be continued in part C.
hor’s peer reviewed, accepted manuscript. Howe
ver, the online
version of record will be different
from this
version
once it has bee
n copyedited an d typeset. PLEASE CIT E THIS ARTI C LE AS DOI: 10.1063/5.0003770
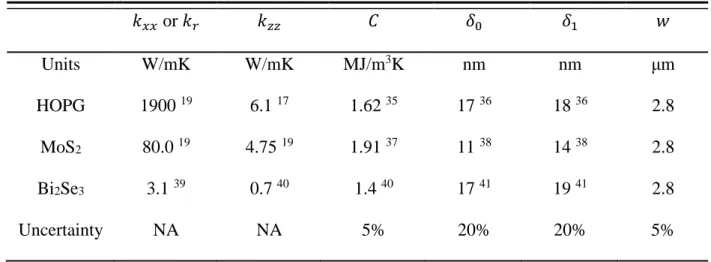
Table I. Input parameters and uncertainties (𝜎) for the sensitivity analysis. Uncertainties of 𝑘𝑥𝑥
or 𝑘𝑟 and 𝑘𝑧𝑧 are to be determined by error propagation, which will be discussed later. The
absorption depths are estimated as 𝛿 = 𝜆
4𝜋𝜅 where 𝜅 is the extinction coefficient and 𝜆 is the
wavelength. References for extinction coefficients are provided in the references.
𝑘𝑥𝑥 or 𝑘𝑟 𝑘𝑧𝑧 𝐶 𝛿0 𝛿1 𝑤 Units W/mK W/mK MJ/m3K nm nm μm HOPG 1900 19 6.1 17 1.62 35 17 36 18 36 2.8 MoS2 80.0 19 4.75 19 1.91 37 11 38 14 38 2.8 Bi2Se3 3.1 39 0.7 40 1.4 40 17 41 19 41 2.8 Uncertainty NA NA 5% 20% 20% 5%
hor’s peer reviewed, accepted manuscript. Howe
ver, the online
version of record will be different
from this
version
once it has bee
n copyedited an d typeset. PLEASE CIT E THIS ARTI C LE AS DOI: 10.1063/5.0003770
Figure 5. Calculated sensitivity of FWHM of the out-of-phase signal to thermal properties of (a)
bare HOPG sample, (b) 100 nm Au coated HOPG, (c) bare MoS2 and (d) 100 nm Au coated
MoS2, (e) bare Bi2Se3 and (f) 100 nm Au coated Bi2Se3. Interface conductance is assumed as 40
MW/m2K for all samples, spot radius used for sensitivity analysis is 𝑤 = 2.8 μm.
hor’s peer reviewed, accepted manuscript. Howe
ver, the online
version of record will be different
from this
version
once it has bee
n copyedited an d typeset. PLEASE CIT E THIS ARTI C LE AS DOI: 10.1063/5.0003770
B. Uncertainty Analysis
After the sensitivities are calculated, we now discuss the propagation of uncertainties. For the frequency-sweep measurement, a multivariate error propagation formula is derived by Yang et
al.42 based on Jacobi matrices:
𝑣𝑎𝑟[𝑋𝑈] = (𝐽𝑈𝑇𝐽𝑈)−1𝐽𝑈𝑇(𝑣𝑎𝑟[𝜙] + 𝐽𝐶𝑣𝑎𝑟[𝑋𝑐]𝐽𝐶𝑇)𝐽𝑈(𝐽𝑈𝑇𝐽𝑈)−1 (12)
where 𝑣𝑎𝑟[𝑋𝑈] denotes the covariance matrix of the unknown fitting variables such as 𝑘𝑟 and
𝑘𝑧𝑧, 𝑣𝑎𝑟[𝑋𝐶] is the covariance of the input variables such as the spot radius, absorption depths
and so on. 𝑣𝑎𝑟[𝜙] is the noise level of phase in the measurement which contributes negligibly to
the uncertainty. 𝐽𝐶 and 𝐽𝑈 are Jacobi matrices of the signal 𝜙 with respect to 𝑋𝐶 or 𝑋𝑈, calculated
as: 𝐽𝐶 = [ 𝜕𝜙1 𝜕𝑥𝑐1 𝜕𝜙1 𝜕𝑥𝑐2 𝜕𝜙2 𝜕𝑥𝑐1 𝜕𝜙2 𝜕𝑥𝑐2 … 𝜕𝜙1 𝜕𝑥𝑐𝑝 … 𝜕𝜙2 𝜕𝑥𝑐𝑝 ⋮ ⋮ 𝜕𝜙𝑁 𝜕𝑥𝑐1 𝜕𝜙𝑁 𝜕𝑥𝑐2 ⋱ ⋮ … 𝜕𝜙𝑁 𝜕𝑥𝑐𝑝] , 𝐽𝑈 = [ 𝜕𝜙1 𝜕𝑥𝑢1 𝜕𝜙1 𝜕𝑥𝑢2 𝜕𝜙2 𝜕𝑥𝑢1 𝜕𝜙2 𝜕𝑥𝑢2 … 𝜕𝜙1 𝜕𝑥𝑢𝑞 … 𝜕𝜙2 𝜕𝑥𝑢𝑞 ⋮ ⋮ 𝜕𝜙𝑁 𝜕𝑥𝑢1 𝜕𝜙𝑁 𝜕𝑥𝑢2 ⋱ ⋮ … 𝜕𝜙𝑁 𝜕𝑥𝑢𝑞] (13)
where 𝜙𝑖 = 𝜙(𝜔𝑖) is the phase measured at 𝑖-th modulation frequency out of 𝑁 frequencies in
total, 𝑥𝑐𝑗 and 𝑥𝑢𝑗 are the 𝑗-th parameter of the control variable vector 𝑋𝐶 and fitting variable
vector 𝑋𝑈. 𝑝 and 𝑞 are the total numbers of control variables and fitting variables. Finally, we
visualize the confidence interval using:43
(𝑋𝑈− 𝑋𝑈∗)𝑇(𝑣𝑎𝑟[𝑋
𝑈])(𝑋𝑈− 𝑋𝑈∗) = 𝜒𝐷2(𝑝 = 0.68) (14)
hor’s peer reviewed, accepted manuscript. Howe
ver, the online
version of record will be different
from this
version
once it has bee
n copyedited an d typeset. PLEASE CIT E THIS ARTI C LE AS DOI: 10.1063/5.0003770
where 𝜒𝐷(𝑝) is the quantile function, and 𝐷 is the number of fitting variables, 𝑝 is the confidence level taken as 0.68 in this work (i.e. each error bar is taken as one 𝜎). For the
frequency sweep measurement, 𝑋𝑈 = [𝑘𝑟, 𝑘𝑧𝑧] and 𝐷 = 2, therefore typical confidence interval
has an elliptical shape as shown in Figure 6a. Although uncertainty in 𝑘𝑧𝑧 is relatively large
~37%, 𝑘𝑧𝑧 is weakly correlated with the in-plane thermal conductivity 𝑘𝑟, where 𝑘𝑟 can be
determined with uncertainty as low as 5% even 𝑘𝑧𝑧 remains unknown.
Uncertainty propagation in the beam-offset measurement is shown in Figure 6b, using MoS2
as an example. Since the in-plane thermal conductivity 𝑘𝑥𝑥 along the beam-offset direction is
determined by comparing the measured FWHM and the simulated function FWHM= 𝑓(𝑘𝑥𝑥, 𝑋𝐶),
there are indeed two sources of uncertainty. The first source of uncertainty in 𝑘𝑥𝑥 is contributed
from the experimental uncertainty while the other source is the uncertainty in the model
𝑓(𝑘𝑥𝑥, 𝑋𝐶) derived from the control parameters 𝑋𝐶. The experimental uncertainty of the
measured FWHM (~0.2 μm) can be easily derived from repeated measurements as shown in
Figure 6b, which results in ~2.4 % of uncertainty in 𝑘𝑥𝑥. On the other hand, the relative
uncertainty in the simulated FWHM is calculated as:21
𝜂𝐹𝑊𝐻𝑀𝑆 = √ ∑ (𝑆𝑥𝐹𝑊𝐻𝑀𝑐 𝜂
𝑥𝑐)
2 𝑥𝑐∈𝑋𝑐
(15)
where 𝜂𝑥 denotes the relative uncertainty of variable 𝑥. The uncertainty of simulated FWHM
with the input control parameters with given uncertainties (Table 1) resulted in 5% uncertainty of
𝑘𝑥𝑥, which is also plotted in Figure 6b. Finally, the overall uncertainty in 𝑘𝑥𝑥 is can be estimated
using the root sum squares method as √2.4%2+ 5%2 = 5.5%.
hor’s peer reviewed, accepted manuscript. Howe
ver, the online
version of record will be different
from this
version
once it has bee
n copyedited an d typeset. PLEASE CIT E THIS ARTI C LE AS DOI: 10.1063/5.0003770
Figure 6. (a) Confidence interval for the frequency-sweep measurement on bare MoS2. (b)
Uncertainty propagation to the in-plane thermal conductivity of MoS2 along the offset direction
(𝑘𝑥𝑥). Gray dashed lineindicates the experimental uncertainty contribution from the FWHM
measured at f = 0.14 MHz, and the blue dashed line indicates the uncertainty contribution from
the simulated FWHM as a function of 𝑘𝑥𝑥 with the uncertainty in control variables as shown in
Table 1, including the spot radius and heat capacity.
C. Measurement Results
As a demonstration of measuring in-plane thermal conductivity without a transducer film, we conducted both frequency-sweep and beam-offset FDTR measurements on three layered
anisotropic crsytals (HOPG, MoS2 and Bi2Se3), with in-plane thermal conductivity spans over
three orders of magnitude. Our experimental system is similar to ref.44, but employs a
continuous-wave (cw) 400-nm pump laser and a 532-nm probe laser. Before conducting the measurements, we exfoliate the surface layers away using scotch tapes to expose the fresh
hor’s peer reviewed, accepted manuscript. Howe
ver, the online
version of record will be different
from this
version
once it has bee
n copyedited an d typeset. PLEASE CIT E THIS ARTI C LE AS DOI: 10.1063/5.0003770
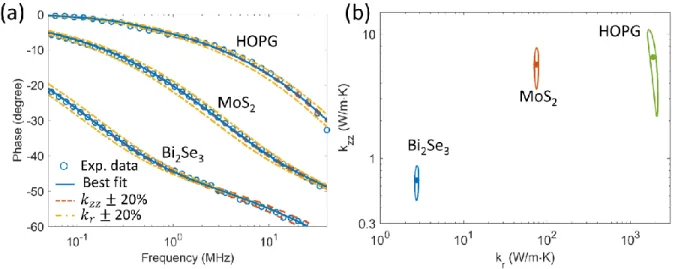
surfaces of the substrate. All samples measured in this work are in bulk form, purchased from 2D Semiconductors. Figure 7 summarizes the frequency-sweep thermoreflectance signal and the measured in-plane and cross-plane thermal conductivity with 68% confidence interval through
the multi-parameter fitting. As shown in Figure 7a, except for Bi2Se3 above 2 MHz, the
frequency-sweep signal is dominantly sensitive to the in-plane thermal conductivity 𝑘𝑟 and is
barely affected by the cross-plane thermal conductivity 𝑘𝑧𝑧. As a result, uncertainty in 𝑘𝑧𝑧 is
very large for all three samples, and increases as the in-plane thermal conductivity increases (30%
for Bi2Se3, 37 % for MoS2 and 64% for HOPG). Nonetheless, such large uncertainty in 𝑘𝑧𝑧
would not compromise the measurement accuracy of in-plane thermal conductivities, as shown in Figure 7b. The relative uncertainties of the in-plane thermal conductivity are smaller than 15% for all three samples.
Figure 7. (a) Frequency-sweep FDTR signal and (b) measured anisotropic thermal conductivity
with 68% confidence interval (solid curves) of the best fit (𝑘𝑟, 𝑘𝑧𝑧)(center dots) for Bi2Se3, MoS2
and HOPG without transducers.
hor’s peer reviewed, accepted manuscript. Howe
ver, the online
version of record will be different
from this
version
once it has bee
n copyedited an d typeset. PLEASE CIT E THIS ARTI C LE AS DOI: 10.1063/5.0003770
Figure 8. (a) Comparison of measured in-plane thermal conductivity obtained from beam-offset
measurements (𝑘𝑥𝑥) and frequency sweep measurements (𝑘𝑟) without the transducer. (b)
In-plane thermal conductivity comparison between the transducerless beam-offset measurements
and literature values. (refs HOPG, 19 MoS2, 19 Bi2Se339)
Figure 8 summarizes the comparison between the in-plane thermal conductivity obtained by the beam-offset measurement and the frequency-sweep measurement (Figure 8a), and the literature values (Figure 8b),. The excellent agreementhas validated our measurement approach. All best-fit values and uncertainties are also tabulated in Table II. Although only three reference samples are measured in this work, we further vision that this method could be applied to other non-transparent materials as well. Figure 9a summarizes the predicted measurement error over a wide range of in-plane diffusivity, for both frequency-sweep and beam-offset measurements with or without transducers. In general, removal of the transducer always helps to improve the measurement accuracy except for the frequency-sweep on bare samples with in-plane thermal
diffusivity (𝑘𝑥𝑥/𝐶) higher than 1400 mm2/s. This is probably due to the fact of the overlapping
hor’s peer reviewed, accepted manuscript. Howe
ver, the online
version of record will be different
from this
version
once it has bee
n copyedited an d typeset. PLEASE CIT E THIS ARTI C LE AS DOI: 10.1063/5.0003770
laser beam only samples the temperature profile within the spot radius, while the in-plane thermal penetration length could be a few orders of magnitude larger than the spot size. When
in-plane thermal diffusivity is larger than ~15 mm2/s, it is advantageous to perform the beam-offset
FDTR without the transducer. While for materials with low in-plane thermal diffusivity < 15
mm2/s, the frequency-sweep method could achieve high precision with relative uncertainty lower
than 10%, as shown in Figure 9b. We also identified the optimal range for the conventional FDTR with transducers. For the beam-offset measurement with a 100-nm Au transducer film, the
lower limit of in-plane thermal diffusivity is around 5 mm2/s to achieve less than 15%
uncertainty in 𝑘𝑥𝑥 while the optimal range of in-plane diffusivity is limited between 1.6 mm2/s
and 160 mm2/s for the frequency-sweep measurement with a 100-nm Au transducer film. Finally,
steady state tempreature rise would still be an important concern when performing transducerless measurements. Due to the small thermoreflectance of the uncoated samples compared with metal transducers, large pump power might be required. For example, we found that the singal amplitude obtained on transducerless HOPG with 30 mW pump, 5 mW probe is only 1/30 of the signal of HOGP coated with 100 nm Au transducer using 5 mW pump, 1 mW probe. Steady state temperature rise might also be important for highly absorptive samples with low thermal
conductivity. For example, the steady state temperature rise of Bi2Se3 is still estimated12 to be
relatively large ~ 20 K even when the laser power is suppressed to 0.2 mW with a RMS spot radius of 2.8 μm, which is close to the minimum operating power of the laser implemented in this work. In this work, we estimate the maximum temperature rise for all measurements using
Δ𝑇 = 𝑃/(2𝑤√𝜋𝑘𝑟𝑘𝑧),12 where P is the total laser power, w= 2.8 μm is the laser spot radius, k_r
and k_z are in-plane and through plane thermal conductivity respectively. Laser power is selected to ensure steady state temperature rise below 30 K. Another possible soluiton to
hor’s peer reviewed, accepted manuscript. Howe
ver, the online
version of record will be different
from this
version
once it has bee
n copyedited an d typeset. PLEASE CIT E THIS ARTI C LE AS DOI: 10.1063/5.0003770
suppress steady-state tempreature rise is to employ less focused laser spots, since steady state
temperature rise scales 𝑤−1 with the RMS spot radius according to the semi-infinite body
solution of heat conduction.12
Figure 9. (a) Estimated uncertainty of in-plane thermal conductivity for a wide range of in-plane
thermal diffusivities, estimated using a spot radius 𝑤 = 3 μm. (b) Optimal measurement
technique for the measurement of in-plane thermal conductivity without transducers (blue arrows) and the optimal range (<15 % uncertainty) with 100 nm Au transducer (red arrows). Thermal conductivity of Au transducer is assumed to be 180 W/mK.
hor’s peer reviewed, accepted manuscript. Howe
ver, the online
version of record will be different
from this
version
once it has bee
n copyedited an d typeset. PLEASE CIT E THIS ARTI C LE AS DOI: 10.1063/5.0003770
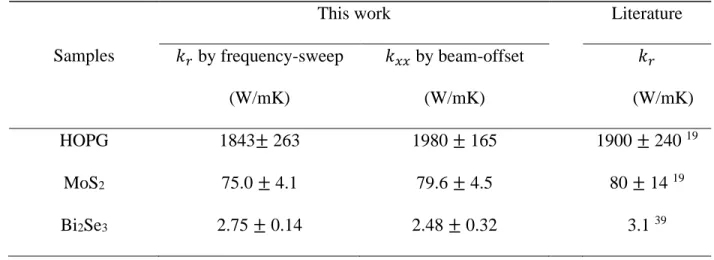
Table II. In-plane thermal conductivity 𝑘𝑟 measured by the frequency-sweep FDTR, in-plane
thermal conductivity 𝑘𝑥𝑥 measured by the beam-offset FDTR, and literature values of in-plane
thermal conductivity 𝑘𝑟.
Samples
This work Literature
𝑘𝑟 by frequency-sweep (W/mK) 𝑘𝑥𝑥 by beam-offset (W/mK) 𝑘𝑟 (W/mK) HOPG 1843± 263 1980 ± 165 1900 ± 240 19 MoS2 75.0 ± 4.1 79.6 ± 4.5 80 ± 14 19 Bi2Se3 2.75 ± 0.14 2.48 ± 0.32 3.1 39
Finally, it is helpful to summarize the key points to notice to ensure the validity of transducerless FDTR measurements. The most obvious requirement is that the sample should be absorptive. Before doing the transducerless FDTR measurement, it is always helpful to estimate
the light absorption depths 𝛿0 and 𝛿1 from the dielectric function or the complex refreactive
index. One possible scenario the transducerless FDTR might fail, is when measuring materials with the indirect bandgap and long diffusion lengths of photo-excited carriers (much longer than
𝛿0) like Si, making the heating region deviating from the exponential profile assumed.29
Transucerless FDTR is likely to be valid for direct bandgap semiconductors or metals with fast recombination of photo-excited carriers. The other requirement for transducerless measurement to be valid is the absorption depth of the probe being much smaller than half wavelength in the
material 𝛿1 ≪ 𝜆1
2𝑛. However, as already discussed in the appendix, this issue can be mitigated by
limiting the measurement below a certain modulation frequency 𝑓𝑐𝑢𝑡 or performing beam-offset
hor’s peer reviewed, accepted manuscript. Howe
ver, the online
version of record will be different
from this
version
once it has bee
n copyedited an d typeset. PLEASE CIT E THIS ARTI C LE AS DOI: 10.1063/5.0003770
measurement at a fixed frequency below 𝑓𝑐𝑢𝑡. The cut-off frequency 𝑓𝑐𝑢𝑡 is determined by the
condition 𝑑𝑝𝑧 = √𝑘𝑧/𝜋𝐶𝑓𝑐𝑢𝑡 ≫ max (𝛿1,
𝜆1
2𝑛). For a new anisotropic sample with unknown 𝑘𝑟
and 𝑘𝑧, it is recommended to perform frequency-sweep and beam-offset measurement for
cross-checking. If the in-plane heat diffusivity is higher than 15 mm2/s, transducercless beam-offset
measurement alone is able to obtain the plane themal conductivity. For materials with low
in-plane thermal diffusivity, only frequency-sweep measurement ensures high sensitivity to 𝑘𝑟.
Fortunately, the measurement would still be insensitive to 𝑘𝑧 though limiting the highest
modulation frequency.
IV. Conclusions
In summary, we proposed a transducerless FDTR method to directly measure in-plane thermal conductivity of nontransparent layered materials. An analytical model including full thermal conductivity tensors and appropriate treatment of light absorption of pump and probe beams is derived. This method not only greatly simplifies the sample preparation in FDTR measurement, but also shows that the sensitivity to in-plane thermal conductivity is greatly improved compared with the conventional FDTR measurement with a transducer film. Through comprehensive sensitivity and error analysis, we show that the in-plane thermal conductivity can be independently determined either by the frequency-sweep FDTR or beam-offset measurement,
even when 𝑘𝑧𝑧 is unknown. This method is experimentally validated using three layered
materials with in-plane thermal conductivity which spans over three orders of magnitude: HOPG
(~ 1800 W/mK), MoS2 (~ 80 W/mK) and Bi2Se3 (~ 3 W/mK). This work can be easily extended
to materials with three-dimensional anisotropy by performing beam-offset measurement along
hor’s peer reviewed, accepted manuscript. Howe
ver, the online
version of record will be different
from this
version
once it has bee
n copyedited an d typeset. PLEASE CIT E THIS ARTI C LE AS DOI: 10.1063/5.0003770
the different directions, since the thermal model we derived in this work does not assume any crystal symmetry.
Appendix: Limitations of the Thermal Model with Light Absorption
This appendix discusses in more detail the cases when the thermal model with light absorption fails. The first case we consider is silicon with dominant nonradiative recombination and very long lifetime of photo-excited charge carriers on the order of microseconds. Figure 10a indicates that the model shows large discrepancy with the frequency-sweep measurements in the entire modulation frequency range (0.01 MHz to 50 MHz). As we briefly discussed in the maintext, the exponential decaying heating source term in the thermal model is only valid when the diffusion
length of charge carriers are smaller than 𝛿0 and 𝛿1. In silicon, the diffusion length of charge
carriers can approach ~ 160 μm,30 much larger than 𝛿
0 (~82 nm) and 𝛿1 (~0.85 μm) estimated at
400 nm and 532 nm wavelengths of the pump and probe lasers.45 Nonradiative recombination of
electron and holes would deposit heat inside the sample in a much wider region compared with the asummed exponentially decaying heating source. Figure 10b also shows that beam-offset measurement also fails to accurately measure thermal conductivity. Thermal conductivity of silicon is overesimtaed to be 170 ± 17 W/mK, probably related to the in-plane diffusion of charge carriers that resulted in a lager FWHM of the out-of-phase signal.
The second case we consider is GaAs with dominantly radiative carrier recombination due to its direct bandgap. Although the radiatively recombined light can be reabsorption and re-recombined, the heating created by this part of the energy should be more or less uniformly distributed in the entire sample which does not affect temperature distribution. The
above-hor’s peer reviewed, accepted manuscript. Howe
ver, the online
version of record will be different
from this
version
once it has bee
n copyedited an d typeset. PLEASE CIT E THIS ARTI C LE AS DOI: 10.1063/5.0003770
bandgap heating source profile can still be approximated by 𝑒−𝑧/𝛿0. However, we still found that the thermal model failed to fit the frequency-sweep signal in the high frequency range (> 1.0 MHz) as shown in Figure 10c. Such discrepancy can be attributed to the relative long absorption
depth of the probe beam 𝛿1 (estimated to be ~ 111 nm) 32, which is comparable with the
half-wavelength 𝜆1/2𝑛 = 136 nm inside the media, where 𝜆1 is the probe wavelength (532 nm) and 𝑛
is real part of the refractive index.32 In this case, the phase delay of the internally reflected beam
is nonnegligible, and Eq. (7) no longer holds.25, 29 However, this problem can be partially
resolved by fitting the data only at low modulation frequency. In the low frequency range,
thermal penetration depth 𝑑𝑝𝑧 ranging from 4 μm at 1.0 MHz to 28 μm at 0.01 MHz is much
larger than both 𝛿1 and 𝜆1/2𝑛. This scenario can be approximated as surface probing and the
thermal model would become less sensive to the extact profile of the probe intensity. Indeed fitting the frequency-sweep signal below 0.5 MHz shown in Figure 10c can still achieve reasonable fitting and we extract the thermal conductivity of GaAs to be 48.0 ± 8.5 W/mK. In Figure 10d, the thermal conductivity of GaAs is also measured to be 43.2 ± 2.4 W/mK with beam-offset measurement at 0.14 MHz and in good agreement with the frequency-sweep
measurement and the literature value (52 W/mK).46
hor’s peer reviewed, accepted manuscript. Howe
ver, the online
version of record will be different
from this
version
once it has bee
n copyedited an d typeset. PLEASE CIT E THIS ARTI C LE AS DOI: 10.1063/5.0003770
Figure 10. (a) Frequency-sweep measurement of bare Si without transducer. (b) Beam-offset measurement result of bare Si without transducer. Gray dashed lineindicates the experimental uncertainty contribution from the FWHM measured at f = 0.14 MHz, and the blue dashed line
indicates the uncertainty contribution from the simulated FWHM as a function of 𝑘𝑥𝑥. Both
contributed ~ 7% of the error in final thermal conductivity result. The final beam-offset result is 170 ± 17 W/mK, which overestimated the thermal conductivity of silicon. (c) Frequency-sweep measurement of bare GaAs without transducer. (d) Beam-offset measurement result of bare GaAs without transducer. Final result obtained is 43.2 ± 2.4 W/mK.
hor’s peer reviewed, accepted manuscript. Howe
ver, the online
version of record will be different
from this
version
once it has bee
n copyedited an d typeset. PLEASE CIT E THIS ARTI C LE AS DOI: 10.1063/5.0003770
Acknowledgement: The authors acknowledge funding support by Grant No.
W911NF-19-1-0279 and NSF CBET-1851052. X. Q. acknowledges helpful discussions with Yoichiro Tsurimaki and Xinpeng Zhao. The authors declare no conflict of interest.
References:
1. L. D. Zhao, S. H. Lo, Y. Zhang, H. Sun, G. Tan, C. Uher, C. Wolverton, V. P. Dravid and M. G. Kanatzidis, Nature 508 (7496), 373-377 (2014).
2. O. Hellman and D. A. Broido, Phys. Rev. B 90 (13) (2014).
3. M. Higashiwaki, K. Sasaki, T. Kamimura, M. Hoi Wong, D. Krishnamurthy, A. Kuramata, T. Masui and S. Yamakoshi, Appl. Phys. Lett. 103 (12), 123511 (2013).
4. W. S. Hwang, A. Verma, H. Peelaers, V. Protasenko, S. Rouvimov, H. Xing, A. Seabaugh, W. Haensch, C. V. de Walle, Z. Galazka, M. Albrecht, R. Fornari and D. Jena, Appl. Phys. Lett. 104 (20), 203111 (2014).
5. X. Qian, P. Jiang and R. Yang, Materials Today Physics 3, 70-75 (2017). 6. J. O. Besenhard, Carbon 14 (2), 111-115 (1976).
7. J. O. Besenhard and H. P. Fritz, Electroanalytical Chemistry and Interfacial Electrochemistry 53, 329-333 (1974).
8. K. Chang and W. Chen, ACS Nano 5 (6), 4720-4728 (2011).
9. L. David, R. Bhandavat and G. Singh, ACS Nano 8 (2), 1759-1770 (2014).
10. Z. X. Shu, R. S. McMillan and J. J. Murray, J. Electrochem. Soc. 140 (4), 992 (1993). 11. X. Qian, X. Gu, M. S. Dresselhaus and R. Yang, J Phys Chem Lett 7 (22), 4744-4750 (2016). 12. D. G. Cahill, Rev. Sci. Instrum. 75 (12), 5119-5122 (2004).
13. A. J. Schmidt, Annual Review of Heat Transfer 16 (1), 159 (2013).
14. A. J. Schmidt, R. Cheaito and M. Chiesa, Rev. Sci. Instrum. 80 (9), 094901 (2009). 15. K. T. Regner, S. Majumdar and J. A. Malen, Rev. Sci. Instrum. 84 (6), 064901 (2013).
16. J. Zhu, D. Tang, W. Wang, J. Liu, K. W. Holub and R. Yang, J. Appl. Phys. 108 (9), 094315 (2010). 17. A. J. Schmidt, X. Chen and G. Chen, Rev. Sci. Instrum. 79 (11), 114902 (2008).
18. P. Jiang, X. Qian, X. Gu and R. Yang, Adv. Mater. 29, 1701068 (2017). 19. P. Jiang, X. Qian and R. Yang, Rev. Sci. Instrum. 88 (7), 074901 (2017). 20. J. P. Feser, J. Liu and D. G. Cahill, Rev. Sci. Instrum. 85 (10), 104903 (2014). 21. P. Jiang, X. Qian and R. Yang, Rev. Sci. Instrum. 89 (9), 094902 (2018). 22. M. Li, J. S. Kang and Y. Hu, Rev. Sci. Instrum. 89 (8), 084901 (2018). 23. P. Jiang, X. Qian and R. Yang, J. Appl. Phys. 124 (16), 161103 (2018). 24. J. Liu, G.-M. Choi and D. G. Cahill, J. Appl. Phys. 116 (23), 233107 (2014). 25. J. Yang, E. Ziade and A. J. Schmidt, J. Appl. Phys. 119, 095107 (2016).
hor’s peer reviewed, accepted manuscript. Howe
ver, the online
version of record will be different
from this
version
once it has bee
n copyedited an d typeset. PLEASE CIT E THIS ARTI C LE AS DOI: 10.1063/5.0003770
26. L. Wang, R. Cheaito, J. L. Braun, A. Giri and P. E. Hopkins, Rev. Sci. Instrum. 87 (9), 094902 (2016). 27. J. M. Powers, J. Heat Transfer 126, 670-675 (2004).
28. G. Chen, Nanoscale energy transport and conversion. (Oxford University Press, ISBN: 9780195159424, 2005).
29. G. Chen, Annual Review of Heat Transfer 7, 1-57 (1996).
30. J. Batista, A. Mandelis and D. Shaughnessy, Appl. Phys. Lett. 82 (23), 4077-4079 (2003).
31. C. Thomsen, H. T. Grahn, H. J. Maris and J. Tauc, Phys Rev B Condens Matter 34 (6), 4129-4138 (1986).
32. A. D. Rakić and M. L. Majewski, J. Appl. Phys. 80 (10), 5909-5914 (1996).
33. R. B. Wilson, J. P. Feser, G. T. Hohensee and D. G. Cahill, Phys. Rev. B 88 (14), 144305 (2013). 34. D. M. Hamby, Environ. Monit. Assess. 32, 135-154 (1994).
35. W. DeSorbo and W. W. Tyler, J. Chem. Phys. 21, 1660 (1953). 36. G. E. Jellison, J. D. Hunn and H. N. Lee, Phys. Rev. B 76 (8) (2007).
37. L. S. Volovik, V. V. Fesenko, A. S. Bolgar, S. V. Drozdova, L. A. Klochkov and V. F. Primachenko, Soviet Powder Metallurgy and Metal Ceramics 17, 697-702 (1978).
38. M. S. Ullah, A. H. B. Yousuf, A. D. EsSakhi and M. H. Chowdhury, AIP Conf. Proc., 020001 (218). 39. J. Navrátil, J. Horák, T. Plecháček, S. Kamba, P. Lošt’ák, J. S. Dyck, W. Chen and C. Uher, J. Solid State Chem. 177 (4-5), 1704-1712 (2004).
40. D. Fournier, M. Marangolo, M. Eddrief, N. N. Kolesnikov and C. Fretigny, J. Phys.: Condens. Matter 30 (11), 115701 (2018).
41. J. Humlíček, D. Hemzal, A. Dubroka, O. Caha, H. Steiner, G. Bauer and G. Springholz, Phys. Scr. T162, 014007 (2014).
42. J. Yang, E. Ziade and A. J. Schmidt, Rev. Sci. Instrum. 87 (1), 014901 (2016).
43. X. Qian, P. Jiang, P. Yu, X. Gu, Z. Liu and R. Yang, Appl. Phys. Lett. 112 (24), 241901 (2018). 44. J. Yang, C. Maragliano and A. J. Schmidt, Rev. Sci. Instrum. 84 (10), 104904 (2013).
45. D. E. Aspnes and A. A. Studna, Phys. Rev. B 27 (2), 985-1009 (1983). 46. Y. K. Koh and D. G. Cahill, Phys. Rev. B 76 (7), 075207 (2007).
hor’s peer reviewed, accepted manuscript. Howe
ver, the online
version of record will be different
from this
version
once it has bee
n copyedited an d typeset. PLEASE CIT E THIS ARTI C LE AS DOI: 10.1063/5.0003770