HAL Id: tel-01273295
https://tel.archives-ouvertes.fr/tel-01273295
Submitted on 12 Feb 2016
HAL is a multi-disciplinary open access
archive for the deposit and dissemination of
sci-entific research documents, whether they are
pub-lished or not. The documents may come from
L’archive ouverte pluridisciplinaire HAL, est
destinée au dépôt et à la diffusion de documents
scientifiques de niveau recherche, publiés ou non,
émanant des établissements d’enseignement et de
Modeling the effect of exogenous Interleukin 7 in HIV
patients under antiretroviral therapy with low immune
reconstitution
Ana Jarne Munoz
To cite this version:
Ana Jarne Munoz. Modeling the effect of exogenous Interleukin 7 in HIV patients under antiretroviral
therapy with low immune reconstitution. Santé publique et épidémiologie. Université de Bordeaux,
2015. English. �NNT : 2015BORD0410�. �tel-01273295�
TH `ESE PR ´ESENT ´EE POUR OBTENIR LE GRADE DE
DOCTEUR DE
L’UNIVERSIT´
E DE BORDEAUX
´
ECOLE DOCTORALE: SOCI ´ET ´ES, POLITIQUES ET SANT ´E PUBLIQUE (EDSP2)
MENTION: SANT ´E PUBLIQUE ET EPID ´EMIOLOGIE OPTION: BIOSTATISTIQUE
Ana JARNE MU ˜
NOZ
Modeling the effect of exogenous Interleukin 7
in HIV patients under antiretroviral therapy
with low immune reconstitution
Sous la direction de: Daniel COMMENGES (co-directeur: Rodolphe THI ´EBAUT)
Pr´esent´ee et soutenue publiquement le 10 D´ecembre 2015 Membres du jury:
Fran¸cois DUFOUR Pr´esident Robin CALLARD Rapporteur Fabien CRAUSTE Rapporteur Francisco GUILL ´EN Examinateur Daniel COMMENGES Directeur Rodolphe THI ´EBAUT Directeur
A mi familia `
Acknowledgements
A Daniel Commenges
Je souhaite que ces premi`eres lignes vous soient d´edi´ees. Vous m’avez donn´e l’opportunit´e de commencer cette aventure, et je ne vous remercierai jamais assez. Je suis profond´ement reconnaissante d’avoir pu profiter de vos connais-sances et votre p´edagogie. Cependant, ce qui a ´et´e le plus precieux pour moi a ´
et´e le fait de partager le quotidien avec vous pendant ces trois ans. Soyez assur´e de ma profonde affection.
A Rodolphe Thi´ebaut
Je vous suis tr`es reconnaissante d’avoir accept´e de codiriger cette th`ese. Merci aussi pour tout ce que vous m’avez appris pendant ce temps. Votre dynamisme et votre enthousiasme m’ont aid´e `a toujours maintenir la motivation. Veuillez accepter l’expression de ma sinc`ere gratitude.
A Fabien Crauste
Je vous remercie d’avoir accept´e d’ˆetre rapporteur de ce travail. Votre exp´erience en mod´elisation math´ematique m’est particuli`erement pr´ecieuse.
A Robin Callard
I admire your work very much. I am very grateful for your presence among the jury members.
A Francisco Guill´en
La estancia en Pamplona me result´o una experiencia muy enriquecedora. Muchas gracias por aceptar formar parte de este comit´e.
A Fran¸cois Dufour
Merci d’avoir accept´e d’examiner mes travaux. Je suis ravie d’avoir l’opportunit´e d’en discuter avec vous.
Merci aux participants des ´etudes INSPIRE et `a toutes les personnes qui ont collabor´e `a leur r´ealisation. Merci `a Th´er`ese Croughs, Yves Levy, Jean Fran¸cois Delfraissy, ainsi que la dissoute Cyth´eris et RevImmune pour nous avoir donn´e l’opportunit´e d’acc´eder `a ces donn´ees, ainsi que pour toutes les facilit´es.
Un grand merci aussi aux membres des ´equipes Biostat et SISTM, ainsi qu’`a l’ensemble de l’ISPED pour les bons moments pass´es dans le centre. Ce fut un plaisir de travailler avec une si bonne ambiance. Merci `a M´elanie Prague pour son temps et son attention constante. Merci `a Camille, `a M´el, `a Juan... `
a tous ceux qui ont fait de cette exp´erience professionnelle remarquable une exp´erience personnelle inoubliable.
Finalement, j’exprime ma profonde gratitude au VRI (Institut de Recherche Vaccinale) qui a enti`erement financ´e cette th`ese.
Scientific production
PUBLICATIONS: Papers published:
Thi´ebaut, R., Drylewicz, J., Prague, M., Lacabaratz, C., Beq, S., Jarne, A., Croughs, T., Sekaly, R.P., Lederman, M.M., Sereti, I., Commenges, D., L´evy, Y. (2014). Quantifying and predicting the effect of exogenous interleukin-7 on CD4+ T cells in HIV-1 infection. PLoS computational biology, 10(5), e1003630.
Toutain, J., Prochazkova-Carlotti, M., Cappellen, D., Jarne, A., Chevret, E., Ferrer, J., Idrissi, Y., Pelluard, F., Carles, D., Maugey-Laulon, B., Lacombe, D., Horovitz, J., Merlio, J.P., Saura, R. (2013). Reduced placental telom-ere length during pregnancies complicated by intrauterine growth restriction. PloS one, 8(1), e54013.*
* This paper was the object of a punctual collaboration, and it is not related with the rest of the thesis work.
Papers under review (minor revisions):
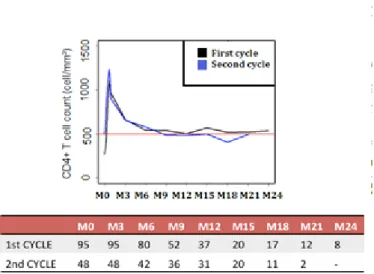
Thi´ebaut, R., Jarne, A., Routy, J.P., Sereti, I., Fischl, M., Ive, P., Speck, R., D’Offizi, G., Casari, S., Commenges, D., Foulkes, S., Croughs, T., Delfraissy, J.F., Tambussi, G., Levy, Y., & Lederman, M.M. Repeated cycles of recom-binant human Interleukin 7 in HIV-infected patients with low CD4 T cell reconstitution on antiretroviral therapy: Results of two Phase II multicentre studies. Submitted to Clinical Infectious Diseases (August 2015)
Papers in preparation:
Jarne, A., Commenges, D., Prague, M., Levy, Y., Thi´ebaut, R. for INSPIRE 2&3 study group. Modeling CD4 dynamics in HIV-infected patients receiving repeated cycles of exogenous Interleukin 7. For Annals of Applied Statistics
ORAL COMMUNICATIONS:
July 2014: 27th International Biometric Conference, Florence, Italy Using mechanistic models to analyze the effect of Interleukin 7 treatment in HIV infected patients. Jarne, A., Thi´ebaut, R., Prague, M., Commenges, D.
June 2014: 2nd Bordeaux Modelling Workshop, Bordeaux, France Model-ing the effect of exogenous IL-7 in HIV infected patients. Jarne, A., Thi´ebaut, R., Commenges, D.
June 2013: 1st Bordeaux Modelling Workshop, Bordeaux, France Model-ing the response to IL-7 therapy in HIV infected patients Jarne, A., Commenges, D., Prague, M., Thi´ebaut, R.
POSTER COMMUNICATIONS:
February 2015: CROI (Conference on Retroviruses and Opportunistic In-fections), Seattle, USA Repeated injections of r-hIL-7 in HIV patients receiving cART in INSPIRE 2&3 phase II trials. Thi´ebaut, R., Jarne, A., Routy, J.P., Sereti, I., & Lederman, M.
May 2013: 20th International HIV Dynamics & Evolution Conference, Utrecht, the Netherlands Modeling the effect of Interleukin 7 on CD4+ T cells. Jarne, A., Prague, M., Thi´ebaut, R., Commenges, D.
October 2013: Early-stage researchers on HIV Summer School, Carry-en-Rouet, France Modeling the effect of IL-7 on CD4+ T lymphocytes
count. Jarne, A., Thi´ebaut, R., Prague, M., Commenges, D.
November 2014: Bordeaux Computational Biology and Bioinformatics, Bor-deaux, France Modeling the effect of r-hIL-7 on CD4+ lymphocytes
Contents
1 Introduction 1
2 HIV infection and cART therapy 4
2.1 Introduction: HIV pandemic in 2015 . . . 4
2.2 Human Immunodeficiency Virus . . . 4
2.2.1 Background: Immunity and CD4+ T cells . . . . 4
2.2.2 What is the HIV virus? . . . 5
2.2.3 HIV discovery . . . 6
2.2.4 Natural evolution of untreated HIV infection . . . 6
2.2.5 Virus replication . . . 6
2.3 Therapies against HIV virus . . . 7
2.3.1 Antiretrovirals birth . . . 7
2.3.2 Combined Antiretroviral Therapy . . . 8
2.3.3 Main goals of cART . . . 10
2.3.4 Immune reconstitution by CD4 count and viral load . . . 10
2.3.5 Conclusion . . . 11
2.4 Immune response to HAART . . . 11
2.4.1 Different immunological responses to cART . . . 11
2.4.2 Consequences at short and long term . . . 12
2.4.3 Immunological response through time . . . 12
2.4.4 Immunological “low” responders . . . 12
2.4.5 Parameters associated with immunological response to cART 13 3 Adjuvant interventions for HIV: Immunotherapy 15 3.1 Immunotherapies . . . 15
3.1.1 Adjuvant therapies for HIV . . . 15
3.1.2 The role of cytokines . . . 15
3.1.3 Interleukin 2 therapy . . . 16
3.2 Endogenous Interleukin 7 . . . 17
3.2.1 Introduction . . . 17
3.2.2 Endogenous IL-7 in lymphopenia . . . 17
3.3 Exogenous IL-7 therapy . . . 18
3.3.1 IL-7 in other diseases . . . 18
3.3.2 IL-7 therapy in HIV infection . . . 18
3.3.3 INSPIRE (1) study . . . 19
3.3.4 Description of the INSPIRE 2 and INSPIRE 3 studies . . 20
4 Background: Modeling 25
4.1 Introduction . . . 25
4.2 HIV modeling framework . . . 25
4.3 Parts of the theoretical model . . . 26
4.4 Maximum likelihood estimation . . . 28
4.5 Original model . . . 29
4.5.1 Description of the original model . . . 29
4.5.2 Results for the original model . . . 31
5 Modeling a single cycle of r-hIL-7 33 5.1 Introduction: basic model . . . 33
5.1.1 Building our basic model . . . 33
5.1.2 Results for the basic model . . . 33
5.2 Incorporating a feedback model . . . 36
5.2.1 Original feedback term . . . 36
5.2.2 Other considered possibilities for the feedback term . . . 36
5.2.3 Conclusion . . . 38
5.3 Pharmacokinetic/pharmacodynamic (PK/PD) model . . . 39
5.3.1 Introduction . . . 39
5.3.2 Data . . . 39
5.3.3 Description of the PK model . . . 39
5.3.4 Results of the PK model . . . 41
5.3.5 Pharmacodynamic model . . . 43
5.3.6 Sigmoid function as the pharmaco-dynamic function . . . 43
5.3.7 Conclusion of the concentration model . . . 44
5.4 Four-compartment model . . . 45
5.4.1 Introduction . . . 45
5.4.2 Description of the four-compartment model . . . 45
5.4.3 Results of the four-compartment model . . . 47
5.5 Three β’s model . . . 50
5.6 Three-compartment model . . . 53
5.6.1 Basis of the three-compartment model . . . 53
5.6.2 Three-compartment model with a thymic compartment . 55 5.6.3 Three-compartment model with a Q+ compartment . . . 55
5.6.4 Three-compartment model with feedback . . . 56
5.6.5 Conclusion of the three-compartment model . . . 57
6 Modeling repeated cycles of IL-7 59 6.1 Incorporating data from INSPIRE 2 and INSPIRE 3 studies . . . 59
6.2 Cycle effect model: Effect of successive cycles . . . 61
6.3 Repeated cycles maintaining adequate CD4 count . . . 66
6.4 Adaptive protocols . . . 67
6.5 Conclusion . . . 71
8 R´esum´e d´etaill´e en fran¸cais 75
8.1 Introduction . . . 75
8.1.1 Contexte ´epid´emiologique . . . 75
8.1.2 Contexte biologique . . . 75
8.1.3 Patients `a faible r´eponse immunitaire . . . 77
8.1.4 Immunoth´erapie . . . 78
8.1.5 Interleukine 7 . . . 79
8.2 Les ´etudes INSPIRE . . . 79
8.2.1 Background: INSPIRE (1) . . . 79
8.2.2 Analyse descriptive d’INSPIRE 2 et 3 . . . 80
8.3 Mod´elisation math´ematique . . . 81
8.3.1 Contexte . . . 81
8.3.2 Approche utilis´ee . . . 82
8.3.3 Mod`ele original . . . 83
8.3.4 Notre mod`ele de base . . . 84
8.3.5 Mod`ele pharmacocin´etique . . . 85
8.3.6 Mod`ele `a 4 compartiments . . . 85
8.3.7 Mod`ele `a 3 β’s . . . 86
8.3.8 Mod`ele `a 3 compartiments . . . 87
8.3.9 Mod´elisation des donn´ees d’INSPIRE 2 et 3 . . . 87
8.4 L’´epid´emiologie du VIH `a Pamplona . . . 89
A Appendix A: Computing NIMROD calculation time 90 B Appendix B: Equilibrium points 92 C Appendix C: Coefficient of the reversion rate 94 D Appendix D: CID’s paper 95 E Appendix E: AOAS’s paper 96 F HIV epidemy figures in Navarra (Spain) 97 F.1 Introduction . . . 97
F.2 Descriptive analysis of data . . . 98
F.3 Diagnostic delay . . . 100
F.4 Survival analysis : Cox model and Kaplan-Meier curves . . . 101
F.4.1 Analysis of the AIDS-free time . . . 102
F.4.2 Analysis of survival time: from HIV diagnosis to death . . 103
F.5 Survival study: Parametric models . . . 103
F.6 Estimating the number of people living with HIV infection with-out diagnosis in Navarra . . . 106
List of Figures
2.1 Stages of the natural history of HIV infection. From: O Brien, Stephen J. & Hendrickson, Sher L. (2013) Host genomic influ-ences on HIV/AIDS. Genome Biology 2013, 14:201. Retrieved 9 September 2015, from GenomeBiology. doi:10.1186/gb-2013-14-1-201 . . . 7 2.2 Main steps in the HIV replication cycle with antiretroviral drugs
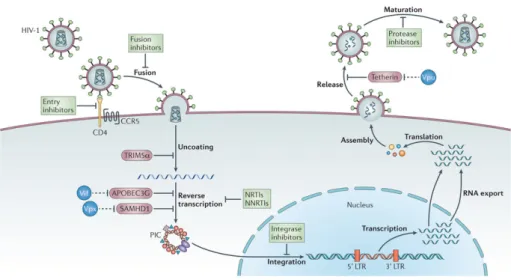
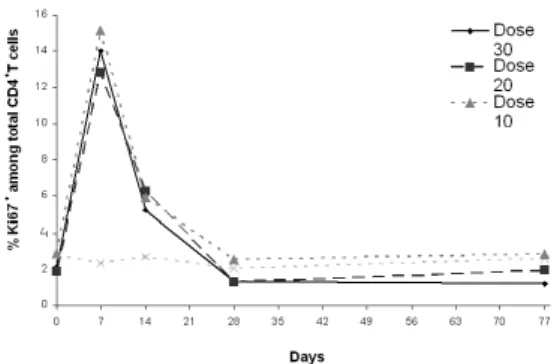
blocking them. From: Barr´e-Sinoussi, F. & Ross, A.L. & Del-fraissy, J.F. (2013) Past, present and future: 30 years of HIV research. Nature Reviews Microbiology 11, 877-883 (2013). Re-trieved 5 September, 2015, from Nature. doi:10.1038/nrmicro3132 8 3.1 CD4 count by group for INSPIRE patients . . . 19 3.2 Percentage of CD4+Ki67+ cells by group for INSPIRE patients . 20 3.3 INSPIRE 2 design . . . 20 3.4 INSPIRE 3 design . . . 21 3.5 Observed CD4 responses for INSPIRE 2 & 3 patients when
re-ceiving 1-injection cycles, 2-injections cycles or complete cycles within repeated cycles with the number of observations at each time . . . 23 3.6 Observed CD4 responses for INSPIRE 2 & 3 patients when
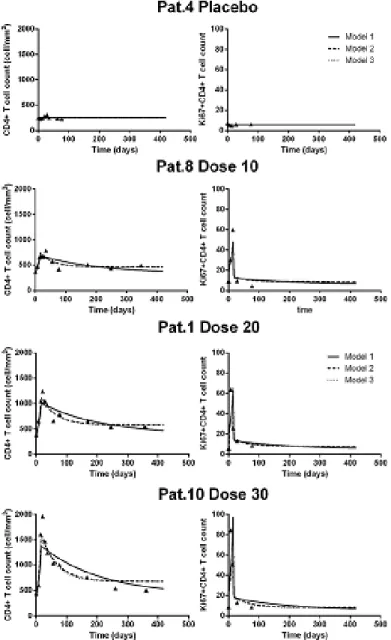
re-ceiving initial and maintenance (complete) cycles . . . 24 4.1 Graphical representation of the basic mathematical model . . . . 30 4.2 Goodness of fit of CD4 count for a random patient in each dose
group from INSPIRE (1) when considering only an effect on π (Model 1), on π and µQ (Model 2) or on π and λ (Model 3) . . . 32
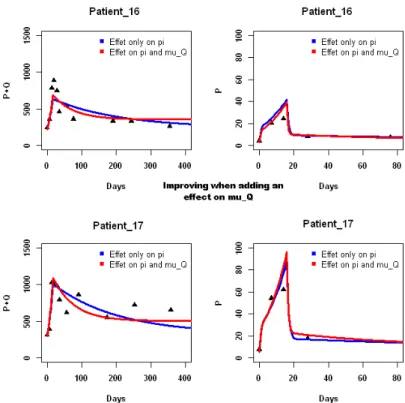
5.1 Fits of basic model for two representative patients, patient 16 and patient 17, for appreciating the effect of a supplementary IL-7 effect on µQ with respect to only an effect on π . . . 35
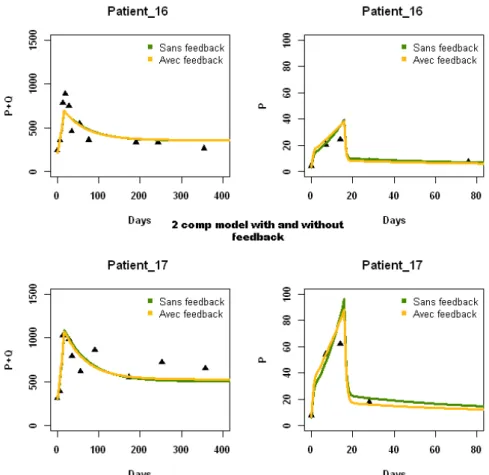
5.2 Comparison of fits of “basic model” with and without feedback, when considering an effect of IL-7 on π and µQ . . . 38
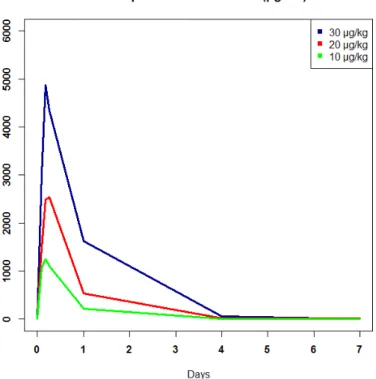
5.3 Mean IL-7 plasma concentration for patients from INSPIRE study by group during 7 days after the first injection . . . 40 5.4 Mathematical representation of the original 4 compartments model,
where proliferating naive cells become quiescent memory cells at rate τ . . . 46
5.5 Mathematical representation of the modified 4 compartments model, where proliferating naive cells become proliferating memory cells
at rate τ . . . 47
5.6 Fits of four-compartment model with an effect of IL-7 on π and π0 for patient 16. Horizontal arrow stands for a switch from naive proliferating cells to memory proliferating cells. Diagonal arrow stands for a switch from naive proliferating cells to memory quiescent cells. . . 48
5.7 Fits of four-compartment model with an effect of IL-7 on π and π0 for patient 17. Horizontal arrow stands for a switch from naive proliferating cells to memory proliferating cells. Diagonal arrow stands for a switch from naive proliferating cells to memory quiescent cells. . . 48
5.8 Fits for the “three-β’s model . . . 52
5.9 Graphical representation for the 3 compartments model . . . 53
5.10 Fits for the three-compartment model . . . 55
5.11 Graphical representation for the “three-compartment model” with a Q+ compartment . . . . 56
5.12 Comparison of the “three-compartment model” with and without feedback (on π or on τ ). No differences are observed. . . 58
6.1 Fits for the “cycle effect model” of total CD4 count for 12 pa-tients from INSPIRE 2 and 3 chosen randomly among those who received more than a cycle. . . 63
6.2 Fits for the “cycle effect model” of Ki67 count for 6 patients from INSPIRE and INSPIRE 2 chosen randomly among those who had measurements for this biomarker (only during the first cycle). . . 64
6.3 CD4 count (cells/µL) predictions for 4 years for a patient having bi ρ = biλ = 0. Protocols A, B and C include a first complete cycle followed by: complete cycles (A), two-injection cycles (B) and one-injection cycles (C). Protocol D includes only 2-injection cycles. Vertical dotted lines are CD4 count (every three months) and vertical solid lines are injections. Horizontal line marks the CD4 threshold of 550 cells/µL. . . 66
6.4 CD4 count (cells/µL) predictions for 4 years for a particularly good responder patient. Protocols A, B and C include a first complete cycle followed by: complete cycles (A), two-injection cycles (B) and one-injection cycles (C). Protocol D includes only 2-injection cycles. Vertical dotted lines are CD4 count (every three months) and vertical solid lines are injections. Horizontal line marks the CD4 threshold of 550 cells/µL. . . 68
6.5 CD4 count (cells/µL) predictions for 4 years for a patient with a particularly poor response. Protocols A, B and C include a first complete cycle followed by: complete cycles (A), two-injection cycles (B) and one-injection cycles (C). Protocol D includes only 2-injection cycles. Vertical dotted lines are CD4 count (every three months) and vertical solid lines are injections. Horizontal line marks the CD4 threshold of 550 cells/µL. . . 69
F.1 Population pyramid in Navarra (Spain). Obtained from http:// www.navarra.es/home es/Navarra/Asi+es+Navarra/Navarra+en +cifras/Demografia/poblacion.htm at October, 1st 2015 . . . 97 F.2 Mean age at HIV diagnosis among men . . . 99 F.3 Mean age at HIV diagnosis among women . . . 99 F.4 Kaplan-Meier survival curve when the event is the diagnosis of
AIDS with respect to the sex . . . 102 F.5 Kaplan-Meier survival curve when the event is the diagnosis of
AIDS with respect to the age group . . . 102 F.6 Kaplan-Meier survival curve when the event is the diagnosis of
AIDS by distinguishing by CD4 count bigger or lower than 200 cells/µL . . . 103
List of Tables
2.1 Brand name and active ingredients of the drugs currently used in the treatment of HIV infection. From: U.S. Food and Drug Ad-ministration (FDA). Retrieved 9 September, 2015, from fda.gov. Updated 25 September 2014 . . . 9 3.1 Main eligibility criteria for INSPIRE 2 and 3 studies . . . 22 3.2 Shared Gamma Frailty model using a Weibull hazard function.
Data are based on 95 patients with a CD4 T cell count > 550 cells/µL two weeks after the last injection of r-hIL-7 . . . 24 4.1 Biological meaning of parameters from the original model . . . . 30 5.1 Obtained log-likelihood for every model with values for η1at the
top and values for η2 on the left . . . 34
5.2 Priors and estimated mean and standard deviation (sd) of all pa-rameters (in logarithmic and natural scales) for the “basic model” when considering IL-7 effects on π and µQ. . . 34
5.3 Priors and estimated mean and standard deviation (sd) of all pa-rameters (in logarithmic and natural scales) for the “basic feed-back model” when considering IL-7 effects on π and µQ.
Penal-ized (P) and Non PenalPenal-ized (NP) likelihood and LCVa criteria . 37 5.4 Biological meaning of pharmacokinetic parameters . . . 41 5.5 Estimated means of all parameters in logarithmic scale for the
“pharmacokinetic model” for different exponential functions of tissue (Ti) and plasma (Pl) concentration. Penalized log-likelihood (PLL) and LCVa criteria. . . 42 5.6 Estimated means of all parameters in logarithmic scale for the
“sigmoid model“ with C0.40T for α = 0.5, 1, 2 and 5 when con-sidering only an IL-7 effect on proliferation rate π. Penalized log-likelihood (PLL) and LCVa criteria. . . 44 5.7 Estimated parameters mean for different several four-compartment
model. Non identifiable parameters are shown in gray. Non Pe-nalized likelihood (NPLL) and LCVa criteria. . . 49 5.8 Likelihood functions and LCVa when considering a r-hIL-7
ef-fect on π through a single βπ for 16 days and different β’s for t
days. The effect on µQ has been considered as previously (see
Equation 4.9). Random effects are applied on λ and ρ. Penalized log-likelihood (PLL), Non-Penalized log-likelihood (NPLL) and LCVa criteria . . . 50
5.9 Priors and estimated mean and standard deviation (sd) of all pa-rameters (in logarithmic and natural scales) for the “3 β’s model” with an effect on π for 7 days when considering patients from IN-SPIRE (1) . . . 51 5.10 Results for the “three-compartment model” without feedback.Fixed
effects on π and λ. Non Penalized and Penalized likelihoods and LCVa critieria. . . 54 5.11 Summary for the “three-compartment model” with and without
feedback. Fixed effects are considered on π and λ. Non Penalized likelihood and LCVa criteria. . . 57 6.1 Priors and estimated mean and standard deviation (sd) of all
pa-rameters (in logarithmic and natural scales) for the “3 β’s model” when considering all the 128 patients (only data from the first cy-cle). . . 60 6.2 Priors and estimated mean and standard deviation (sd) of all
pa-rameters (in logarithmic and natural scales) for the “cycle effect model” when considering all cycles for each patient; Penalized and Non Penalized likelihoods, and LCVa criteria . . . 62 6.3 Priors and estimated mean and standard deviation (sd) of all
pa-rameters (in logarithmic and natural scales) for the “cycle effect model” when considering all cycles for each patient including a feedback term with ν=0.1. Penalized and Non Penalized likelihood, and LCVa criteria . . . 65 6.4 Comparison of the number of injections and cycles received, time
under 500 CD4 count and median CD4 count for a patient with random effects equal to zero for the four protocols through four years. In protocol A, the patient always receives complete cycles; in protocol B, the patient receives a first complete cycle followed by repeated cycles composed of two injections; in protocol C the patient receives a first complete cycle followed by repeated cycles of one single injection; in protocol D the patient always receives 2-injection cycles (including the initial one) . . . 67 6.5 Comparison of the number of injections and cycles received, time
under 500 CD4 count and median CD4 count for a “good respon-der” patient for the four protocols through four years. In protocol A, the patient always receives complete cycles; in protocol B, the patient receives a first complete cycle followed by repeated cycles composed of two injections; in protocol C the patient receives a first complete cycle followed by repeated cycles of one single injection; in protocol D the patient always receives 2-injection cycles (including the initial one) . . . 68
6.6 Comparison of the number of injections and cycles received, time under 500 CD4 count and median CD4 count for a “bad respon-der” patient for the four protocols through four years. In protocol A, the patient always receives complete cycles; in protocol B, the patient receives a first complete cycle followed by repeated cycles composed of two injections; in protocol C the patient receives a first complete cycle followed by repeated cycles of one single injection; in protocol D the patient always receives 2-injection cycles (including the initial one) . . . 70 A.1 Computational time (expressed in seconds) for two iterations of
the “basic model” when changing the number of patients . . . . 91 A.2 Computational time (expressed in seconds) for computing
tra-jectories of 6, 12 and 100 patients when the analytic solution is delivery and when it must be computed numerically . . . 91 F.1 Number of HIV diagnosis in Navarra by period from 1985 to 2013 98 F.2 Multivariate descriptive analysis of the dependance of the late
diagnosis on age, sex, period of diagnosis, origin or way of trans-mission . . . 100 F.3 Comparison of the dependance of diagnostic delay according to
the definition on age, sex, period, origin and way of transmission 101 F.4 Survival analysis for the time from HIV diagnosis to death . . . . 104 F.5 Comparing likelihood function for each one of the parametric
models . . . 104 F.6 Weibull model applied to our data . . . 105
Chapter 1
Introduction
This thesis has been entirely financed by the Vaccine Research Institute. The VRI was established by the French National Agency for Research on AIDS and viral hepatitis (ANRS) and the University of Paris-Est Cr´eteil (UPEC) following the award of the status of Laboratory of Excellence by an international scientific jury and announced by the French Prime Minister on 25 March 2011. The mis-sion of the VRI (that is headed by Yves Levy) is to conduct research to accelerate the development of effective vaccines against HIV/AIDS and HCV. This thesis work has been developed in the context of the Biostatistics and bioinformatics section, headed by Rodolphe Thi´ebaut;
The introduction of cART (combined antiretroviral therapy) has resulted in the recognition of HIV as a chronic condition, with major improvements in the life quality of HIV-infected patients. Generally, viral load dramatically decreases a few weeks after starting antiretroviral therapy, until it becomes undetectable. This usually leads to an adequate reconstitution of CD4+T cells pool with the
consequent improvement in the immunenity, but sometimes this is not true. This work has been focused on these “low responder patients”, who fail to achieve a good enough improvement in CD4+T cells count despite undetectable viral load
after at least 6 months of cART therapy. The CD4+ cells count remaining the
best single indicator of immunodeficiency related to infection with HIV, novel therapeutic approaches and more concretely immunotherapeutic approaches are being considered for improving immune competence. In our days, the scientific
community is interested in Interleukin 7, a cytokine naturally secreted in the bone marrow and the thymus, as a promising adjutant therapy to boost the immune system of these patients.
The HIV infection is paradoxically a slow progressive pathogenic process including rapid, highly dynamic mechanisms. Dynamical models based on sys-tems of ordinary differential equations have been widely used and particularly useful to study these mechanisms, as well as the interaction between HIV virions and CD4+ T cells. During this thesis work, we have placed us in an scenario with undetectable viral load, and we have modeled the effect of exogenous In-terleukin 7 on CD4+T cells. We have studied some amendments to an existing mathematical model based on a system of ordinary differential equations. This system distinguishes two main sub-populations of CD4+ T lymphocytes, quies-cent (CD4+Ki67−) and proliferating (CD4+Ki67+), according to the presence
or not of the Ki67 proliferation biomarker. Also, we have used a complex statis-tical theory developed in the team in recent years for considering some different statistical models for the effect of the Interleukin 7. These models have been compared according to different comparison criteria, fits of real data or predic-tive abilities.
Second chapter provides a sufficiently wide background of HIV, antiretrovi-ral therapy and immune response to cART. After a brief look at the state of the global HIV/AIDS pandemic in 2015, we focus on biological basis of the interac-tion HIV/immune system. Once we have a descripinterac-tion of the HIV virus nature and behavior, a historical look at the antiretroviral drugs birth and cART use are exposed with a particular emphasis on mechanisms of reconstitution follow-ing therapy. Finally, we focus on normal and pathological immune responses to cART, with a bibliographic summary of figures and related parameters that have been published in relation to the target population: the “low immunolog-ical responders”.
Chapter three is dedicated to immune-based interventions. After a back-ground about the utility of developing adjuvant therapies for these “immuno-logical low responder” patients, there is a presentation of the cytokine signal-ing as a fundamental process for human body regulation. An overview of the Interleukin-2 case (which was considered as a promising intervention for low immune responders) precedes the review of the Interleukin 7 (IL-7). Here we care about endogenous IL-7 production and behavior, as well as some oppor-tunities for its clinical application. We have revised the clinical trials involving exogenous IL-7 in HIV infection to date, and we have fully entered into the INSPIRE 2 and INSPIRE 3 studies, to which analysis we have contributed in this thesis work. INSPIRE 2 and INSPIRE 3 trials are, to our knowledge, the first studies where repeated cycles of exogenous IL-7 are administrated to HIV infected patients.
The fourth chapter presents a background on mathematical modeling, with a special look to history and behavior of dynamic models focused on the in-teraction between the HIV virus and the immune system. We have extensively revised the theory underlying mixed effect models based on ODE systems, by looking in depth the ”“half-Bayesian” statistical approach that has been used to estimate the unknown parameters. We present the existent mathematical model we have used, conceived for modeling data from patients receiving a sin-gle cycle of exogenous IL-7. It has been our “original model”, from which we have adapted different mathematical and statistical patterns.
The fifth chapter slightly modifies the previous model to transform it into our “‘basic model”, that has been studied deeply in terms of statistical results and goodness of fits. Then, it has been modified again for letting introduce a feedback term. Different models have been studied and they are proposed with the obtained results. For instance, the “pharmacokinetic/pharmacodynamic model”, which takes into account the estimated concentration of exogenous IL-7 at each time instead of the dose received. Also, a “four-compartment model” involving naive and memory CD4+ T cells, as well as the “three-β’s model”, that has finally been kept for future analysis. Finally, the “three-compartment model” is shown with its modifications and obtained results, that tried unsuccessfully to explain the biological background for the improvement obtained with the “three-β’s model”.
Chapter six incorporates data from patients receiving repeated cycles from the INSPIRE 2 and INSPIRE 3 trials, assessing the theoretical long-term effi-cacy of this immune therapy. We have applied previous models to this data set, and also a new statistical model is proposed to compare the effect of repeated cycles with respect to the effect of the initial one. This “cycle effect” is found to be significant and slightly lower than 1. Some hypotheses have been sug-gested for trying to explain this phenomenon, as the so-called feedback effect or the presence of antibodies. In this Chapter, we have also predicted the effect of exogenous IL-7 when administered throughout different scenarios (different number of injections in a cycle). Predicted trajectories of a regular patient (with both random effects equal to zero) and two real patients have been displayed for 4 years. We have ended up concluding that repeated complete cycles are perhaps not necessary for all patients, and an adaptive treatment in function of the response to the first cycle could be considered.
Chapter seven concludes, and a French abstract can be found in Chapter eight. To finish, during this thesis work I have had the opportunity of doing a 3 months internship at the Universidad de Navarra (Spain) in the framework of the M´erim´ee program. There, I took part of a team that is searching to describe the epidemiology of HIV in Navarra and to estimate in this region the number of HIV infections that are currently without diagnosis. This is explained in Appendix F.
Chapter 2
HIV infection and cART
therapy
2.1
Introduction: HIV pandemic in 2015
The end date for both the Millennium Development Goals (MDGs) and the 2011 Political Declaration on HIV and AIDS is the year 2015. For this occasion, UNAIDS (Joint United Nations Program on HIV and AIDS) has presented a report in order to review progress and start preparing for the final reporting towards these targets. As the main statistics, there were 2.3 million people newly infected in 2012, even though new HIV infections drop by 30% since 2002 (Maartens et al., 2014). There are 35 million people living with HIV in the world (and the trend is on the rise), of which 19 million do not know their HIV-positive status (Kelly and Wilson, 2015). In 2012 there were 1.6 million AIDS-related deaths. Overall, almost 78 million people have been infected and about 39 million people have died of HIV since the beginning of the pandemic (according to the World Health Organization).
In 2011, the United Nations Political Declaration on HIV and AIDS rec-ognized that HIV and AIDS constitute a global emergency, posing one of the most formidable challenges to the development, progress and stability of soci-eties and the world at large. They noted that despite substantial progress over the three decades since AIDS was first reported, the HIV pandemic remains an unprecedented human catastrophe.
2.2
Human Immunodeficiency Virus
2.2.1
Background: Immunity and CD4
+T cells
Immune system comprises small cells called lymphocytes, that can be divided into B and T cells. B cells are produced in the bone marrow and they carry extremely diverse antibody molecules. When a foreign pathogen like a virus enters the body, the B cells that have antibody receptors of the correct specificity will become activated. They will start to multiply providing even more specific interaction with the virus. Antibody molecules of B cells can bind to the virus particle and mark it as a foreign structure for elimination by other cells of the
immune system (Nowak and May, 2000). T cells are produced in the thymus and they can be roughly classified according to the quantity of surface proteins into CD8 positive (CD8+) cells and CD4 positive (CD4+) cells. There are also
some functionally distinct populations: Helper T cells can secrete cytokines (proteins acting as the messenger molecules of the immune system); cytotoxic T lymphocytes (CTLs) kill infected cells; natural killer (NK) cells are involved in innate immunity; regulatory T cells (Treg) inhibit immune responses.
HIV virus infect CD4+ T cells leading to a progressive depletion of the number and functionality of these cells, together with progressive impairment of cellular immunity and increasing susceptibility to opportunistic infections (Okoye and Picker,2013). CD4+ T cells count (CD4 count) is then used as an indicator of HIV and AIDS disease progression.
Two distinct populations of T lymphocytes can be distinguished by pheno-typic criteria: naive and memory cells. Mature T cells are produced in thymus and the bone marrow, and then they migrate into lymph nodes, spleen and mucosa-associated lymphoid tissue (Male and Brostoff, 2007). Those who are immunologically inexperienced are called naive lymphocytes, and they will die as naive cells if they do not recognize MHC-peptide complexes for which their T-cell receptors (TCR) have high affinity (Berard and Tough, 2002). In the steady state, the generation of new cells and the spontaneous death of these cells maintain the pool of naive lymphocytes at a fairly constant number. After naive lymphocytes are activated in specialized lymphoid organs they become larger and proliferate and are called lymphoblasts, some of which differentiate into effector lymphocytes (having the ability to produce molecules capable of eliminating foreign antigens). On the other hand, memory cells may survive in a functionally quiescent or slowly cycling state for months or years. Although it is still not clear which surface proteins are definitive markers of memory popu-lations, they have long been classified into central memory T cells (restricted to the secondary lymphoid tissues and blood) and effector memory T cells (which can migrate between peripheral tissues). Recently, another player has been highlighted: the tissue-resident memory T cells, that occupies tissues without recirculating (Mueller et al.,2013;Shin and Iwasaki,2013;Sathaliyawala et al., 2013).
2.2.2
What is the HIV virus?
Human Immunodeficiency Virus (HIV) is a retrovirus (their RNA genome is transcribed into DNA by means of the enzyme reverse transcriptase: RT) firstly isolated in 1983. As a member of the lentivirus family, it generally produces a long-term latent infection and slowly progressive, fatal diseases. Two major types have been identified: HIV-1 and HIV-2. HIV-2 has the same modes of transmission but a lower infectivity potential than HIV-1 (Kanki et al., 1994) and a slower progression to AIDS (Campbell Yesufu and Gandhi,2011). These two types may be further divided into groups, where HIV-1 group M is the most common cause of AIDS. Henceforth in this work we will only reference to HIV-1, even if only HIV is written for clarity purposes.
Primary target of HIV are CD4+ T cells, in which the virus can replicate
and thereby exhaust the lymphocytes, producing profound immunodeficiency (Kurth and Bannert, 2010). In retroviruses, frequent ARN variations produce new viral genotypes that can mutate into new viral quasispecies. For HIV,
about three base exchanges were estimated in a single reverse transcription of the genome (seeUnger et al.(2000)).
2.2.3
HIV discovery
Warning signs began in 1981 with the publication of Gottlieb et al. (1981), where a medicine assistant professor from Los Angeles presented the case of four previously healthy homosexual men who had contracted Pneumocystis carinii pneumonia, extensive mucosal candidiasis, and multiple viral infections. In 1982, Stahl et al. (1982) warned that an epidemic of a fulminant variety of Kaposi’s sarcoma had recently appeared among young and middle-aged men in the United States.
The HIV virus was firstly isolated thanks to a biopsied lymph node of a patient with “signs and symptoms that often precede the acquired immune de-ficiency syndrome” in 1983 (Barr´e-Sinoussi et al., 1983). This earned Fran¸cois Barr´e-Sinoussi and Luc Montagnier the 2008 Nobel Prize in Physiology or Medicine. By the summer of 1983, evidence was obtained for a retrovirus related to HTLV (human T-lymphotropic virus) in many patients with AIDS (Gallo, 2002). Soon after the isolation of HIV, its main receptor (CD4 cell surface molecules) was identified (Dalgleish et al., 1984;Klatzmann et al.,1984). This discovery reinforced the idea of monitoring of the quantity of CD4+ T lym-phocytes (CD4 count) together with the concentration of HIV RNA in plasma (viral load) in the follow up of infected patients. A complete review of these three decades of HIV research can be found inBarr´e-Sinoussi et al.(2013).
2.2.4
Natural evolution of untreated HIV infection
Natural history of untreated HIV infection can be divided into three well differ-entiated phases, as detailed in Figure2.1
Primary or Acute HIV Infection starts immediately after infection, and it is characterized by an initial burst of viremia. Although anti-HIV-antibodies are still undetectable, Viral load is already present in the first weeks after the infection (Abu-Raddad, 2015). An important replication rate is accompanied by a significant decrease of the CD4 count. Most of patients in this phase expe-rience symptoms similar to those of many other viral infection that usually go unnoticed. This short phase (6-12 weeks) is followed by the clinically asymp-tomatic stage, where viral load remains stable and CD4 count falls relentlessly. The length of the asymptomatic phase is very heterogeneous, with an average of about 10 years (Nowak and May, 2000). After that, a severe immunod-eficiency appears, where viral load increases and CD4 count drastically goes down. The development of AIDS announces the final phase of the disease, when the immune system is exhausted and patients die from opportunistic infections.
2.2.5
Virus replication
HIV replication cycle (see Figure 2.2) begins with the binding of the virus in a CD4+ T cell. The viral external glycoprotein, gp120, recognizes the CD4
receptor and coreceptors (CXCR4, CCR5) present on the cell surface. Upon infection of the susceptible host cell, HIV-RNA and proteins are released into
Figure 2.1: Stages of the natural history of HIV infection. From: O Brien, Stephen J. & Hendrickson, Sher L. (2013) Host genomic influences on HIV/AIDS. Genome Biology 2013, 14:201. Retrieved 9 September 2015, from GenomeBiology. doi:10.1186/gb-2013-14-1-201
the cytoplasm, and the enzyme reverse transcriptase (RT) uses this to synthe-size double-stranded DNA in the process for which retroviruses have received their designation (Gupta,1996). Synthesized DNA (designated the provirus) is subsequently integrated into the host chromosomal DNA by the enzyme viral in-tegrase (IN). Then, host cell signals initiate the transcription of viral DNA into genomic RNA and messenger RNA (mRNA), thanks to a viral protein called tat. For its part, this mRNA will be therefore used to synthesize viral proteins like tat. Assembly of viral proteins and encapsidation of the viral ARN lead to the formation of new immature virus forms. Finally, the protease enzyme converts them into new infectious virions that are released into the extracellular environment and will be able to infect new cells (Girard et al.,2007).
2.3
Therapies against HIV virus
2.3.1
Antiretrovirals birth
In 1985 Zidovudine (AZT), belonging to a group of drugs known as NRTI (Nu-cleotide Reverse Transcriptase Inhibitors), showed potent effects on the inhi-bition of the infectivity and cytopathic effect of HIV in vitro (Mitsuya et al., 1985). A double-blind, placebo-controlled trial was subsequently conducted in order to establish the in vivo efficacy of AZT in patients with AIDS (seeFischl et al.(1987)). In this study, 282 subjects were stratified according to CD4 count and were randomly assigned to receive AZT (N=145) or placebo (N=137) for a total of 24 weeks. When all subjects had completed at least 8 weeks, 19 placebo patients and only 1 AZT patient had died; the study was stopped and all sub-jects were put on AZT. In an unusually short period the FDA (Food and Drug Administration) recommended the approval of AZT for use as a treatment of
Figure 2.2: Main steps in the HIV replication cycle with antiretroviral drugs blocking them. From: Barr´e-Sinoussi, F. & Ross, A.L. & Delfraissy, J.F. (2013) Past, present and future: 30 years of HIV research. Nature Reviews Microbiology 11, 877-883 (2013). Retrieved 5 September, 2015, from Nature. doi:10.1038/nrmicro3132
selected patients with AIDS (Brook,1987).
Different studies showed how Zidovudine decreased the rates of progression to AIDS as well as significant increased CD4 count in adults with asymptomatic HIV infection (Volberding et al., 1990; Cooper et al., 1993). Simultaneously, other studies advised about drug resistance estimated in about 89% of persons with late-stage HIV infection and 31% of persons with early stage disease after 12 months of AZT therapy (Larder et al.,1989;Richman et al.,1990). It was not until October 1991 that a second drug was approved for the treatment of HIV infection: the Didanosine (ddI). Patients developing AZT resistance mutations were switched to this new monotherapy, but also Didanosine resistances soon appeared (Kozal et al., 1994). Other NRTIs followed in following years, and therapies based on a combination of two of these drugs improved survival by delaying disease progression (Yarchoan et al., 1994;Darbyshire et al.,1996).
2.3.2
Combined Antiretroviral Therapy
The treatment of HIV infection was even more revolutionized in late 1995 and 1996, where two different types of antiretroviral drugs were added to the fight against HIV/AIDS: the PI (Protease Inhibitors) and the NNRTI (Non-Nucleotide Reverse Transcriptase Inhibitors). Several results supported the de-velopment of combinations of more than two antiretroviral drugs to increase and prolong HIV suppression while restricting mutations (D’Aquila et al.,1996; Staszewski et al.,1996). The advent of combined antiretroviral therapy (cART) for the treatment of HIV infection was seminal in reducing the morbidity and mortality associated with HIV infection and AIDS thanks to an important re-duction in HIV replication and increase of CD4 count (Collier et al., 1996).
Nowadays, there are more than one hundred of antiretroviral drugs (see Table
2.1for a review of drug currently used in the treatment of HIV infection). Table 2.1: Brand name and active ingredients of the drugs currently used in the treatment of HIV infection. From: U.S. Food and Drug Administration (FDA). Retrieved 9 September, 2015, from fda.gov. Updated 25 September 2014
TYPE BRAND NAME AND ACTIVE INGREDIENTS
Multi class
Atripla (efavirenz, emtricitabine and tenofovir), Complera (emtricitabine, rilpivirine and tenofovir), Stribild (elvitegravir, cobicistat, emtricitabine and tenofovir)
NRTIs Combivir (lamivudine and zidovudine), Emtriva (emtric-itabine, FTC), Epivir (lamivudine, 3TC), Epzicom (aba-cavir and lamivudine), Hivid (zalcitabine, dideoxycytine, ddC), Retrovir (zidovudine, azidothymidine, AZT, ZDV), Trizivir (abacavir, zidovudine and lamivudine), Truvada (tenofovir and emtricitabine), Videx EC (enteric coated didanosine, ddI EC), Videx (didanosine, dideoxynosine, ddI), Viread (tenofovir, TDF), Zerit (stavudine, d4T), Ziagen (abacavir sulfate, ABC) NNRTIs Edurant (rilpivirine), Intelence (etravirine), Rescriptor (delavirdine, DLV), Sustiva (efavirenz, EFV), Viramune (nevi-rapine, NVP), Viramune XR (nevi(nevi-rapine, NVP)
PIs Agenerase (amprenavir, APV), Aptivus (tipranavir, TPV), Crixivan (indinavir, IDV), Fortovase (saquinavir), Invi-rase (saquinavir mesylate, SQV), Kaletra (lopinavir and ri-tonavir, LPV/RTV), Lexiva (fosamprenavir calcium, FOS-APV), Norvir (ritonavir, RTV), Prezista (darunavir), Rey-ataz (Rey-atazanavir sulfate, ATV), Viracept (nelfinavir mesylate, NFV) Fusion Inhibitors Fuzeon (enfuvirtide, T-20) Entry Inhibitors Selzentry (maraviroc) Integrase transfer Inhibitors
Isentress (raltegravir), Tivicay (dolutegravir)
Controversial in evaluations of the associated short- and long-term complica-tions and costs has been that the start of the antiretroviral therapy was delayed, for many years, until a patient’s CD4 count fell below 200 cells per cubic mil-limeter, which led to frequent opportunistic infections. Today, we know that the use of combined antiretroviral treatment allows also to reduce the spread of HIV
infection. These therapies have shown to reduce the amount of HIV in blood and in genital secretions, which is strongly correlated with sexual transmission of HIV (Cohen et al.,2011).
In our time, first-line ART should consist of two Nucleotide Reverse-Transcriptase Inhibitors (NRTIs) plus a Non-Nucleotide Reverse-Transcriptase inhibitor (NNRTI). Consolidated ARV guidelines presented by the World Health Organization in June 2013 recommend TDF + 3TC (or FTC) + EFV as a fixed-dose combina-tion as the preferred opcombina-tion to initiate ART. In most cases, effective therapy can dramatically reduce the risk of the classically defined AIDS complications (Li et al.,1998). The latest news about HIV treatment appeared on 15 September 2015, when the WHO proposed to begin the antiretroviral treatment as soon as possible, without waiting for achieving any CD4 count threshold.
2.3.3
Main goals of cART
Immunodeficiency results from viral replication, as well as dysregulation and ultimately failure of host homeostatic mechanisms and cellular immune networks (Okoye and Picker,2013). The majority of patients who are able to access and adhere to combination therapy will achieve durable viral suppression together with an increase in the number of CD4 cells and the functional reconstitution of the immune system (Battegay et al.,2006).
Life expectancy for HIV-positive patients accessing ART is improving over time, but it remains below the life expectancy of the general population ( Pat-terson et al., 2015). A patient’s overall prognosis approaches the one of an HIV-negative individual only if CD4 count is consistently maintained over 500 cells/µL (Kelley et al.,2009;Saison et al.,2014).
The key objectives of antiretroviral therapy are to minimize the viral load and to recover and maintain an adequate CD4 count while maintaining a good quality of life and minimizing toxicity and side effects. Then, the target of an-tiretroviral therapy is to keep viral load below detection levels (usually between 20 and 50 copies/mL) and CD4 count above 500 cells/µL.
2.3.4
Immune reconstitution by CD4 count and viral load
From the beginning, the use of cART was linked to marked reductions in mor-bidity and mortality associated with the acquired immunodeficiency syndrome (AIDS). Firstly, the routine use of this combined therapy resulted directly in dramatic improvement in life-expectancy among HIV-infected patients with ad-vanced immune depletion (Autran et al.,1997;Carr et al.,1996;Hammer et al., 1996;Palella Jr et al.,1998), and progressively the beneficial effect of the early initiation of cART reached a global consensus. Kitahata et al. (2009) studied the change of the risk of death in 17517 patients starting cART before the CD4 count fell below 350 or 500 cells/µL. They found that patients in the deferred-groups had an increase in the risk of death of 94% and 69%, respectively.Opportunistic Infections Project Team COHERE et al. (2012) adjusted a Cox proportional hazards model for time to a first new AIDS event or death for patients on cART with a suppressed viral load. They showed that the relation-ship between the improvement in CD4 count and the risk of illness progression strongly varies according to the CD4 count stratum. Absolute risk reduction
for patients with a CD4 count above 500 cells/µL was found to have few clini-cal relevance, whereas it was intermediate for CD4 count from 200 to 350 and from 350 to 500 cells/µL. Importantly, in the category of patients below 200 cells/µL, small improvements of CD4 count showed great decreases in the risk of progression.
In the UK,May et al.(2014) conducted a study relating viral load and CD4 count with life expectancy in HIV-positive persons. They found that, after 5 years of ART, expected age at death of 35-year-old men varied from 54 (48-61) to 80 (76-83) years for those with CD4 count less than 200 cells/µL and no viral suppression versus CD4 count at least 350 cells/µL and suppressed.
Lewden et al. (2007) compared mortality rates in cART treated patients with mortality rates in the general population according to the level of CD4 count and the duration of exposure to cART. They also found that overall mortality for HIV infected patients was 7 times higher than in the general population. However, mortality reached the level of the general population in patients maintaining a CD4 count > 500 cells/µL after the sixth year after initiation of cART. A few years later, they compared mortality rates from data from the study COHERE (Collaboration of Observational HIV Epidemiological Research in Europe) comprising more than 80000 cART-treated HIV-infected people. They found that in a special subgroup (men who do not inject drugs) mortality rate was also similar to the general population when CD4 count > 500 cells/µL (Lewden et al.,2011).
2.3.5
Conclusion
A clear inverse relation exists between the number of CD4 cells in peripheral blood and the risk of HIV-1 associated diseases and mortality. The frequency of opportunistic infections dramatically declines upon initiation of antiretroviral therapy and the subsequent increase in CD4 cell count (Battegay et al., 2006). Even if the routine measures of CD4 cell count in virologically suppressed patients have been questioned in these late years (see a review in Ford et al. (2015)), it continues to be the most important predictor in people with HIV infection.
In the next chapter, we see that there is no clear consensus with regard to how to best define immunological success or failure in the context of sustainable treatment-associated viral suppression.
2.4
Immune response to HAART
2.4.1
Different immunological responses to cART
There is no doubt that AIDS-defining morbidity and mortality has dramatically decreased since the introduction of cART. Several phases of T cell reconstitu-tion can be distinguished: During the first weeks/months, a rapid increase of the CD4 count in plasma is observed, with a specifically rise of memory CD4 cells and destruction of optimal CCR5+viral targets (Autran et al.,1997;Okoye and Picker,2013). After that, mainly the sub-population of memory CD4 lym-phocytes contributes to maintain a slower increase of CD4 count; increase in naive T cells exists but is very limited in adults (Pakker et al.,1999).
Considerable individual variation in the reconstitution of CD4 lymphocytes has been noted. The majority of patients have a good virological response to therapy and exhibit sustained increases in their peripheral CD4 cell count, with most individuals achieving a normal CD4 cell count (Kelley et al.,2009). In few cases there is a virological failure of the therapy, the viral load remains high and this leads to overt AIDS (Okoye and Picker, 2013). Finally, in a significantly fraction of individuals, however, ART fails to effectively reconstitute CD4+ T cells to pre-infection levels despite fully suppressed viral replication (Pakker et al., 1999).
2.4.2
Consequences at short and long term
There is no doubt that individuals without evidence of increases in their CD4 cell count over time take a higher risk of non-AIDS-related morbidity and mortality Chˆene et al. (2003); Kelley et al. (2009); Kantor et al. (2009); Saison et al. (2014).
This risk in clinical progression is observed both at short- and long-term. Grabar et al. (2000) noticed that patients with only a virologic response had significantly higher risks for clinical progression at 6 months (relative risk 1.98) whereasLewden et al.(2007) found that differences in mortality remain higher even 7 years after starting the cART.
2.4.3
Immunological response through time
Patients not achieving an adequate immunologic response despite undetectable viral load are the target population within this work. There is no universal term for designating such patients (for instance Immunological Non Respon-ders: INRs or Inadequate Immunological Responders have been used), and the main reason is the difficulty for finding universal criteria to classify the immune response. It goes without saying that the achieved CD4 count must be the main criterion, but, what is the threshold to determine a good response? (For instance CD4 count<200 cells/µL, CD4 count<350 cells/µL, CD4 count<500 cells/µL, CD4 recovery≤25%, CD4 recovery≥100 cells/µL...). And in terms of time, how long must it take after beginning cART? In fact, whether such patients will experience normalization of their CD4 count with time is a key question.
There are findings consistent with the idea of an asymptomatic effect, where patients would continue to have significant but progressively smaller increases in CD4 count after long time (Mocroft et al.,2007). For example,Lewden et al. (2007) found significant rises in CD4 count after 5 years of cART for patients beginning the treatment with CD4<200 cells/µL whenever viral suppression can be maintained for a sufficiently long period of time. On the other hand, Kelley et al.(2009) could not detect strong evidence of ongoing increases in CD4 count after year 7 among those who had yet to achieve a normal CD4 count, supporting the theory of a “plateau effect”.
2.4.4
Immunological “low” responders
The lack of agreement on defining an immunological low response does not help for estimating the percentage of persons in this situation. In spite of that,
many authors have shed light on this issue. Here we present some of the figures that can be found estimating the number of “low immunological responders” to cART while adequate viral control. However, the mentioned differences in the definition of “low immunological responders” do not let to properly compare them. In any case, every figure must be assessed considering what is the study population and specially the amount of time spent under cART:
• 30% (Marchetti et al.,2008) • 10-25% (de Kivit et al., 2015) • 17% (Grabar et al.,2000) • 9%-45% (Rusconi et al.,2013) • 5-30% (Saison et al.,2014)
• 36% (Battegay et al.,2006;Kaufmann et al.,2005)
In 2009, Kelley et al. (2009) presented one of the most durable studies, in terms of time, regarding the immune response. They classified 366 virologically suppressed patients according to the CD4 count and they found that 25% of patients that began therapy between 100-200 cells/µL could be considered as “low immunological responders”. This figure increases to 44% for patients with a baseline < 100 cells/µL and it decreases to 5% for those starting therapy with CD4> 300 cells/µL.
2.4.5
Parameters associated with immunological response
to cART
Mechanisms underlying the immune recovery in HIV-infected patients upon long-term effective combined antiretroviral therapy remain elusive (Saison et al., 2014). Factors are only partly known and depend on both the host and the virus. Some of these factors linked to impairment of CD4+ T cells reconstitution
un-der cART are widely recognised, as baseline CD4 count, pre-therapy nadir CD4 count, age (consistent with the effect of age on thymic function), degree of viral suppression (possibly due to viral reservoirs) and especially when ini-tiation of cART during primary infection rather than later in chronic infection (Battegay et al.,2006;Mocroft et al.,2007;Egger et al.,2002;Kaufmann et al., 2005;Okoye and Picker,2013).
As for the drugs, cART intensification with Maraviroc in “low immunological responders” showed a slight increase of the CD4 count at week 12, which was not confirmed at week 48 (Rusconi et al.,2013). Also, a negative impact of the combination of tenofovir and didaonsine at high dose on the recovery of CD4+ T cells was observed (Karrer et al.,2005).
In the last years, other factors have been proposed as having also an im-pact on immunological response to cART, as microbial translocation (Marchetti et al.,2008), levels of T regulatory cells (Gaardbo et al.,2014;Saison et al.,2014) or levels of the CC chemokine macrophage inflammatory protein 1β (Prebensen et al., 2015).
Also, within this year 2015,Jarrin et al.(2015) found that optimal restora-tion after cART was significantly lower for patients having a rapid progression
of the infection before treatment, but these differences disappeared after ad-justing for baseline CD4 count. These results are in line with Kaufmann et al. (2005), when saying that long-term CD4+T cells changes during ART were not
associated with the natural course of CD4+T cells depletion in untreated
HIV-infected people before ART initiation. As another example of the variability of the considered factors, Allen et al.(2015) studied the association between the response to the Hepatitis B virus and CD4 gains during the first year of cART without conclusive results.
Chapter 3
Adjuvant interventions for
HIV: Immunotherapy
3.1
Immunotherapies
In the previous Chapter, we have talked about the “immunologial low respon-der” patients. Here, we focus on novel immune-based therapeutic approaches that may be necessary to restore immunocompetence in these individuals.
3.1.1
Adjuvant therapies for HIV
It is not certain that prolonged cART would succeed to eradicate the infection on the long term, despite the fact that cART can reduce plasma virus to unde-tectable levels relatively fast. The reason is that HIV can persist in the body in several cellular and anatomical reservoirs that are established early in the infection, and contribute to long-term persistence of the virus. One of these reservoirs comprises latent infected resting CD4+ T cells with a very long
half-life (about 4 years). At this rate, eradication of this reservoir has been estimated over 60 years of cART treatment (Finzi et al.,1999;Pierson et al.,2000).
The fact that antiviral therapy does not restore effective defenses capable of controlling HIV replication (Pantaleo and L´evy,2013) opens the way for comple-mentary therapies in the search of a functional cure and ultimately eradication of the HIV. In addition to the search for an effective vaccine, immune based in-terventions are being considered as a key factor in HIV therapy in recent years. Development of an immunotherapy able to restore an effective immune response could have a crucial role in the fight against the virus.
3.1.2
The role of cytokines
Understanding HIV-specific immunity and its failure is needed for the develop-ment of these immunotherapies, that may one day lead to immune control of HIV infection (Lange and Lederman,2003). Interleukins are part of the family of cytokines, that are communication tools between the lymphocytes for estab-lishing and coordinating an adequate immunological response. Immune cells
as well as other cells of the lymphoid organs send information about the infec-tion that will be received by cells having specific receptors. This is a complex process, where lymphocytes communicate through these interleukins for various purposes: they send signals for activating lymphocytes, stimulating production and proliferation of CD4+ T cells, and also for slowing cellular activity when
danger is finished, by means of apoptosis or controlled cellular death.
When HIV infects lymphocytes CD4, the homeostasis of the system is lost. Regulation mechanisms are disturbed, both at cellular and immune system lev-els. The number and function of CD4+T cells is seriously perturbed, and signals are incorrectly send and received. Infected CD4+ T cells continue to produce new virus, and the system is no longer able to preserve the equilibrium, leading to a progressively destruction.
Immune therapy is proposed as an adjuvant of antiretroviral therapy in order to help the immune system to regain control of the situation.
3.1.3
Interleukin 2 therapy
Interleukin 2 (IL-2) is known to have a decisive influence in immune responses and homeostasis. Before the appearance of the HIV, the in vitro T cell-stimulatory capacity of the Interleukin 2 had already been documented (Morgan et al.,1976). Its role in influencing various lymphocyte subsets, as the differentiation of CD4+ T cells into defined effector T cell (Boyman and Sprent,2012;Zhu et al.,2010) converted the Interleukin 2 into a powerful and promising candidate for im-munotherapy against the HIV virus.
First results showed that intermittent infusions of IL-2 produced substantial and sustained increases in CD4 count (Kovacs et al., 1995, 1996; Levy et al., 1999, 2012). For instance, Stellbrink et al. (2002) studied the effect of IL-2 on virus replication and reservoirs in 56 asymptomatic HIV-infected subjects with CD4 count>350 cells/µL. They found a CD4 count normalization in ∼90% of IL-2-treated patients whereas only ∼50% in cART-only subjects. Interestingly, they do not found an impact on virus production or latency. Also,Chun et al. (1999) noticed a reduction in the size of the pool of resting CD4+ T cells
con-taining HIV in the blood in patients receiving intermittent IL-2 in addition to cART.
Despite the demonstrated role of the IL-2 in regulating proliferation, differ-entiation and survival of T cells (Abrams et al., 2009), the clinical impact of CD4+ increase associated with its use still remained to be seen.
The question was answered in 2009, at the 16th Conference on Retroviruses and Opportunistic Infections (CROI) in Montreal, where Pr Yves Levy and Pr Marcelo Losso presented the primary results of two large clinical trials: SIL-CAAT (Levy et al.,2009b) and ESPRIT (Losso and Abrams,2009), respectively. These trials involved more than 5800 patients in the world, that were random-ized into two groups: those who received repeated injections of IL-2 associated to combined retroviral therapy and those who received cART alone. Despite the significantly increase of CD4 count shown in both cases, no differences were observed in terms of the risk of opportunistic diseases or death.
Initially, it was difficult to understand the reasons for this disappointing performance. Shortly after, Weiss et al. (2010) found that the principal effect of long-term IL-2 therapy was the expansion of CD4+CD25loCD127loFOXP3+ and CD4+CD25hiCD127loFOXP3hi T cells population, which are part of the
regulatory T cells. Tregs represent a regulatory subset within the CD4+lineage
involved in inhibiting the activation, proliferation and cytokine production of effector T cells (Okoye and Picker,2013). The increase in the subset of Tregs is today the most accepted hypothesis for the failure of the IL-2 therapy in HIV infection. However, such behavior can result in very promising results, since IL-2 is being used in autoimmune diseases (Rosenzwajg et al.,2015;Klatzmann and Abbas, 2015).
3.2
Endogenous Interleukin 7
3.2.1
Introduction
Interleukin 7 (IL-7) was firstly characterized in 1988 as a pre-B cell growth factor (Namen et al.,1988), and it has since found to be indispensable for T-cell development in humans. Now, it is known to play an essential role in both T-cell and B-cell maturation (Beq et al.,2004;Fry and Mackall,2002).
IL-7 is produced by stromal tissues and dendritic cells within the lymph node (Hofmeister et al., 1999; de Saint-Vis et al., 1998). The complete set of physiologic roles for this cytokine are still being elucidated, but we know the essential role of the IL-7 in enhancing both thymic-dependent and independent T-cell regeneration (Fry et al., 2001), proliferation (Vieira et al., 1998) and survival of mature cells (Vella et al.,1998;Seddon et al.,2003). SeeLundstr¨om et al. (2012) for a review of the evidence implicating IL-7 as an important modulator of peripheral T-cell homeostasis. More recently, Dooms (2013) set out two mechanisms of IL-7 promotion of naive T cells survival: inhibition of the mitochondrial death pathway and stimulation of glucose uptake and metabolism. IL-7 has been involved in the pathophysiology of a variety of diseases: Rheuma-toid arthritis (van Roon et al., 2005), systemic lupus erythematosus (Badot et al., 2012), type 1 diabetes (Harrison, 2012) or multiple sclerosis (Gregory et al., 2007). Some of the opportunities for clinical application of this cytokine are summarized inMackall et al.(2011).
3.2.2
Endogenous IL-7 in lymphopenia
Normal ranges for IL-7 oscillate from 0.3 to 8.4 pg/mL. Interestingly, there is a strong inverse correlation between IL-7 levels and CD4 count in HIV-infected patients (Fry et al.,2001). Actually, patients with a low CD4 count experience elevated circulating and tissue levels of IL-7, andLundstr¨om et al.(2012) showed that this increased IL-7 availability plays a major role in mediating the enhanced cycling of naive and memory T cells. Mastroianni et al. (2001) found that treated patients who responded to cART had IL-7 concentrations below the detection limit, while patients with evidence of cART failure had increased concentrations of IL-7 (comparable to those found in the untreated group with progressive disease). Hodge et al.(2011) established that increased levels of IL-7 during lymphopenia can be the consequence of a decreased receptor-mediated clearance of IL-7 as the availability of receptors diminishes.
Saidakova et al.(2014) divided 80 HIV infected patients into two groups, according to the level of immunological response after at least two years of cART. They found that the amount of IL-7 in blood plasma was significantly
lower in immunological low responders (< 350 cells/µL) than in patients with an adequate immunological response, pointing to the insufficient amount of this cytokine as a factor blocking the increase in the number of CD4+T cells during
cART. Also, the relative number of CD4+CD127+ T cells (expressing the IL-7
receptor) in low immunological responders was lower; thus, they concluded that these patients would have a deficiency of not only the amount of IL-7 but also of the number of cells producing a response to IL-7.
3.3
Exogenous IL-7 therapy
3.3.1
IL-7 in other diseases
Exogenous IL-7 has been evaluated as immunoadjuvant in a large number of illnesses in animals and humans for more than 20 years (Talmadge et al.,1993; Valenzona et al.,1998). IL-7 is currently being evaluated in the therapy of sepsis (Shindo et al., 2015), as well as in cancer (Sport`es et al., 2010; Fritzell et al., 2013) or in the context of stem cell transplantation (Perales et al.,2012), among others.
3.3.2
IL-7 therapy in HIV infection
The relationship between IL-7 and modulation of immune function in patients with lymphocyte depletion suggests potential usefulness of exogenous IL-7 in the framework of the HIV infection. As far as we know, in 2009 were presented the first trials studying the safety and efficacy of the administration of Recombinant Human IL-7 (r-hIL-7).
Sereti et al.(2009) conducted a consecutive dose escalation design in order to determine the effect of a single dose of non-glycosylated r-hIL-7. Participants were HIV-infected persons under cART with HIV-RNA under 50000 cp/mL and CD4 count over 100 cells/µL. They found demonstrable biologic activity since 3 µg/kg with a maximum tolerated dose of 30 µg/kg and the most notable side effects were injection site reactions, transient increases in plasma HIV-RNA levels and transient elevations of liver function tests. Despite an initial decrease in circulating CD4 count on days 1 and 2 after IL-7 administration (possibly due to a redistribution of cells out of the circulation), they observed next statistically significant increases in almost all measured CD4 subsets, especially in central memory CD4. They also found that naive and all memory and effector subsets were induced to enter cell cycle after the injection (measured thanks to the proliferation marker Ki67). Importantly, they did not observe changes in the proportion of CD4+ T cells with Treg phenotype.
Also in 2009,Levy et al.(2009a) presented another phase I/IIa trial, where the effect of 8 subcutaneous injections of non-glycosylated r-hIL-7 was evaluated. Here, participants were cART-treated HIV-infected patients with HIV-RNA un-der 50 cp/mL and CD4 count between 100 and 400 cells/µL. Patients received 3 or 10 µg/kg of r-hIL-7 every other day over 16 days. R-hIL-7 was well tolerated, with peaks of viral replication presented in 4 of the 7 patients in the highest dose group. As the main results, a sustained increase was observed in both naive and central memory CD4 subsets. Total CD4 count peaked at day 21 in both groups ,and the time to reach 500 cells/µL was equal to 7 days in average
in patients receiving IL-7 at 10 µg/kg doses. Also, the CD4+ T cells gain 3
months after the first injection was strongly correlated with the CD4 count at baseline. Analysis of Ki67 expression showed an increase of cycling cells in all subsets except terminally differentiated effector cells.
3.3.3
INSPIRE (1) study
Subsequent studies were realized with a new glycosylated r-hIL-7 (CYT107), having a longer half-life, and they were called INSPIRE studies. These studies were carried out by Cytheris S.A. (which no longer exists), a bio-pharmaceutical company focused on research and development of new immunotherapies. Data are now managed by Revimmune Inc., a development stage biotechnology com-pany that develops therapies for autoimmune diseases.
The first one was presented in Levy et al. (2012). INSPIRE (CYT-107-06) is a phase I/IIa randomized placebo controlled, single-blind multicenter dose-escalation study of subcutaneous intermittent r-hIL-7. Participants are chronically HIV-infected patients with CD4 count between 101-400 cells/µL and plasma HIV-RNA<50 copies/mL after at least 12 months of cART. This study provided information about 21 patients who received 3 weekly subcutaneous injections of r-hIL-7, at doses 10 µg/kg, 20 µg/kg or 30 µg/kg, plus two patients by dose level who were randomized to receive placebo (N=27). As the major findings, the maximal dose established as well tolerated was 20 µg/kg. This led to important dose-dependent increases in CD4 count, especially within naive and central memory subsets. CD4 count mean and percentage of CD4+Ki67+mean
by group are shown in Figures 3.1and3.2. No increase in Tregs was observed, and r-hIL-7 was contemplated as a real and powerful alternative to boost the immune system in cART-treated HIV-infected patients with inadequate immune response. The possibility of an intermittent therapy with repeated cycles of IL-7 in combination with cART was in the air.