BEHAVIOR OF TRACE ELEMENTS
IN ROCK WEATHERING AND SOIL FORMATION by
NICHOLAS MARTIN SHORT B.S., St. Louis University
(1951)
M.A., Washington University
(1954)
SUBMITTED IN PARTIAL FULFILLMENT OF THE REQUIREMENTS FOR THE
DEGREE OF DOCTOR OF PHILOSOPHY
at the
MASSACHUSETTS INSTITUTE OF TECHNOLOGY
FL
Q
MIT
LAW-June, 1958
- )
Signature of Author '
Dtpartment of -Geoogy arid Geophy-sics
19, 1958
Certified by ,...
-Thesis Supervisor Accepted by
irman, Departmental Committee on Graduate Students
BEHAVIOR OF TRACE ELEMENTS
IN ROCK WEATHERING AND SOIL FORMATION
by
Nicholas Martin Short
Submitted to the Department of Geology and Geophysics on May 13,
1958
in partial fulfillment of the requirements for the degree of Doctor ofPhilosophy.
ABSTRACT
The distribution within size fractions of the major elements Si, Al, Fe+3, Mg, Ca, Na, K, and Ti (as oxides) and the minor elements Ba, Co, Cr,
Cu, Ga, Mn, Ni, Pb, Sc, Sr, V, Zn, and Zr were studied within the soil and weathering products developed on 1) a granodiorite (Wyoming), 2) a basalt
(Colorado), 3) a granite (Missouri), and 4) a metamorphosed andesite (N. Carolina). Samples of parent rock and from every horizon in each soil
pro-file were taken.
Determinations of the particle size distribution and the mineralogy of the sand, silt, and clay fractions were made on each soil sample. Measure-ments of soil chemistry parameters, including %-H20, pH, Eh, soluble salts, % free iron oxide, organic matter content, and the cation exchange capacities
of the silt and clay fractions were made on most samples.
Element concentrations were determined by spectrochemical analysis using the mutual standard method. Analyses were made on each total bulk soil sample, and on sand, silt, and clay fractions separated from these samples. From some of the samples, analyses of elements removed by acetic acid leaching were ob-tained. The precision of the analyses was ±7.5% for a single set of spectro-graphic arcings but was ±28.0%l for arcings carried across several photospectro-graphic plates.
From the analysis results 1) concentrations corrected to constant A1203, 2) net changes in element concentration in the total soil, 3) weathering
indices, and
4)
concentration (relative enrichments) and distribution indices, have been computed. Variations in major and minor element content were re-lated to the particle size, mineralogy, and soil chemistry parameters by graphical and statistical methods. Several new methods were developed fortesting the degree of association between geochemically similar elements.
Interpretation of the data has led to these general conclusions:
1.) No consistent pattern of distribution of most major and minor ele-ments in either total bulk or size fraction samples is observed when analyses of the four soil suites are compared.
2.) The degree of enrichment or depletion for most trace elements in the four soils is directly proportional to the amount of clay and silt size
3.) The magnitude of concentration changes for both major and minor elements is largest between "unweathered" parent rock and the bottom soil
(C horizon) samples.
4.)
Similarity of behavior during the weathering process isdemon-strated for the element pairs: Al-Ga, Fe-Co, Fe-Mn, Fe-Ti, Fe-V, and Mg-Sc. Less definite associations are noted, both in the total soil and in size fractions, for the pairs: Fe-Cu, Fe-Cr, Mg-Cu, Ca-Sr, K-Ba, and K-Pb.
5.)
The soil B horizon is usually the zone of maximum enrichment for the elements Co, Cr, Cu, Mn, Ni, Sc, Ti, and V; other minor elements have a more variable distribution.6.) The sand and/or silt fractions often show enrichments of certain elements which are concentrated in unweathered or resistate minerals. The
clay fraction may be enriched in elements which show depletion in the sand or silt fractions. Variations of enrichment in the clay fraction are less than in total soil or other size fractions because of the predominance of one or more clay minerals.
7.) Concentration changes of certain elements can be related to survival or destruction of minerals from the parent rock only when large sample to sample variations are detected in the sand or clay fractions.
8.) No clear-cut relation between minor element variations and pH, Eh, or free iron oxide values throughout a profile has been found in any of the four soils.
9.) The largest (leachable) amounts of an element available to plants occurs for most elements in the B horizon.
10.) Adsorption (cation exchange) is an important factor in controlling
the leach extract composition but appears to have little influence on the trace element distribution in the total bulk soil.
11.) Possible association of such elements as Cr, Cu, Ni, Pb, and V with organic matter is indicated only in the A horizon samples in which the organic matter content exceeds 2% in all four soils.
12.) Climate appears to be more important than parent rock composition in affecting the pattern of trace element variations.
13.) It may be possible to deduce the chemical composition of an unsampled parent rock from the soil concentration of such indicator elements as Si, Fe, Cu, Sc, V, and Zr.
Thesis Supervisor: William H. Dennen Title: Associate Professor
ACKNOWLEDGEMENTS
I would especially like to express my gratitude to my thesis supervisor,
Dr. William H. Dennen, for his advice and aid in several phases of this
thesis. I wish also to extend thanks to my thesis advisers, Dr. Ely Mencher, Dr. John Winchester, and Dr. Robert R. Shrock, for their many helpful sugges-tions.
I am grateful to the many others who have made contributions to the thesis. Specific mention and sincere thanks are due to:
Mr. William Grundmann for capable assistance during the sample
collect-ing trip through the Rocky Mountains.
Dr. R. T. Martin, Soils Stabilization Lab, M.I.T., for his cooperation in providing facilities and suggestions for the soils chemistry tests and in serving as an ex officio member of my thesis committee.
Dr. Robert Ogilvie, Metallurgy Department, M.I.T., for guidance in the use of x-ray facilities.
Dr. William Johns and his assistant, Mr. Rodney Tettenhorst, Depart-ment of Geology, Washington University in St. Louis, for their aid in
checking and interpreting the x-ray data.
Dr. Neil Shimp, Spectrographer at the Department of Soils, Rutgers University in 1956, for his generous cooperation in running spectrochemical
analyses of several of my samples.
Mr. Erwin Strahl and his group at the Department of Mineralogy, Penn-sylvania State University, for providing an invaluable cross-check of my
data by carrying out chemical and x-ray fluorescence analyses of several selected samples.
Dr. E. E. Pickett, Department of Agricultural Chemistry, University of Missouri, for providing flame photometer analyses of sodium and potas-sium in these same samples.
The State Soil Scientists of Colorado, Missouri, North Carolina, and Wyoming for soils information relating to the sample sites.
The Department of Geology, Washington University, for permission to use its laboratory facilities during the summers of
1955,
1956,
and1957.
Personnel of the Geology and Geochemistry Division at the Gulf Research and Development Company, Pittsburgh, Pennsylvania, for assistance in the heavy minerals, redox potential, D.T.A., and x-ray studies, and for numerous
suggestions relating to the preparation of this manuscript.
The secretarial staff at Gulf Research, for the typing of this thesis. Mr. Paul Fiehler and Miss Theresa Provenzo of the Gulf Research Labora-tories, for the final preparation of all figures and illustrations.
TABLE OF CONTENTS
ABSTRACT . . . . . . . . . . . .
ACKNOWLEDGEMENTS . . . .
INTRODUCTION . * . . . . . . .
GENERAL SUMMARY OF RESULTS AND CONCLUSIONS
SURVEY OF PREVIOUS WORK. . . . . . . LOCATION AND SELECTION OF SOIL SAMPLE SITES DESCRIPTION OF SOIL PROFILES . . . . . SOIL PARTICLE SIZE ANALYSIS . . . . .
I. Methods. . . . . . . . . . II. Discussion and Interpretation .
A. General . . . . . . . . B. Specific . . . . . . . PARENT ROCK MINERALOGY . . . . . SOIL NINERALOGY . . . . .
1. Introduction . . . . . . . . II. Sand Fraction . . . . . .
III. Silt and Clay Fractions . . . . IV. Heavy Minerals Fraction . . . SOIL CHEMISTRY. . . . . . . .
I. General . . . . . . . . . II. Specific Features . . . . .
. . 0 . . . . . . 2 . . . 0 . . . .0
.
4
. . . 13 . . . . . . . . . . 18 . . . . . . . . . . 22 S . . . . . . . . . 25 . . . . . . . . . . 37 . . . - - - - .0 - 37 . . . . . . . . . . 43 . . . . . . - -. . . . . . . . . . . . .0 . . . . . . . . - - - . . . . .0 - 43 - 44. 48
. 50
-50
S . . . . . . . . . 56 . . . 0 . . 0 . 0 . 63 . . 0 . . . . ..
64
.
64
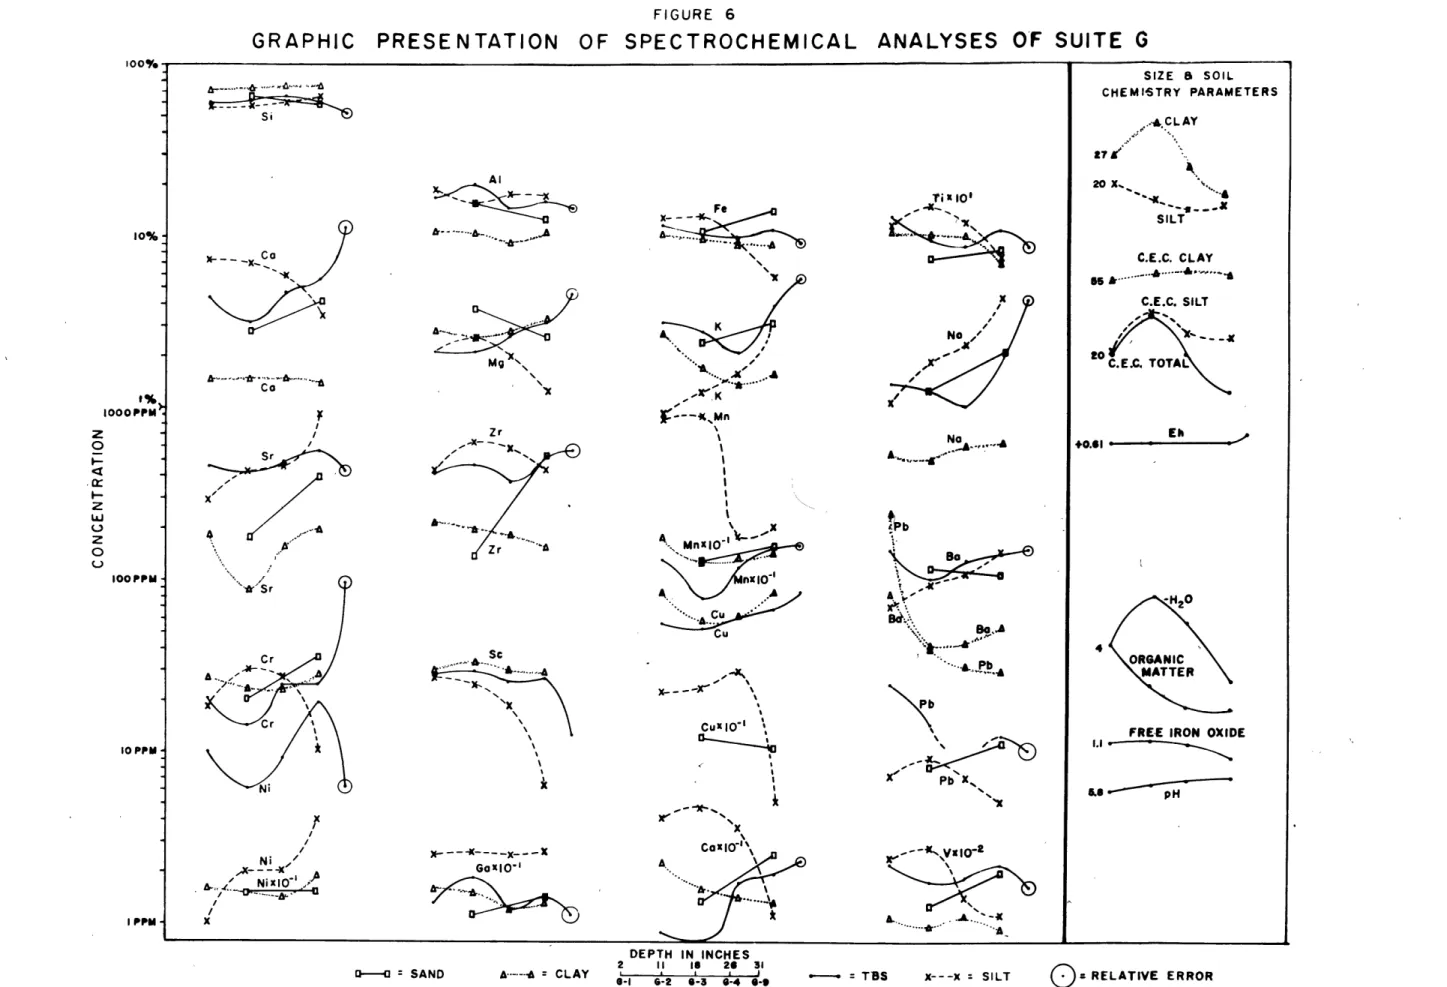
. . . 0 . . . . . . 66SPECTROCHEMICAL ANALYSES . . . .. . . .. . . . . PRESENTATION OF ANALYSIS DATA . . . .
INTERPRETATIONS OF DATA
I. Introduction . . . . II. Methods of Interpretation . . . .
A. Absolute Chemical Changes and Relative Gains and Losses
B. Distribution and Concentration Indices . . . .
C. Weathering Potential Index and Weathering Index
D. Relative Geochemical Associations . . . .
E. Observed Geochemical Associations and Correlation
Coefficients . . . . . . . . . . . .
F. Correlations Between Chemical and Several Soil
Chemistry Variations . . . . G. Percent Leachable Element . . . . * . .
H. Trace Element Content of Minerals and Rocks . III. Specific Interpretations . . . .
A. Element Behavior Characteristics Common to the Four
B. Pattern of Element Behavior in Each Soil Suite . . C. Behavior of Individual Elements . . . . .
CONCLUSIONS AND RECOIMENDATIONS . . . .
. . . 90 * 0 . 99 . . .101 . . .108 . . .111 . . . 111 . . . 11!{ . . . 115 Soils . 115 . . .117 . . .135 . . 149 APPENDICES SOIL CHEMISTRY . . . .153 I. Methods . . . 153 * 69 . 71 . 81 . 81 . 81 . 81 Appendix A
Appendix
B SPECTROCHEMICAL ANALYSIS . . .. .. ..
I. Introduction . . . . . * . . . . . II. Choice of Specific Method . . . . . . .
III. Choice of Elements Sought . . . . . . .
IV. Preparation of Samples for Analysis . . . .
V. Spectrographic Conditions and Procedures . .
VI. Standardization . . . . . . . . . .
VII. Methods of Calculation . . . . . . . .
C REPRODUCIBILITY OF THE SPECTROCHEMICAL ANALYSES . .
I. Precision . . . . A. Intraplate Precision . . . . . . . B. Interplate Precision . . . . . . . 1. Duplicate Analyses. . . . . . . 2. G-1:W-1 Replicate Analyses . . . . 3. Concentration Indices . . . . . . II. Accuracy . . . . . . . . . . . . .
A. Chemical versus Spectrochemical Analyses of Selected Rocks . . . . . . . . .
B. Penn State Analyses . . . . . . . .
C. Rutgers Analyses . . . . . . . .
D. Wet Chemical Analyses . . . . . . .
E. Flame Photometer Analyses . . . . .
III. Major Sources of Error . . . . . . . . D RULES FOR INTERPRETATION OF ASSOCIATION ANALYSES . . E THEORETICAL BACKGROUND FOR TRACE ELEMENT BEHAVIOR DURING
WEATHERING. . . . . . . . . . . . . . . . . . 159 . . . 159 . . . 160 . . . 162 . . . 166 . . . 168 . . . 171 . . . 175 . . . 178 . . . 178 . . . 178 . . . 180 . . . 181 . . . 181 . . . 186 . . . 186 . . . 188 . . . 190 . . . 191 . . . 191 . . . 191 . . . 194 . . . 196 . . o 197
BIBLIOGRAPHY . . . 212
BIOGRAPHY . . . .218
TABLES
Description of Soil Profile . . . . List of Abbreviations Used in Soil Descriptions .
Soil Description: SuiteG. . . . .
Soil Description: Suite K . . . .
Soil Description: Suite N . . . .
Soil Description: Suite S. . . . . Soil Particle Size Data . . . . Size Data According to Bureau of Soils Classification
Parent Rock Mineral Composition . . . .
Sand Fraction Mineral Composition . . . . Clay-Size Minerals Identified by X-ray Analysis Heavy Minerals Composition . . . .
Soil Chemistry Values . . . . Spectrographic Conditions . . . . Spectrochemical Analyses of Suite G . . . Spectrochemical Analyses of Suite K . . . Spectrochemical Analyses of Suite N . .
Spectrochemical Analyses of Suite S . . .
Concentrations Relative to Constant A1203: Suite G
Concentrations Relative to Constant A1203: Suite K Concentrations Relative to Constant A1203: Suite N Concentrations Relative to Constant A1203: Suite S
* 0 * . * * * * * 0 * 0 * 0 * 0 * 0 * 0 0 0 0 Table 1 2 A-D 2 A 2 B 2 C 2 D 3 14 . . . 26 . . . 28 . . . 29 . . . 31 . . . 33 S. .35 . . . 38 . . 0 39 . . . 49 S. .52 S0 .57 . . . 63 . . .65 . . . 70 . . . 72 . 0 . 73 . 0 . 74 S. .75 S. .85 . . . 86 . . . 87 . . . 88 6 7 8 9 10 11 A 11 B 11 C 11 D 12 A 12 B 12 C 12 D
Average Net Change for Total Soil: Suites G, K, N, and S . . . 89
Distribution and Concentration Indices: Suite G . . . 92
Distribution and Concentration Indices: Suite K . . . . 93
Distribution Indices: Suite N . . .
94
Distribution and Concentration Indices:.Suite S . . . .95
Weathering Potential Index and Weathering Index Values . . . 100
Relative Geochemical Associations: Suite G . . . 102
Relative Geochemical Associations: Suite K . . . 103
Relative Geochemical Associations: Suite N . . . 104
Relative Geochemical Associations: Suite S . . . 105
Correlation Coefficients Calculated for Selected Element Pairs. . . . .110
Percent Leachable Element . . . .113
Data from Swaine (1955) on Trace Element Content in Soils . . 136
Wave Lengths and Excitation Conditions of Analyses Lines . . .
165
Element Concentrations of Spectrographic Standards , . . . . 174
Relative Error (%): Intraplate Precision . . . 179
Duplicate Analyses: K-TBS . . . . . . 182
Duplicate Analyses: G-TBS . . . . 183
Duplicate Analyses: K-Clay and Parent Rock . . . 184
Means, Standard Deviations, and Relative Errors of Slope Angle and Mid-point Values of G-l:W-1 Working Curves . . . . 185
Statistical Treatment of Concentration Index Data . . . 187
Larsen & Gonyer - Dennen - Short Analyses of Selected Rocks . . 189
Pennsylvania State Analyses of Soil Samples . . . . 190 Table
Table
28 A Rutgers Analyses of TBS Samples . . . .192 28 B Rutgers Analyses of Clay Samples. . . . 193
29 Wet Chemical and Flame Photometer Analyses of
Soil Samples . . . .191 &
194
FIGURES Figure
1 A-D Histograms Showing Particle Size Distribution . . .
40
2 Cumulative Curves of Size Distribution .4 . . . h13 Triangle Diagrams of Size Variations . . . .42 4 X-ray Diffractometer Patterns . . . . .58
5 D.T.A. Curves . . . . 59
6 Graphic Presentation of Spectrochemical Analyses of Suite G . 76
7 Graphic Presentation of Spectrochemical Analyses of Suite K . 77 8 Graphic Presentation of Spectrochemical Analyses of Suite N . 78
9 Graphic Presentation of Spectrochemical Analyses of Suite S . 79 10 Graphic Presentation of Spectrochemical Analyses of Acetic
Acid Leachates . . . . . . . . . 80 11 Explanation of Symbols . . . 96
11 Symbolic Representation of Distribution Index Variation
Over a Profile . . . . . . . . . * * * . . . . 97
12 Symbolic Representation of Relative Geochemical
INTRODUCTION
Geochemical studies of the occurrence and distribution of the minor or trace elements in rock systems have concentrated primarily on igneous rocks, ore deposits, and agricultural topsoils. In recent years the ap-plication of optical and mass spectrographic methods of analyses for groups
of elements in rocks and minerals has provided considerable data regarding the role of trace elements in geologic processes. However, there are
still few detailed investigations of the collective behavior of both major and minor elements during a geochemical process involving notable changes in concentrations and in chemical environnient.
One aspect of geochemistry that stands in need of much further study is the process of weathering and rock decomposition. Specifically, atten-tion should be given in future studies to such basic problems as 1) the detailed mechanisms of weathering, 2) the energies and thermodynamics in-volved in weathering, 3) equilibria and phase relationships, 4) the
mobilities of elemental components,
5)
the exact processes leading to enrichments and depletions of elements, 6) the identification of stagesof weathering, and 7) the systematic classification of weathering processes and products.
Trace elements can be particularly useful in solving some of these problems. Trace elements serve as sensitive guides or "tracers" for the
geochemical changes that are active during weathering because they are present in small but highly varying amounts while at the same time they
follow or "mirror" the behavior of their correlative major elements. For
example, a concentration change of 150 to 10 ppm (15x) for a particular minor element magnifies by ten-fold an associated change from
15
to 10%(1.5x)
for a geochemically similar major element.The few previous studies of trace element behavior in rock weathering have been limited insofar as they have not attempted to integrate major and minor element variations with such parameters as parent rock composition, the physical and geochemical environment, the distribution of elements among phases, and the physical, chemical, and mineralogical character of the
weathered products during all stages of transformation from unaltered rock
to an "old-age" soil.
It is the objective of this thesis to examine the minor element
geo-chemistry of the rock weathering and pedological processes from the
view-point of relating the concentration changes of selected trace elements to changes of the major elements found in the soils and to the above-mentioned dynamic parameters. Indirectly also, this investigation provides information which suggests at least partial answers to some of the basic problems of weathering enumerated in a preceding paragraph.
The method of investigation is comprised of a systematic analysis of four virgin soil profiles collected from various parts of the United States, All profiles extend into unweathered parent rock and hence cover a broad range of rock decomposition. Each profile was studied in detail in terms of its physical character, particle size distribution, mineralogy, soils chemis-try, and stages of weathering. Major and minor element variations within each profile were obtained from the determination by means of emission spec-trographic analysis of concentrations in representative samples taken from different horizons. These concentration changes were then related to the dynamic parameters by various interpretative devices.
GENERAL SUMMARY OF RESULTS AND CONCLUSIONS
The principal observations, interpretations, and conclusions resulting from this investigation of chemical weathering are presented below both as a preview and a summary of the main points developed in the thesis.
1.) Spectrochemical analysis has proved effective in detecting and ana-lyzing quantitatively 21 elements. Relative compositional changes in a sample series were determined with very good precision (+ 7.5%); absolute amounts in these samples were not determined with high accuracy.
2.) The apparent net gain or loss in concentrations with respect to parent rock composition of 20 elements in each soil is indicated below by + or
-symbols for the four soil suites studied. The geographic location, parent rock type, and soils group classification for each soil is shown in parenthe-sis beneath the suite's locality letter.
Suite G: (Colo; basalt-brown aridici Suite K. (Wyo; grano-diorite; acid prairie) Suite N: (Missouri; granite; gray-brown podzol) Suite S: (N.C.; metam. andesite; red-yellow podzol) Si Al Fe Mg Ca K Na Ti Ba Co Cr Cu Ga Mn Ni Pb Sc + + + - -- - + - - -- + - + + + Sr V Zr + + -- + + +--- --- + + + - - + + + - + + + - + + - - - + + + +I + - + + + + + + + + - + - --- + + + + + - - + ? + .- ++
3.) The parameter which most consistently correlates with enrichments and depletions of minor elements is the percentage of clay-sized particles. Clay percent can be taken as an indicator of the degree of weathering.
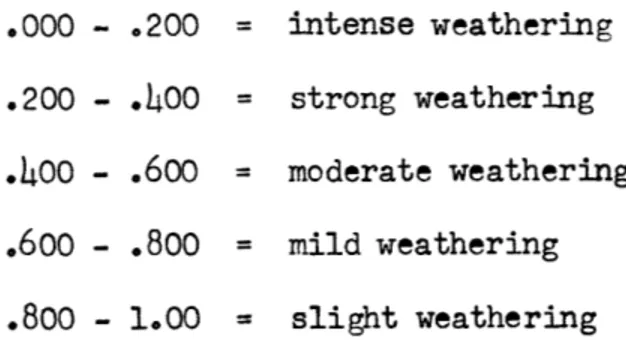
h.) A weathering index, based on the ratio: 100 x mols(Ca + Mg + Na + K mols (Si +Al +Fe +Ti) (as oxides), also provides a measure of the extent of weathering and simi-larly can be correlated with variations in minor element concentrations.
5.)
Because of losses during separation and also poor interplate pre-cision during spectrographic analyses of different sample categories, it has proved impossible to achieve a "materials balance" for the various soil size fractions, i.e., the weighted sum of the analyses of these several fractions did not usually equal (within the tolerated experimental error) the analysisof the total (undivided) soil.
6.) Despite the errors affecting the analyses of the size fractions, the general patterns of relative concentration changes between fractions and of variations within fractions can be defined for most of the elements in the four suites. Enrichments in the clay fraction have not been as large as expected and variations within this fraction are less than in the total soil, sand, or silt fractions. The sand and/or silt fractions often show enrichments of certain elements which are concentrated in unweathered or resistate minerals. In some instances, the cause(s) of several element con-centrations in one or more size fractions have not been satisfactorily
explained. Certain elements which are supposed to show similar geochemical behavior do not alsays associate in the same manner or degree in these size fractions.
7.) Relationships between chemical and mineralogical changes were noted in all four soils. Striking changes were found when several minerals
underwent rapid destruction during early stages of weathering. Enrichment of certain elements could be tied to survival of such minerals as the micas, magnetite, augite, and several accessories. Concentration changes reLated to development of identified secondary minerals (clay minerals, etc.) and colloidal material were not convincingly demonstrated.
8.) Associations of such parameters as cation exchange capacity, organic matter content, and free iron oxide with concentration variations could some-times be established for individual elements in one or more profiles; however, direct control of the majority of the variation of an element by any of these parameters was not demonstrated.
9.) No clear-cut relation between minor element variations and pH or Eh was found. Eh and free iron oxide variations broadly coincided. A few minor ferride elements sometimes appeared to be influenced by these
varia-tions. Knowledge of pH and Eh values for a soil permits the probable ionic state of an element in the solution or in exchange positions to be predicted.
10.) The largest amounts of an element available to plants (maximum per-cent leachable by acetic acid) was determined for most elements to occur in the B horizon. A general positive correlation between leachable amount of an element and the degree of weathering was found; migrations of soluble ele-ments to the B horizon layers may distort this relationship.
11.) Most of the minor elements tend to concentrate in the B horizon by precipitation or fixation on surfaces from downward moving soil solutions, although there are many individual exceptions due to such factors as caliche formation, concentration in organic matter, survival in resistate minerals, etc.
12.) The most pronounced chemical changes occur during the weathering of parent rock to C horizon soil.
13.) Observations by others of similarities of behavior in a geochemical system were confirmed for the weathering process for the element pairs: Al-Ga, Fe-Co, Fe-Mn, Fe-Ti, Fe-V, and Mg-Sc. Several other associations, namely between Fe-Cu, Fe-Cr, Mg-Cu, Ca-Sr, K-Ba, and K-Pb, were positive in
some of the soils and indefinite or negative in the others. Associations between the above pairs in the several size fractions in a given soil were often both positive and negative; in some cases this is explained as due to selective concentration of one element with respect to the other or to the relative distribution of the two elements among several phases undergoing different degrees of decomposition or formation; in other cases, such oppos-ing associations appear to be contradictory.
14.) The effect of climate differences (especially in rainfall) on the pattern of minor element variations appears to be more influential than the
effect of initial parent rock composition.
15.)
It is possible to roughly estimate the nature and chemical composi-tion of the parent rock from the reported analysis of a soil alone. Si, Fe, Cu, Sc, V, and Zr are the most sensitive elements for this purpose.16.) The geochemical variations of both major and minor elements within a soil profile are largely functions of 1) the degree of decomposition of the primary host minerals, 2) the relative proportions of the more resistant minerals which accumulate in the soil, 3) the amounts which can be accepted in secondary mineral structures, 4) the oxidation states of the released elements, and
5)
the degree of leaching by natural solvents of the fractionof any element occupying exchange positions on mineral surfaces or held in readily soluble colloidal matter.
SURVEY OF PREVIOUS WORK
The problem of trace element behavior in chemical weathering processes
has not yet received much attention from geochemists. In contrast, the pedologists have made thousands of surveys of the occurrence and distribu-tion of individual or groups of trace elements in the strictly soil pordistribu-tion of the weathered mantle.
The principles of trace element occurrence and distribution in rocks have come primarily from studies of igneous rocks. The classic work on the Skaergaard intrusion of East Greenland (Wager and Deer, 1939) later led to a detailed determination by Wager and Mitchell (1951) of the distribution of trace elements in the intrusive differentiates. An earlier study, indicat-ing major and minor element relationships, was made on some Caledonide
plutonics by Nockolds and Mitchell (1948). An investigation of trace element distribution in Hawaiian lavas was carried out by Wager and Mitchell (1953). Sandell and Goldich's studies (1943) and Fairbairn, Ahrens, and Gorfinkles' work on the Ontario diabase (1953) should also be mentioned.
Even before these contributions, V. M. Goldschmidt had evolved and de-fined many of the basic principles of chemical element distribution in the earth's crust (1937, 1945).
There have been few comprehensive studies of trace element distribution in sedimentary rocks (see Krauskopf, 1955). Oil companies have recently in-vestigated trace elements in sedimentary rocks and are only now publishing
results. The search for uranium has also given impetus to such trace element work. Trace element behavior during metamorphism of shales has been treated by Shaw (1954-55).
Trace element studies in soils have been largely confined to certain elements (B, Cr, Co, Cu, Mo, Ni, Se, V, and Zn) of agricultural and biologi-cal importance. Usually only the topsoil or zone of tilth receives detailed attention. Commonly only a single minor element is studied at one time in relation to its distribution in different soil types. Many routine analyses have been published by the U. S. Department of Agriculture (e.g.: Slater,
Holmes, and Byers, 1937). Soils scientists at many University Agronomy De-partments and State Agricultural Surveys (e.g.: Allison and Gaddum, 1940) have added valuable information. In foreign endeavors, the English,
Rus-sians, Indians, and Japanese have been chief contributors to trace element knowledge.
R. L. Mitchell of the Macaulay Institute in Scotland is well known for his contributions to the field of trace element distribution in rocks and
soils (1946, 1947, 1948, 1955, et al.). The Russian, A. P. Vinogradov, has written an imortant treatise (1950) on the principles of minor element
dis-tribution in soil systems. In 1955, D. J. Swaine published a much needed
bibliography of all world-wide publications on trace elements in soils to that date, together with an annotated summary of information available for each of 4 minor elements.
Detailed studies of trace element distribution over the entire soil profile are uncommon and studies from the viewpoint of weathering processes, major-minor element relationships, mineralogical changes, and thermodynamics are rare indeed.
Most of the direct determinations of element distribution in the profile have been made during the recent upsurge of geochemistry in the
1950's.
Gordon and Murata (1952) of the U.S.G.S. studied the behavior of minor ele-ments during the weathering of nepheline sysnites to residual bauxites. An
important contribution has been made by J. R. Butler (1954-55) of Rothham-sted Experimental Station, England. Butler investigated selected groups of trace elements in soils derived from a variety of parent rocks collected in Lancashire and the Caledonides of Norway. His study embraced both major and
minor element determinations and soils mineralogy. The trace element
analy-ses were limited, however, to topsoil and parent rock and do not therefore
include a complete picture of profile changes. Yamasaki, Iida, and Yokoi
(1955)
of Nagoya University in Japan conducted a similar survey ofgranodio-rite and its weathering products. The Canadians, Wright, Levick, and
Atkinson (1955) examined the trace element distribution in virgin profiles
taken from four great soil groups. Drs. N. Shimp and J. Connors of Rutgers
have published (1957) results of perhaps the most thorough study up to that
date. A total soil and a clay fraction sample from the A, B, and C horizons from six New Jersey soils of heterogenous parentage were analyzed for con-tent of h major and 10 minor elements. From the resulting data concentra-tion and distribuconcentra-tion ratios of these elements were calculated. Some
correlation with other soils properties was included.
In regard to providing data illuminating the principles of trace
element behavior in weathering processes, all such previous work has been hindered by limitations in scope. These include:
1.) Generally few minor elements are determined.
2.) Specific correlations of minor-major element pairs and groups is not always made.
21
3.) Some of the profile horizons are not analyzed. h.) The parent rock is usually not sampled.
5.)
The parent rock is often of secondary origin. 6.) The soil usually is not residual.7.) The pin-pointing of trace elements within phases or size fractions is not commonly attempted.
8.) Supporting data characterizing the soils (mineralogy, size
distribution, soils chemistry) is not determined.
9.) The initial and early stages of weathering (reactions within
and adjacent to the parent rock) are seldom considered.
In recognition of these omissions in previous studies, the plan of this thesis investigation has been designed to avoid some of these limitations.
LOCATION AND SELECTION
OF SOIL SAMPLE SITES
Eighteen soil suites were sampled during the collecting trips of June and September,
1955
but time, cost of analysis, and uncertainties as to re-sidual origin led to the elimination of all except four of these from thefinal investigation.
All soil sites were selected primarily from the geological rather than pedological standpoint, that is, with the objective of showing principles and phenomena of weathering and rock decomposition rather than soil-forming processes. Three specific restrictions governed the choice of the soil pro-file sites:
1.) The parent rock must be of igneous origin (or, if metamorphic,
of igneous derivation).
2.) The developed profile must be residual.
BE
3.) The profile must thin enough to be sampled with simple field tools. Two other factors were kept in mind in selecting the sample sites. The first was to use soils from a variety of rock types, if possible showing ex-tremes in compositional range. The second was to obtain soils developed under several different climates. These factors provide additional variables which, when determined, aid in the correlation of the chemical changes with their
various causes.
On the basis of these conditions of sample selection, the final sites
were taken either from flat uplands within or adjacent to more rugged
topog-raphy or from low elevation hills and dissected plains. A soil originating
a soil derived from a basalt flow was collected near Denver, Colorado; a
soil with a granite parent rock was sampled in the Missouri Ozarks near the
village of Graniteville; and a soil developed on a metamorphosed andesite
was collected in the Appalachian Piedmont near Asheboro, North Carolina. During field work criteria were set up to distinguish residual from transported or secondary soils. Those favoring a residual history include:
1.) Development on gentle slopes without indication of slumping. 2.) General continuity of parent rock type (i.e., immediate locality
consisted of dominantly uniform lithologic type).
3.) Outcrops of similar parent rock exposed within 100 feet of sample site.
4.) No glacial or alluvial deposits evident in near vicinity.
5.)
Absence of rock rubble different from presumed parent rock,either on ground surface or within the profile as sampled (the presence of gravel like that of the parent rock is strong evidence of a residual nature).
6.) Relict texture (inherited from the parent rock) persisting through the soil profile.
7.) No abnormal soil horizons noted within the profile on exposure. In addition, supplementary evidence supporting a residual origin for each of the four suites was provided later during laboratory analysis. Such features as relation and continuity of heavy minerals or index minerals with respect to parent rock and correlation of overall soils chemical composition to parent rock composition helped confirm the residual identifications.
An ideal sample site was one with only enough vegetative cover to
examined prior to sampling to give a picture of a profile's suitability.
Soils experts were consulted during the collecting trips in Colorado,
Mis-souri, and Georgia for their opinions as to favorable soil sites.
The actual sample face was exposed in one of two ways. In Colorado, Wyoming, and Missouri (in part) test pits, roughly 2 x
5
feet in plan, weredug to decomposed bedrock. Digging difficulties prevented penetration to unaltered parent rock. In North Carolina, where the soil was too thick to be dug through, samples were collected from a stream gully adjacent to a
road cut.
The sampling pattern depended on the appearance of the exposed profile. The pattern was chosen in accord with visual identification and separation of soil horizons on the basis of differences in color, texture, s'tructure, or any other distinguishing features. At least one sample from the A, B, and C horizons, plus parent rock, was always taken. If a horizon was thicker than 8 inches, two or more samples were taken 6 inches or more apart. The sample point was actually a small zone, 2 to 3 inches in diameter and h to 6
inchee in depth, within a horizon exposed on one face of the pit or cut; hence a given sample represents the average of soil variations within a small volume.
Each sample was removed with a metal trowel. Care was taken to make the sample representative by taking a large total amount (t 800 grams). After re-moval each sample was placed in a plastic bag and then in a labeled cardboard carton. Neither bag nor carton was sealed; thus the moisture content could change after collection.
No field measurements were made of such soil properties as moisture, pH, redox potentials, or bulk density. Minor contamination could have been pro-duced by metal from the trowel, shovel, or pick, or by soil droppings from the surface or pit face.
DESCRIPTION OF SOIL PROFILES
The sample site for each of the h soil suites will be described in relation to 1) its specific location, 2) local physiography, 3) drainage,
4)
pertinent climatic data,5)
associated vegetation, 6) regional and/or local geology (including immediate parent rock), 7) general soil description, 8) profile description, and 9) soil classification. The first six categor-ies are summarized in Table 1. The slope classification and drainage class terminologies have been defined in the U.S.D.A. Soil Survey Manual (1951, pp. 160-63 and 169-72 respectively). Categories 7 and 8 are discussed onthe following pages. Following each profile description is a statement of the probable soils group and soil type to which the suite has been correlated. Some of this information has been provided by state soils scientists; the re-mainder was obtained by consulting soils maps and soil survey descriptions published by the U.S.D.A. Bureau of Soils.
Each profile has been described according to the format and nomencla-ture recommended by the U. S. Department of Agriculnomencla-ture (see Soil Survey Manual,
1951,
pp. 173-234). The color, texture, structure, and consistency were qualitatively appraised in the field and wherever possible revised andrenamed later after laboratory studies. This information, together with horizon designations,1 depth from surface to base of horizons, thicknesses,
SIn this thesis, the C horizon (within the actual soil profile) is con-sidered to be the disintegrated and superficially weathered parent rock rubble in which minor amounts of silt and clay particles may be admixed whereas the D horizon (sampled from the nearest exposed outcrop) is defined as the much less altered and more coherent parent rock.
±AB3LE 1
Descriptions of Soil Profiles
Suite Location Local Physioeraphy Drainage Climate Vegetation Geoloey
North Table htn: 1 North Table htn flat Class 3, moderate to Semi-arid. Nearby Grass and weed Adjacent to Col. Front
1/2 m. NNE of Golden, mesa, 1 1/2-2 m. long; well drained; mesa Denver: ann. ppt. covered; trees Ringe; N. Table )'tn con-Colo; in Sec. 22, T elv. ± 6500 ft; 400-500 drained by small, 13.4 in.; mean ann. and bushes scarce; sists of 2 late Tertiary
G 3 S, R 70 W (of oth ft above Golden. Mesa short usually dry mas- T 50.50 F. cattle-grazed. basalt flows 1 50 ft princ. meridian); relief: 40-50 ft; Class ter stream flowing SE thick; intbd w. alluvial about 500 ft SE of B complex slope; 1-5* & several guflied tri- fan deposits. Basalt
trap quarry and 300 grade; no 5lacial con- butaries. Local perch- augite t- plag.,
ft E of mesa rim. tamination. ed water table. spar; numerous vesiculcs
mes;filled i. zeolites.
Northern Bighorn Ntris Locally: eently rolling Class 4, well drained; Data for irmied. area Short grass &Precamb. igneous bana~s
28 m. (air) W of Sher- meadows; relief 50-100 ft; internal drainage ex- unavailable; locally wild flowers; f ew trendi-ng NNW; Carib.
sed-iian, '~yom.; 150 ft irregular ridees of barren ceeds surface runoff semi-humid, mountain- trees or busnes; ims. 1 M. to W. o[tes
above & 600 ft NE of rock, relief 100-300 ft; local reion drained ous climate; Sheridan so0-0 nearby roves 1. Noral Red Granite
U.S I-iwy 1, .1 . lev 'teaer ha 750 y Owen Creek, flowing to E is semti-arid, w. & patches of pines (±10" blot; plae.)
U.S.Hiwy 14 2. m ele: 40-50e ft;~ Class 11
S of with Bunction ft; Class B & C complex N to S. Fork of Tongue ann. ppt. 15.1 in.; & aspen. 2. Binary granite peg-Wyon. Hiway 14; in slope; 1-10* grade; some River. mean ann. T =43.1* F. matite (in dike-like
T 55 N, R 88 W. tlacial wash in vicinity bans 10-50 ft wide)
3. Binary granite apilite.
15 ft E of vertical E Exhumed Precamib. granite Class 3, moderate to Area in humid-temper- Hills forest-coy- Nassive binary red !ram-face of quarry 150 ft hills; hills elongate; well drained; local ate zone; Ann. ppt. ered; imie-iiate ite (Precanb), contains E of Mo. H1iway 21; elev; ± 1300 ft; relief intermaittent sprearis; 42-46 in.; rican ann. site grass-free, several types of feldspars; 0.8 m. NNd of Post Of- 500 ft; valleys underlain small, usally dry mlrtical T 50-51 F.; av. low weed-covered; oaks, jointin,
wath-S fice, Graniteville,, by Canib. sst & dolo.; im- stream 200 ft W of =230 F.; av. high walnut trees mod- ers to pronounced
sc:her-Nlisscuri; in SW 1/4 mediate relief 30-50 ft; quarry; internal drain- 91* F. erately iense, con- cidal loulders; rhyvolite
SW 1/4 See. -1, T 3 N Class C complex silope; 10* age along soil-granite tribute to forest and fSiEsite flows occur P3 E grade. contact; semi-impervi- litter, less than 1 m. away.
ous claySy soil near bottom.
400 ft NE of corner Site within dissected Class 2, imperfectly Humid-temperate; Ashe- Heavily forested R~egion qomprised
of."Caro-boundary betw. David- Appalachian Piedmont, lo- drained; lower horizon boro ann. ppt. 46.0 by oak and nut lina slates": metamorphic son, ontgoery & Stan1 cal relief 50-75 ft; site impervious, upper bet- in.; mean ann. T trees, a few pines; slates, low-rank schists,
ley Cos., N. Caro.; 25 on flat terrace within ter drained; local con- bl.1* F.; av. low =3* heavy forest under- &- rietavolcanics; at site:
s ft W1 of point 1200 ft Class B simple slope, 6* trol by Yadkin River; F.; av. hidh -103* F. growth & litter. miedium. sreen, mas-sive,
NE of bridze across grade to S. a gully cuts thru site fine-xline andesitic meta-Yadkin (Pee Dee) Riv- into road ditch. volcanic; epidote along
er at confluence with fractures.
Badin Lake, 3 m. S of NewsoG & 26 m. San of Asheboro, N. Caro.
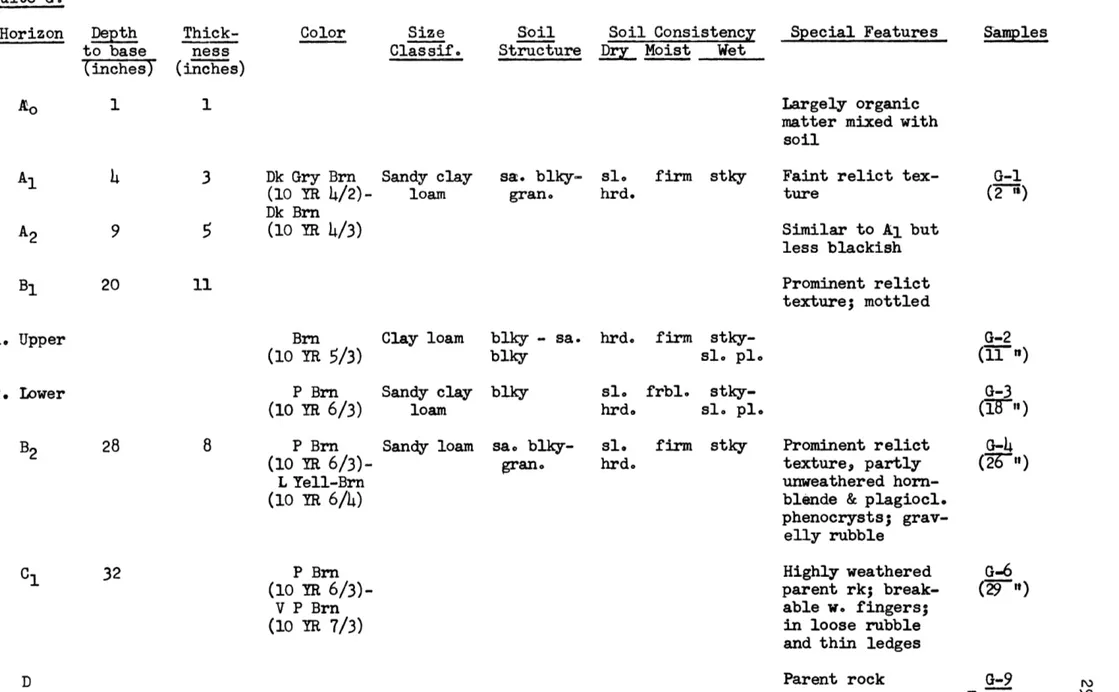
special soil features, and sample numbers, is summarized in Tables 2 A-D.
If a horizon within the profile was sampled, the corresponding sample
number is underlined. This number consists of a letter assigned to the soil site in the field followed by a number which lists the sequence in which the sample was collected (for example:
Q-3,
the third sample from the top of the profile at locality G). The depth in inches below the surface at which thesample was taken is shown in parenthesis below the sample number.
The color of each sample was determined in direct sunlight on the finely ground total bulk samples (TBS) (see p.166) by comparison to standard colors in the Munsell Soil Color Charts. The color terms and symbols follow the classification described in the Munsell Charts text (see also, Soil Survey Manual,
1951,
pp. 194-203). The textural classification used is thatpre-sented in Table 4, page 39, of this thesis.
Suite G:
General Soil Description: The soil cover over most of North Table Moun-tain is thin (in places less than
h
inches). Lava bedrock lies immediately beneath. Near low spots and drainage gullies the soil may attain a thick-ness of 2-3 feet. Some of this soil may represent slope wash accumulation.The soil at the sample site is clearly residual as indicated by a relict texture comprised of in situ laths of weathered plagioclase. This texture is evident up to 3-4 inches from the present surface. No distinct soil horizons are developed. Very little gravel or rock fragments are present except near bedrock. The soil-bedrock transition is sharp, occurring over a
2-4 inch zone of mixed soil and thin rock ledges. Grass roots penetrate the soil to a depth of 12-18 inches.
TABLE 2 A-D
List of Abbreviations Used in Soil Descriptions
- angular - blocky - friable - granular - hard - loose - plastic - rocky sa. sft sl. stky v. we - subangular - soft - slightly - sticky - very - with ang blky frbl. gran. hrd. lse pl. rk. Color Terms: - pale - dark - strong Yell Brn Red
Gry - gray, grayish
- yellow, yellowish - brown, brownish - red, reddish - light - rock P Dk Str
TABLE 2A Soil Structure Soil Consistenc _Dr Moist Wet Special Features
3 Dk Gry Brn Sandy clay
(10 YR h/2)- loam Dk Brn 5 (lo M 4/3) sa. blky-gran. sl. hrd. firm stky Largely organic
matter mixed with soil
Faint relict tex-ture Similar to Al but less blackish Prominent relict texture; mottled Brn (10 YR
5/3)
P Brn (10 YR 6/3) P Brn (10 YR 6/3)-L Yell-Brn (10 YR 6/h) Clay loam Sandy clay loam Sandy loam blky - sa. blky blky sa. blky-gran. hrd. sl. hrd. sl. hrd. firm stky-sl. pl. frbl. stky-sl. pl. firm stky P Brn (10 YR 6/3)-V P Brn (10 YR 7/3) Prominent relict texture., partly unweathered horn-blende & plagiocl.phenocrysts; grav-elly rubble Highly weathered parent rk; break-able w. fingers; in loose rubble
and thin ledges
Parent rock G-9 r) From near- ''-by quarry Suite G: Horizon Depth to base (inches) Thick-ness (inches) AO Color Size Classif. A1 A2 B1 Samples G-1
(2 1)
1. Upper 2. Lower C1 G-2(11)
G-3(If")
cl-4
(72-) G-6 (2I|~)Profile: The immediate profile was exposed by digging 2.6 feet to
bed-rock near the bottom of a 20 slope inclined to the southeast. The profile description is summarized in Table 2 A.
Soil Classification: The soil atop North Table Mountain lies very close to the boundary between the zonal Chestnut and Brown Aridic great soils groups typical of the western Great Plains and the shallow Lithosol soils of much of the higher Rocky Mountains. Characteristics of the soil and its vegetation indicate it to be a variant of the Aridic Brown soils group (also
called the Northern Dark Brown soils). The regional soils map places the Daniels series in the vicinity of the sample site. A Soil Survey around the Brighton, Colorado area (Harper, Scott, and Frahm, 1932) designates the soil formed on the Table Mountain lavas as the Table Mountain loam.
Suite K:
General Soil Description: The sampled soil appears to be developed on the normal granite (see Table 1). The depth of soil development varies laterally in a hundred feet from 0 to 3 feet. Contamination from sources outside the sample site is nil but a mixture of several granite types in the surface and soil rubble indicates some nearby wash and mass movement activity.
Profile: The profile exposed by digging 1.7 feet to apparent bedrock showed several separable horizons. Grass root penetration extended to about 12 inches. The description is given in Table 2 B.
Soil Classification: On the soils map of the U. S., the Northern Bighorn Mountains region appears to be located within the shallow azonal Lithosols great soils group of the western United States. However, the Soil Survey report on Sheridan County, Wyoming (Thorp, Glassey, Dunnewald, and Parsons,
TABLE 2B Soil Structure Soil Consistency _D Moist Wet Special Features Dk Brn (10 YR 4/3)-Dk Yell Bmn (10 YR
4/h)
Loam gran. sft frbl. stky Upper layers v.
dark; few rk. fragments 7 L Yell Bn (10 YR 6/h) 6 L Red Brn
(5
YR 6/h)-Red Yell(5
YR 6/6) Sandy loam Loamy sand gran. sft v. sl. frbl. stky gran. sft- v. sl. lse frbl. stky A few rk. fragments; some rootsSome gravel & rk. fragments Pink (5 YR 7/3
-7/h)
Pink (7.5 YR 7/h) V P Brn (10 YR 7/h) Sand Sand gran.-rky gran.-rkylse lse non- Mostly gravelly rk. stky fragments w. some
silt & clay;
red-stained
lse lse non- Highly fragmented stky yellow-stained
bed-rock w. interstitial silty soil Parent rock K-7 From near-by otc. Suite K: Horizon Depth to base (inches) Thick-ness (iches) Color Size Classif. A grages into B1 changes abruptly to Samples K-1 (2 ") K-2 (6.5 tt) K-3 (12 I) K-4 (17 "f) K-5 (20 "
1939) classifies the soils in the vicinity of the sample site within the
dark acid Prairie soils group. The map in this report shows the exact site to be in either the Burgess fine gravelly loam or Woodrock loam types.
Both series are Podzolic but since the Woodrock forms under heavily forested cover, it is concluded that the grass-covered Suite K belongs to the Burgess series.
Suite N:
General Soil Description: The soil about the Graniteville quarry varies from 0 to 5 feet in thickness, with an average of 2 feet. The soil, where
thick, shows a well-developed profile. Slopewash is evident in the imme-diate area but the normal profile and sharp diminution of rubble within the profile indicate the soil to be residual.
Profile: The profile is five feet thick. The upper 3 feet were sampled from a pit dug 10 feet east of the quarry face; the lower 2 feet were sam-pled from an exposed embankment
5
feet closer to the quarry. Table 2 C presents the summary data for this profile.Soil Classification: The granite soils of the Missouri Ozarks have been correlated with the Ashe series developed on igneous terranes in the central Appalachians. In Missouri, these form a part of the zonal Gray-Brown
Pod-zolic soils group. Around Graniteville, Mo., the soils haVe been assigned to the Ashe stoney loam type, described in the Soil Survey of Reynolds County, Missouri (Krusekopf, De Young, Walkins, and Deardorff, 1918).
Suite S:
General Soil Description: Most of the soils of the Piedmont show, irre-spective of parent rock, strongly differentiated A and B horizons, the latter
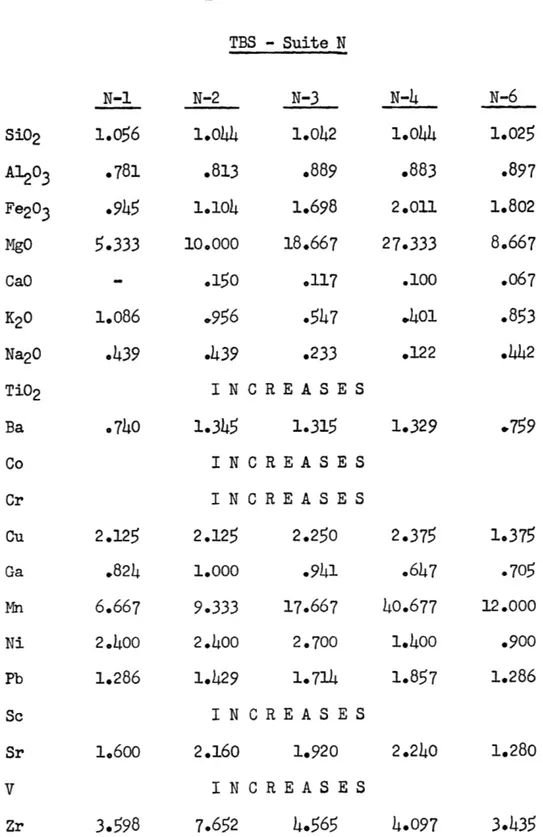
Suite N: Horizon Depth to base (inches) Thick-ness (inches) Color Size Classif. TABLE 2C Soil Structure Soil Consistenc
a
Moist Wet Special FeaturesHumus zone; organic matter & twigs V. P Brn (10 YR 7/3) 1. Upper 2. Middle
3.
Lower Transi-tional to L. Yell Bmn (10 YR6/h)
Yell (10 YR 8/6) V. P Brn (10 YR 7/4) Loam Silt loam Silt loam Silty clay loam gran. gran. gran. -sa. blky sa. blky sft V. sl. Roots; porous frbl. stky sft v. sl. Roots frbl. stky-sl.pl. hrd. frbl. stky-firm sl.pl. sl. frbl. v. hrd. firm stky-sl.pl.More cohesive; very
little gravel 13 V. P Brn (10 YR
7/h)
Loam gran. -sa. blky sft frbl. Transi-tional to Cl v. stky-sl.pl.Higher clay content
Highly weathered ite; fragmented; powdery clay Weathered granite Parent rock Samples N-1 (2 11) N-2 (11 *) N-3 (22 ") N-4 (32 ") C2 N-6 (54 "l) gran-some N-9
marked by a rich red-brown color. Many of the soils developed on granites can be classed as saprolites.
The sampled profile follows this pattern in a general way but the red, iron-rich B horizon is much less conspicuous. The soil, in contrast to a
saprolite, actually becomes finer and more clayey with depth. The bottom soil is a hard, compact clay mass which retains much of the texture of the underlying parent rock. This represents complete decomposition in situ of
the originally fine-grained metavolcanic parent rock to a clay-like residue.
Relict texture persists, with decreasing definition, almost to the top of
the profile. A remarkable feature is the secondary development of black shot- or nut-like iron-manganese concretions which appear prominently in the middle two-thirds of the profile.
Most signs indicate this soil to be residual. However, several quartz-ite rock fragments in the topsoil from an undiscovered source indicate
possible contamination from slopewash.4
Profile: The profile was described and sampled from an exposure along a dry gully. A vertical trench 6 inches deep was cut into this gully to ex-pose fresher soil. The description is given in Table 2 D.
Soil Classification: The soils developed in the southern Piedmont belong
to the Red-Yellow Podzolic soils group. Reference to the soils map (#11)
accompanying the U.S.D.A. Soil Survey report for Davidson County, North
Carolina (Hardison and Brinkley,
1915)
shows the sample site apparently to fall within the Georgeville silty clay loam or clay loam series. However,the Survey text description (p.
48h)
does not conform to the soil character and properties determined for Suite S. A recheck of the soils map showedTABLE 2 D Suite S: Horizon Dpth to base (inches) Thick-ness (inches) Al Grades into Color Yell Brn (10 YR
5/6)
Str Brn (7.-5 YR5/6),
Size Classif. Sandy clay loam Clay loam Soil Structure Soil Consistency _Dr Moist Wet gran. sft- v. sl. frbl. hrd. gran. -sa. blky hrd. frbl. Grades into B1 1. Upper 2. Lower Red-Brn (7.5 YR 6/6) Str Brn (7.5 YR 5/6) Yell (10 YR 7/6) Brn Yell (10 YR 6/6) Yell (10 YR 7/6) Loam Clay Silt loam gran. sa. blky sa. blky-ang blky sa. blky-ang blky hrd. frbl. hrd. firm hrd. frbl.-firm Special Featuressl. Twigs, roots, pebbles
stky (a few of quartzite)
stky Patches and seams of
red-brown clay. Small
blackish concretions, faint residual texture. Blackish concretions
numerous in upper part;
sl. scattered in lower.
stky Relict texture
in-creases in lower;
soil breaks into chunky to nodular
stky- fragments; more
sl.pl. clayey with depth.
sl. stky Grades into 60+ Yell (2.5 YR 7/6) Noticeable relict texture; blackish spots diminish;
re-sembles highly
wea-thered bedrock. Weathered,
yellow-stained chunky frag-ments of bedrock. Fresh bedrock S-7 Samples S-1
(5 ")
S-2 (12 U) S-3 (2h "1) S-4 (36 "t)S-5
(51 ")
S-6 (61 "1)patches of soil classed as the Iredell loam. The text description (p.
483-84)
of this soil type agrees more closely with the nature of Suite S. The soil is described as brown to gray-brown in the upper 10 inches, ironconcretion-bearing in the upper layers, and composed dominantly of plastic clay in the
lower layers; the parent rocks are described as metamorphosed diorites and
gabbros.
The clay mineral assemblage for Suite S (see p. 61) when compared with that found by Rolfe (1954) in the Iredell loam of North Carolina confirms the correlation of this suite with that series.
37
SOIL PARTICLE SIZE ANALYSIS
I. Methods:
A mechanical analysis of particle size distribution was made on each
sample from the four soil profiles following the procedure set up by Kilmer
and Alexander (1949). The soil was pretreated for removal of organic matter,
soluble cements, and free iron oxide by addition of H202 and weak acetic acid. Sodium hexametaphosphate was used as the dispersing agent. The sand and gravel fractions were sized by sieving on Tyler screens; the silt and clay fractions were sized by pipette analysis. The fraction finer than
1/4096
has been termed the ultraclay fraction.The Wentworth grade scale has been used as the basis of all size
calcula-tions. The raw size analysis data is presented as histograms showing the
fre-quency distribution of particles in these grade divisions (Figure 1 A-D). The
combination of these data into the Wentworth gravel, sand, silt, clay and
ultra-clay divisions is summarized in Table 3. These larger divisions (with ultraclay
added to clay) were used to plot a cumulative curve, on an arithmetic scale, for
each sample (Figure 2 A-D). From these curves, the median diameters Q2 and the
Trask Sorting Coefficient So (Krumbein and Pettijohn, 1938, pp. 229-31) were
calculated and are given in Table 3. Variations in sand-silt-clay percentages, recalculated to 100% because of omission of gravel and ultraclay, within each
profile are shown in triangle diagrams in Figures 3 A-D.
Frequency percentages of the major divisions recalculated according to the
U.S.D.A. Bureau of Soils size scale (sand-silt division at 1/2 mm.; silt-clay at 1/200 mm.) and classification (U.S.D.A. Soil Survey Manual,
1951,
pp. 209-211) are presented in Table h.TABLE 3
Soil Particle Size Data
Sample No. G-1 G-2 G-3 G-4 K-1 K-2 K-3
K-5
N-1 N-2 N-3 N-4 N-6 S-1 S-2 S-3 S-h Gravel 1.85.9
21.6 28.8 20*2 24.4 40.6kl.1
8.75.1
1.3 0.111.5
19.4 17.4 18.3 7.3 Sand 46.1 31.9 39.7 40.7 38.5 51.7 47.9 39.3 22.3 14.7 9.8 33.4 39.4 33.4 37.5 27.7 Silt 21.7 17.0 14.2 15.8 31.7 17.4 8.0 3.4 39.3 47.651.1
51.3
34.7 13.1 19.5 26.2 18.8 Clay 9.1 20.9 10.6 9.1 7.2 4.1 2.1 1.7 9.5 19.0 18.6 20.7 10 .5 15.5 19.8 17.2 25.0 Ultraclay 19*7 24.1 14.05.9
3.0 2-1 1.4 0.2 2.8 5.6 14.0 17.3 11.7 7.6 9.7 2.8 21.0 - 18.5 66.5 14.7 0.3 .o45 .011 .135 .270 .130 .330 .850 .900 .010 .009 .007.oho
.150
.060 .105.006
14.8 27.4 17.9 30.4 9.0 5.65.7
5.1
16.7 12.9 11.6 11-8 24.0 21.6 18.6 lo.8 25.7 .ohi 2.06TABLE
4
Size Data According to Bureau of Soils Classification
Sample No. G-1 G-2 G-3 G-4 Sand (2 -~.~05 mm.) 49
35
59
Silt* (0.05~~~T.002 mm.) 24 25 21 22 Clay* (0~00 mm.) 27 30 28 1940
22 125
45
59
59
60
K-1 K-2 K-3 K-5 N-1 N-2 N-3 N-h N-6 S-1 S-2 S-3S-4
S-5
Soil Class.Sandy clay loam Clay loam
Sandy clay loam
Sandy loam Loam Sandy loam Loamy sand Sand Loam Silt loam Silt loam
Silty clay loam
Loam
Sandy clay loam Clay loam
Loam Clay Silt loam
*
Because the Wentworth gravel fraction is excluded and ultraclay is combined with clay, the sand, silt and clay percentages are recalculated to 100.
FIGURE I A-D
HISTOGRAMS SHOWING
PARTICLE SIZE DISTRIBUTION
UC -11.70 UC = 0.26 UC: 5.90 -1/4096 -1/1024 -1/256 -1/64 -1/16 -1/4 G= 28.80 UC= 14.00 G 1.77 in o In 0 -1/2048 -1/512 -1/128 -1/3' -1/8 -1/2 -2 -i/4096 -1/1024 -1/256 -1/64 -/16 -/4 UC = 0 21 1/4096 1/1024 1/256 I [1/64 1/16 1/4 1/2048 1/512 1/128 1/32 1/8 1/2 2 G=11.50 UC=17.3 6=4110 UC= :145 G=40.60 UC= 2 09 1/2048 1/512 1/128 1/32 1/8 I/B 1/2 2 1/4096 1/1024 1/256 1/64 1/16 1/4 -1/4096 -1/1024 -1/256 -1/64 -1/16 -1/4 G=0.1 G60.00 UC= 20.98 G = 7.35 UG =282 UC =14 00 G -:.30 UC : 5 60 G = 24.40 UG: 3 00 - /2048 -1/512 -1/128 1/32 -1/8 1/2 .2 G= 20.22 -1/2048 -1/512 -1/128 -. /32 -1/8 -/2 -2 /2048 1/512 1/128 -1/32 I/8 1/2 2 /4096 1/1024 1/256 1/64 1/16 1/4 G=5 10 UC = 2.80 Gr8.70 0 In 0 i 0 0 n 0 N N imWEIGHT PERCENT 1/2048 1/512 1/128 1/32 1/8 1/2 2 G = 18.34 UC:9.75 G= 17.40 UC =7 59 6:= 19.45 0 in 0 n 0 0q Gs 21.60 UC: 24.15 G= 5.92 1/2048 1/512 1/128 1/32 1/8 1/2 2 1/4096 1/1024 1/256 1/64 1/16 1/4 1/2048 1/512 1/128 1/32 1/2 2 1/4096 1/1024 1/256 1/64 1/4 1/2048 1/512 1/128 1/32 1/8 1/2 2 UC = 19 72
100 80 Z 60 w cr L- 40 0 20 0 GRAVEL SAND SILT CLAY PARTICLE DIAMETER (MM) 80 60 40 FIGURE 2B-SUITE K -- -I '/ -/ -/. /. -/+ -I. 10 GRAVEL 0.1 SAND 0.01 SILT PARTICLE DIAMETER (MM) |C 0 SAND SILT PARTICLE DIAMETER (MM) CLAY GRAVEL SAND SILT PARTICLE DIAMETER (MM) 0.001 0.0001 CLAY GRAVEL CLAY