THE ENERGY LABORATORY
ADVANCED WET-DRY COOLING TOWER CONCEPT PERFORMANCE PREDICTION by Troxell Snyder Jeffrey Bentley Martin Giebler Leon R. Glicksman Warren M. Rohsenow
Department of Mechanical Engineering, M.I.T.
Ener:;y Laboratory
.Repor. No. MIT-EL 77-002 Volume I January 1977
Advanced Wet-dry Cooling Tower Concept by Troxell Snyder Jeffrey Bentley Martin Giebler Leon R. Glicksman Warren M. Rohsenow Energy Laboratory In Association With
Heat Transfer Laboratory
Department of Mechanical Engineering
Massachusetts Institute of Technology
Sponsored by:
Reactor Research and Development Division Energy Research and Development Administration
January 31, 1977
ENERGY LABORATORY REPORT NO. MIT-EL 77-002 HEAT TRANSFER LABORATORY REPORTS NO. 83307-99
ACKNOWLEDGEMENTS
The Reactor Research and Development Division of the Energy
Research and Development Administration sponsored this study under ERDA Contract E(11-1)-2500.
Special thanks are due to Mr. William F. Savage. His active interest and suggestions were a great benefit to the program.
ABSTRACT
The purpose of this years' work has been to test and analyze the new dry cooling tower surface previously developed. The model heat transfer
test apparatus built last year has been instrumented for temperature, humidity and flow measurement and performance has been measured under a variety of operating conditions.
Tower Tests showed approximately 40-50% of the total energy transfer as taking place due to evaporation. This can be compared to approximately
80 to 85% for a conventional wet cooling tower. Comparison of the model tower test results with those of a computer simulation has demonstrated the validity of that simulation and its use as a design tool. Computer predictions have been made for a full-size tower system operating at several locations.
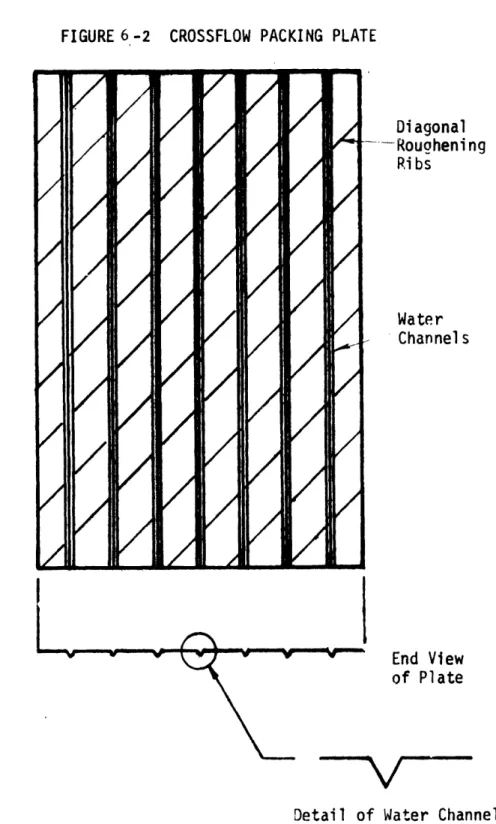
Experience with this counterflow model tower has suggested that several design problems may be avoided by blowing the cooling air hori-zontally through the packing section. This crossflow concept was built from the previous counterflow apparatus and included the design and fabri-cation of new packing plates.
Instrumentation and testing of the counterflow model produced data
with an average experimental error of 10%. These results were compared to the
predictions of a computer model written for the crossflow
configu-ration. In 14 test runs the predicted total heat transfer differed from the
measured total heat transfer by no more than 8% with most runs coming
well within 5%. With the computer analogy's validity established, it may now be used to help predict the performance of fullscale wet-dry towers.
TABLE OF CONTENTS -TITLE PAGE.. ACKNOWLEDGEN ABSTRACT.... TABLE OF CON LIST OF FIGU LIST OF TABL PRINCIPLE SY CHAPTER 1: CHAPTER 2: CHAPTER 3: CHAPTER 4:
... ... ... ... ... ...
IENTS
.. ...
... ... ... ... ... ...
'TENTS · · · ·...
'RES
...
ES
... ... ... ... ... ... ...
'MBO0LS
... ... ...
INTRODUCTION
.. ...
1.1 History of Project...
1.2 Progress This Year...
EXPERIMENTAL APPARATUS AND DESCRIPTION OF
I'NSTRUMENTATION
MODPL.
...
...
2.1 Model Tower .. ...
,...
2.2 Temperature easurement
.. ...
2.3 Evaporation Measurement ... I...,...
2.4 Flow Measurements ...
,...
...
2.5 Error nalysiss ...
...
COMPARISON O)F TEST RESULTS AND) COMPUTER PGGRAM ...
3.1 Computer
Program
..
...
3.2 Determination of Surface Transfer Cofficients..
3.3 Summary of Test Data and Computer Predictions...
VOLU1IE I 1 2 . 3 4 7 9 10J')
12 12 15 15 17 21 22 24 32 32 34 36PERFORMANCE COMPARISON FOR VARIOUS COOLING
42 42
47 TOWER COMBINIONS ...
4.1 Description of Combination-Type System ...
4.2 Performance Predictions...
CHAPTER 5:
CHAPTER 6:
REFERENCES. APPENDIX A:
APPENDIX B:
4.2.1 Heat Transfer Rate... 4.2.2 Air Flow Requirements...
4.2.3 Water Consumption ...
4.2.4 Minimum Turbine Back Pressure... 4.2.5 Incidence of Fogging ... CONCEPTUAL DISCUSSION OF CROSSFLOW CONFIGURATION... 5.1 Need for a Crossflow Design... 5.2 Feasibility and Computer Program... 5.3 Visualization of Large Crossflow Towers...
PRELIMINARY COST COMPARISON ...
6.1 Economic Model... 6.1.1 Capital Cost of Cooling System... 6.1.2 Economic Penalties of Cooling Systems... 6.2 Performance Model... 6.2.1 Optimization of the Wet-Dry System... 6.2.2 Wet-Dry Module Design... 6.3 Cost Estimation... 6.3.1 Penalty Costs... 6.3.2 Capital Costs... 6.4 Results...
6.5 Discussion of Lost Capacity Penalty ...
...
Results of Thermocouple Calibration Tests... Sample Calculations... B.i Error Analysis for Heat Balance... B.2 Energy Balance for Experimental Data...
48 51 53 61 63 68 68 70 73 75 76 76 76 80 80 84 89 89 91 95 98 101 103 108 108 112
APPENDIX C: APPENDIX D: APPENDIX E: APPENDIX F: APPENDIX G: APPENDIX H: APPENDIX I: APPENDIX J: Raw Data ... 114
Design Factors of Comparison Towers ...118
Corrosion and Painting of Packing Plates ...123
Flow Visualization ... 125
Climatic Data ... 127
Counterflow Computer Listing ...136
Crossflow Computer Listing ... ... 147
Determination of Dry Plate Surface Heat Transfer Coefficients ...159
LIST OF FIGURES -VOLUME I
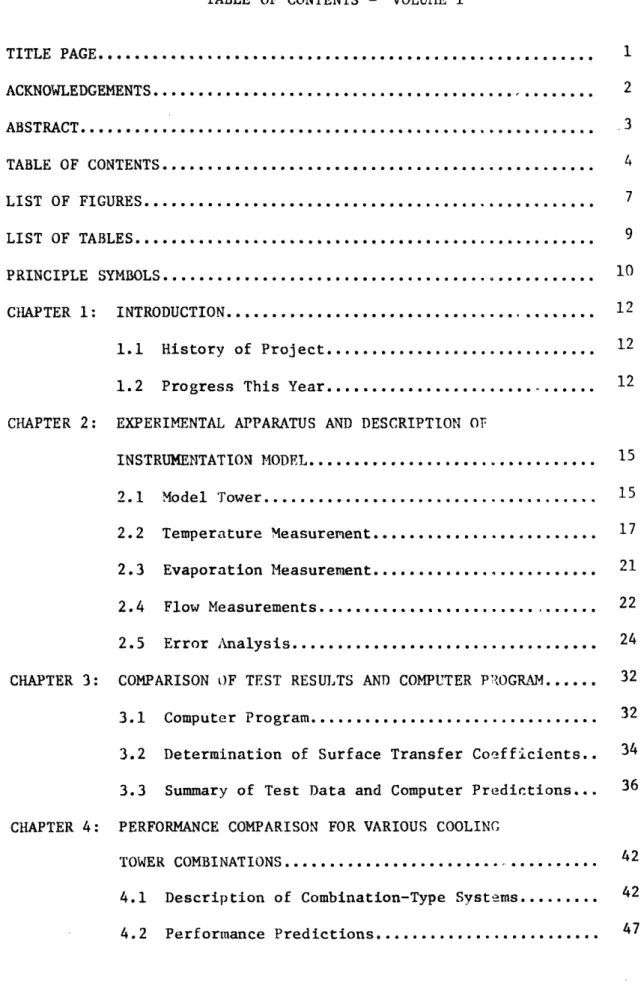
1-1 V-Trough Packing Plate ... 13
2-1 Heat Transfer Test Apparatus Assembly ... 16
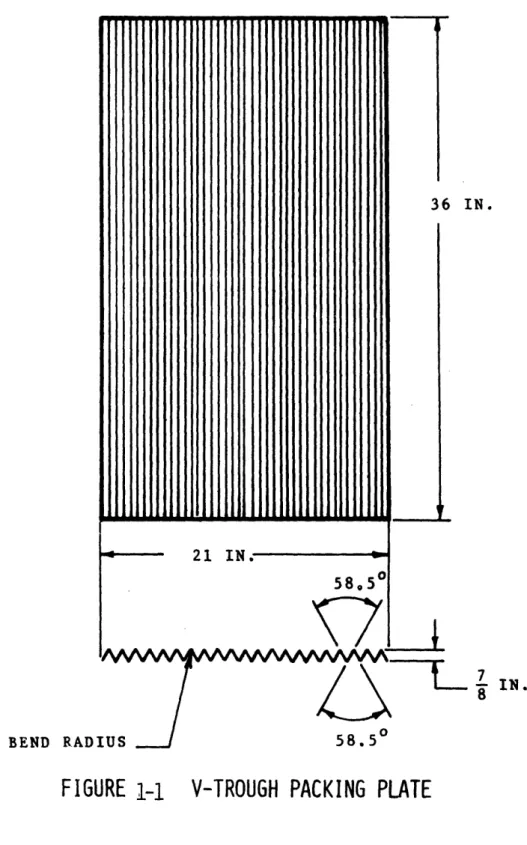
2-2 Instrumentation of the Packing Plates ... 19
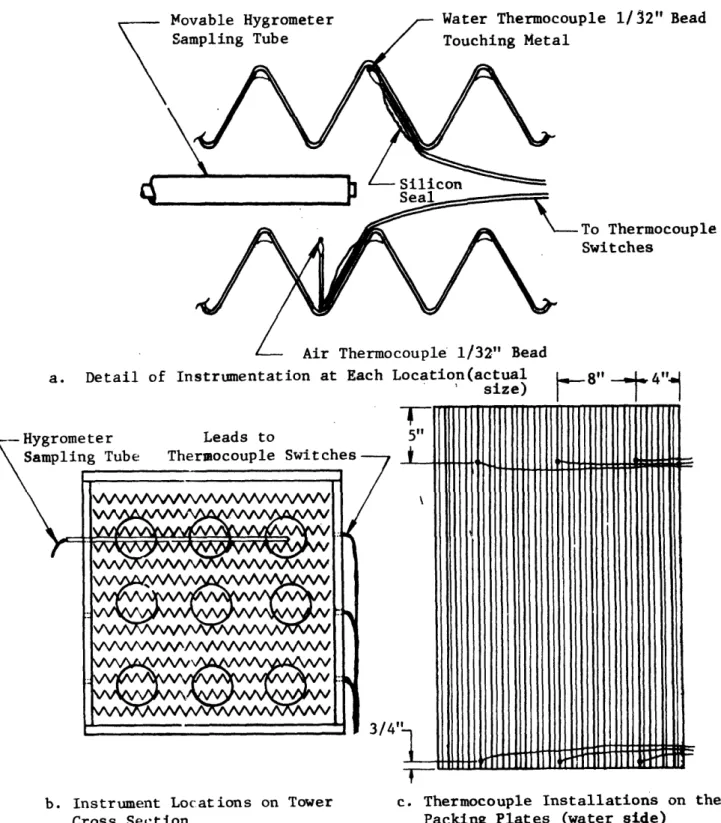
2-3 Thermocouple Installation in Distribution Pipes ... 20
2-4 Thermocouple Installation in Outlet of Collection Channels.. 20
2-5 Location of Sliding Rakes for Air Temperature Measurement... 26
2-6 Pitot Tube Installation ... 27
4-1 Flow Configurations for Combination-Type Cooling Towers ... 43
4-2 Total ad vaporation Heat Transfer Rate vs. Inlet Air emperature ... 49
4-3 Variation cf Total Heat Transfer Rate with Inlet Relative Humidity ... 52
4-4 Air Mfass Flow Rate vs. Inlet Air Temperature ... 52
4-5 Water Consumption Rate for Combination Towers vs. Air Inlet Temperature ... 54
4-6 Variation of Water Consumption Rate with Inlet Air and Water Temperature ... 56
4-7 Seasonal Variation of Water Consumption Rate for Various U.S. Cities . ... 58
4-8 Yearly Water Consumption for Various U.S. Cities ... 60
4-9 Turbine Back Pressure vs. Inlet Air Temperature ... 62
4-10 Exhaust Air Temperature and Relative Humidity for WET, DRY, and WET/DRY Towers ... 64
5-1 Heat Transfer Rate ve. Inlet Air Temperature for
Counter- and Cross-Flow Cooling Towers ... 72
5-2 Visualization of Full-Size Crossflow Module ... 74 6-1 Heat Rate Correction for 1000 Mwe Fossil Fuel
Generating Plant ... 81
LIST OF TABLES
2-1 Average and Centerline Air Velocities Between Packing Plates.... 25
31 Comparison of Computer Program and Model Tower Test Results -Unpainted Packing Plates ... 40
32 Comparison of Computer Program and Model Tower Test Results -Painted Packing Plates . ... 41
6-1 Module Cost Optimization ... 83
6-2 Design Parameters of Wet-Dry Module ... 85
6-3 Summary of Wet-Dry System Performance ... 87
6-4 Summary of Cost Comparisons .... ... 93
A-1 Thermocouple Calibration Results ...104
B-1 Partial Differentials for Error-Analysis ... 111
C-1 Raw Data ...115
D-1 Summary of Design Parameters of Tower Models ... ...122
G-1 Climatic r ta for Albequerque, N.M ...128
G-2 Climatic Dta for Los Angeles, Cal ...130
G-3 Climatic Data for Boston, Mass ...132
G-4 Climatic Data for New York, N.Y ...134
H-1 List of Computer Program Variables - Counterflow ...142
H-2 List of Program Input Parameters ...146
I-1 List of Variables - Crossflow Program ...154
Principle Symbols Symbol A C cp Dh h h hdry surface ho hD
hfg
T fg H ITD k M , in Nu P Pr Q Qdesign ReRH
t
Description area heat capacity heat capacity hydraulic diameter height specific enthalpydry surface heat transfer coefficient wet surface mass transfer coefficient
latent heat to vaporization of water a T latent heat to vaporization of water at To Total enthalpy
(T T
Xin ain
thermal conductivity mass flow rate
Nusselt Number pressure
Prandtl Number heat transfer rate
design heat transfer rate for performance models of Chapter 420,000 BTU/min/tower
Reynolds Number relative humidity plate thickness
Description T T 0 V z W.C. W.C. wet 'basis W Greek
'if
p Subscripts a in mix outv
temperature reference temperature velocity length of fin water consumptionwater consumption of wet tower
fixed rate of water consumption used for comparison 0.82 lb /1000 BTU rejecte specific humidity of air-water vapor mixture
fin efficiency density air inlet liquid (water) mixture(air-water vapor) outlet water vapor Symbol
CHAPTER I
INTRODUCTION
1.1 History of Project
Early in 1975, work was started at M.I.T. to develop a single heat transfer surface which would give low evaporation rates at costs competitive with equal wet tower capacity. The wet-dry concept is the result of this work. In this design, water is distributed onto a packing plate fabricated
(see Figure 1-1) to keep the hot water in discrete channels over which cooling air is blown. These channels serve to restrict the free surface area of the water, thus reducing evaporation and water loss. The packing plates are made of conductive material which acts as a fin heated at the base by the channeled water and cooled by forced convection [1]. By
conceding a small amount of evaporation the fabrication costs for the wet-dry surface have been reduced far below those of a completely closed or dry
heat exchanger.
To demonstrate this concept a model test tower was built during 1975. In addition, a computer program was written based on analytic studies of evaporative cooling. Tests of the partially instrumented tower indicated high heat transfer rates while the initial results of the computer analogy indicated a substantial reduction in evaporation rate. This year's work has led to more quantitative results and predictions.
1.2 Progress This Year
Work this year has included the instrumentation and testing of the model cooling tower referred to above. Comparison (Chapter 3) of these test results with the computer program predictions has shown the program to accurately predict the heat transfer performance of the V-trough packing section under the available range of operating conditions.
7 -E I U N l-- 21 IN. 58.5(
AlsAkAAAAAAAA, AAAfAAAA
36 IN.I
|-
IN.BEND
RADIUS
58.50
32FIGURE 1-1 V-TROUGH PACKING PLATE
I I I I I I I I II I I I I I I I i i I I I I I 4 p 1 j I I I I I I I I I m I I I I I I q I I I I I l I I I I I l I0I I I I I 0I I I .
Using the computer analogy as a design tool several types of cooling
tower systems were sized and compared under a wide range o inlet conditions. These comparisons are reveiwed in Chapter 4 and include comparisons for
several sites around the United States.
During the course of the experimental evaluation several design drawbacks were found to the present air-water counterflow design. A proposed solution
to these shortcomings was to alter the air flow to blow horizontally across the packing section. The advantages of this crossflow design are described in Chapter 5 as well as a discussion of the appearance of a full size cross= flow tower.
Chapter 6 contains a simplified estimation of the costs of a full size set-dry towers system based on cost estimation procedures described in the
WASH-1360 report [ 16. Volume 2 of the report describes the adaptation of
the counterflow model tower to a crossflow configuration. This new de-sign required a new type of packing plate as well as complete re-instru-mentation of the former model tower.
The final project conclusions, along with recommendations for future
work can also be found in Volume 2. Technical and special interest subjects
CHAPTER 2
EXPERIMENTAL APPARATUS AND DESCRIPTION OF INSTRUMENTATION MODEL
2.1 Model Tower
The model tower tested for this report is essentially the same as
described ir. Reference [1], and instrumented as described in the following
sections.
As a brief review, the model tower (Figure 2-1) is an induced-draft
counterflow design with a plan area of four square feet (0.37 m 2). The
heat transfer packing section holds the packing plates. Hot water is distributed at the top of the packing section and collected in troughs at the bottom. Ambient air from the laboratory enters from the bottom of
the packing section and exits at the top.
There are 14 V-trough packing plates each (Figure 2-2) with 21 troughs
making up a total heat transfer area of 280 ft2 (26 m2) [1]. Air flow was
fixed by fan size and was approximately 350 ft 3/min/plan foot square area
(1.8 m3/s/plan m2 area). Inlet water flow rate could be varied from 2.7
to 6.0 gpm/plan ft2 (1.8 to 4.1 1/s/plan m2) with temperatures as high as
150 F(66 C). [ll.
Instrumentation of the model included installation of 55 thermocouples measuring air and water temperature at the inlet and exhaust of the packing section. Calibrated rotometers measured water flow rate and a pitot tube was used to check airflow rate. Changes in moisture content of the air were measured by an optical dewpoint hygrometer (Section 2.3).
Error analysis (Section 2.5) has predicted a maximum error between the air and water energy balance of about 15%. The highest error observed in the nine test runs was 24% with the average error approximately 13%
0{/ uJ F-s H c <i: <0
z
l< 0
J J
L
<: J CL O cL. HD C. O. I w Z: It Z W C/) 0-4 X 9= < Y e u -1L w J Z: <U: w a. c< < . LL C)H
. LCL -i LU -J wz
:w
o
3:
wz
O :::
w
J - J-i <
-OQ O
0
t--tzi . : /) L0 W cz a-.- 4 a -3 CL :D(n
D
-i
-J 0 ::a > ULw
a:w
'-r
H
C-Z
I-C9 -J 0-4 0-4 : w w U) Z 2:-J
0-4 U) I -L-L H-W Z ~; L, C/3 -cOV)
I-c
I-LL C) c0: LU0 0
aw
I--
a-1::: 2rw
w
U) :3:: ofw
4
<
H-0
I-I- -J < CLw
U) cn a0 0T-J
-4i Uf) I2.2 Temperature Measurement
The principal goals of the tower instrumentation were to fully describe the performance of the tower and to check the validity of the
computer program. To accomplish this it was necessary to determine the inlet and outlet conditions of both the air and water. The specific measurements required included the temperature change experienced by the water and air streams, the amount of water transferred to the air and the air and water flow reates. It was decided that an accuracy of
at least + 10% be required for the temperature differences measured, and
the water evaporation rate. This would result in possible errors in the energy balance of less than 10%.
Copper constantan thermocouples were chosen for the temperature measurement. Preliminary computer runs predicted a water temperature drop
of less than 4F for some typical laboratory operating conditions. In
order to maintain the accuracy required for this change, the two water
temp-erature measurements would have to be repeatable to about .20F. However,
thermocouple wire manufacturers do not guarantee this accuracy for all lengths of wire. Therefore, before installation a calibration check was made of the fifty-four thermocouples after assembly with switches and other hardware (See Appendix A). A single ice bath junctior was used between the switches and the readout device. The calibration method was to use one thermocouple as a standard and to compare each of the others to it, when placed in the same constant temperature bath. A steam bath
was first used in an attempt to maintain a constant temperature. However,
it was found that a calibration to better than .50F was difficult using
thermostatically controlled. The two thermocouples being tested were placed in a narrow glass tube with oil covering the junctions. The
temperature of the bath inside the tube was held constant to + .lF at about 176°F. However, these fluctuations were slow enough so that the
out-put of the thermocouples could be measured and compared to + .050F. It
was fourd that while the thermocouples produce a steady voltage for a short
time, their calibration will change by about + .10F over a period of several
hours. In addition, the thermocouples were in general with + .10F of
each other. Therefore, the thermocouples were found Lo have a repeatability
of + .10F not only with time, but also with respect to each other. Accuracy
of the system was of lesser importance than repeatability, but comparison
with an NBS claibrated thermometer readable to + .50F showed that the
thermocouple millivolt outputs could be converted to temperatures by use
of standard conversion tables. Also, testing at a lower temperature (1040F)
indicated that the error tends to decrease as the temperature decreases. During both calibration tests and tower runs, a digital voltmeter was used to measure the thermocouple output. This meter had a resolution
of + 1 microvolt which corresponds to about + .050F. An accurate
potentiometer was used to check the calibration of the voltmeter. Since the meter had high input impedance (10 M) compared to the wire resistance
(500) the effect of the small current flow on the thermocouple voltage is much smaller than 1 microvolt snesitivity of the meter. Potentiometers were not used for the runs, because a device of the accuracy required is often bulky and sensitive to vibration. The digital meter also made it possible to read all fifty-four thermocouples in a shorter time.
ple 1/32" Bead
To Thermocouple Switches
a. Detail of Instrumentation at Eac
b. Instrument Locations on Tower Cross Section
c. Thermocouple Installations on the Packing Plates (water side)
Figure 2.2Instrumentation of the Packing Plates Including Locations of Thermocouples and Hygrometer Sampling Tube
- I 'I - - ·
..-- -, -- -~- ---
Figure 2-3 Thermocouple Installation
in Distribution
Pipes (Actual Size)
Silicon Seal Figure 2-4 Thermocouple Installation in Outlet of Collection Channels (Approximately Actual Size) Icw . .
Spray Holes
Temperatures were measured at eight locations. The water temperature was measured inside the distribution pipes, at the top and bottom of
the packing plates and at the outlet of the collection channels. The air temperature was measured below the collection channels, at the bottom and top of the packing and above the distribution pipes. To obtain an average over the cross-section of the tower, nine measurements were ade at each location, except in the collection channels, where three measurements were made. The air and water temperature on the plates were measured by using nine separate thermocouples for each measurement. They were fastened at
three locations at the top and bottom of three different plates. (See Figure 2-2). The temperature in the water collection charnels was measured at the outlet of the channels below the plates instrumented for air and water measurements (See Figure 2-4). The thermocouples in the pipes were placed in the same nine locations as in the packing section.
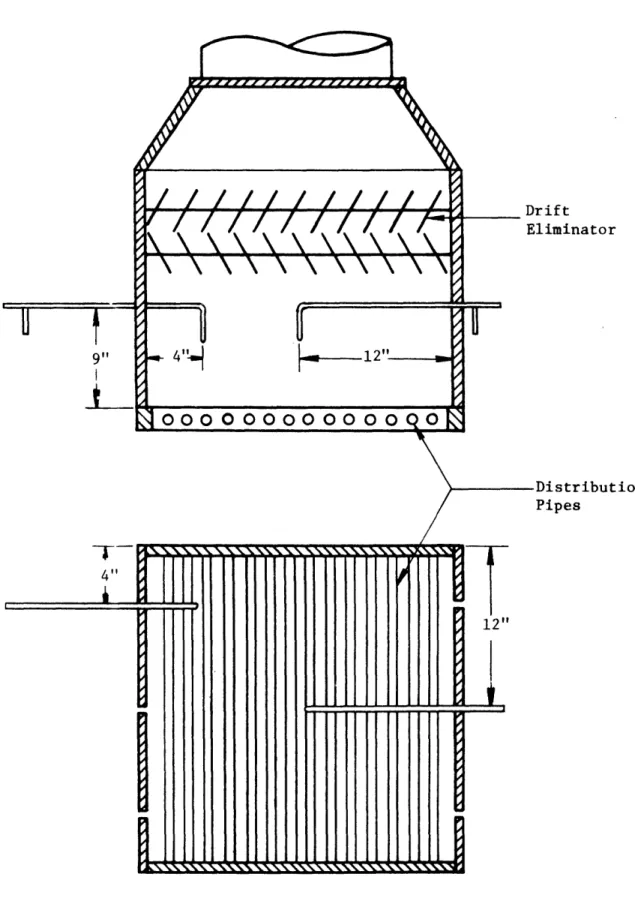
(Figure 2-3). The measurement of the air temperature above the pipes and below the channels was accomplished using rakes with three thermo-couples (Figure 2-5). These rakes were moved to three positions as at the other tower locations. The air and water measuring thermocouples on the plates and in the troughs, were fastened in place with silicon seal. In the distribution pipes, the thermocouples were inserted through holes in the pipes and similarly cemented in place.
2.3 Evaporation Measurement
In order to determine the rate of water loss in the tower, two methods were considered. These were a direct measurement of the water
humidity at both ends of the packing section. The first method was not used since it was decided that leakage in the tower would greatly affect
the measurement of the small amount of loss expected. Several different types of hygrometers were investigated. It was determined that + .3°F accuracy was required for a dew point measurement, to ensure less than + 10% error in the evaporation rate, assuming that approximately .1% of
the water is evaporated. Hygrometers which use variable resistance probes are in general greatly affected by wetting. They are also subject to some drift and are marginally acceptable when calibrated. An optical
dew point device was found to be sufficiently accurate, as well as reliable. A demonstrator model was used for the test runs, which was found to be
repeatable to at least + .30F (See Figure 2-2).
2.4 Flow Measurements
Two rotometers were used to determine the water flow rate through the tower, each measuring the flow to one of the plexiglass feeder tanks. Each rotometer had a capacity of approximately 20 gpm and were calibrated by means of a weight tank. They were readable to + .2 gpm (+ 1% maximum
flow). For the lowest flow rate used in the tower ( 5 gpm per meter)
this error was + 4%.
To speed the process by which the air flow rate was determined
in the packing section, it was decided to fix a pitot tube in place between the plates and take only one measurement for each data run.
The air flow between the individual plates was assumed to be turbulent with maximum velocity at the midpoint of the separating gap. Measurements of this midpoint velocity showed that it was nearly uniform throughout the packing section.
The pitot tube was fixed between the plates about 1/3 of the way back and 1/3 of the way (Figure 2-6) in from the sides of the packing
section. Great care was taken to align the tube parallel to the plates and in the center of the gap. A movable pitot tube was positioned parallel
in the plenum above the packing section and used to scan the airflow at that point.
Data taken at various air flow rates were then compared and a ratio was found between bulk air flow as measured by the scanning pitot tube
and mid-point air velocity measured by the fixed pitot tube.
For a pitot tube in a low velocity airstream the velocity is given by the relation:
1/2 pV2 = AP (2-1)
Thus, for any two pitot tubes in air at the same temperature and pressure, the ratio of velocities is:
I=
1
=1
(2-2)V2 VIAWT
2 2
and the ratio of the average velocity measured in the plenum and the velocity measured by the fixed pitot tube is given by:
V V) W- + I ... -)
avg 1 2 9 (2-3)
Vfixed hfixed
fixed
Where h - hg are the manometer heights taken at the 9 scan locations.
Eight sets of measurements were made at varying airflow and averaged to give the velocity ratio. (See Table 2-1).
For the analytic comparison,
Re = V Dh/v V = 300 to 500 ft/min (1.52 to 2.54 im/s)
Dh = 0.25 ft (.08 m)
Re = 6400 to 11,000
From Reference [12] by integrating the relation:
Vx 1/ V = (Y/ro) where VCL 0 Re n V/VCL 4,000 6 0.791 110,000 7 0.817
Indicating a ratio of approximately 0.80 for this range of Reynold's numbers. This compares favorably with the experimentally measured ratio
of 0.81.
2.5 Error Analysis
To determine the significance of the instrument errors, their effect on the energy balance must be shown. The energy balance for a heat exchanger reduces to [4]:
Rate of enthalpy in = Rate of enthalpy out In the case of the cooling tower, this becomes,
TABLE 2-1
Average and Centerline Air Velocities Between Packing Plates
RUN h above avg plates (vi-n) 1 0.1213 2 3 0.0779 0.1232 0.1406 4 5 0.1397 6 0.1176 7 0.1186 8 0.0864 I-hfixed 0.1367 0.1095 0.1500 0.1590 0.1711 0.1539 0.1410 0.1090 Ratio V /V avg CL 9.89 0.71 0.82 0.88 0.82 0.76 0.84 0.79 Average Ratio = 0.81
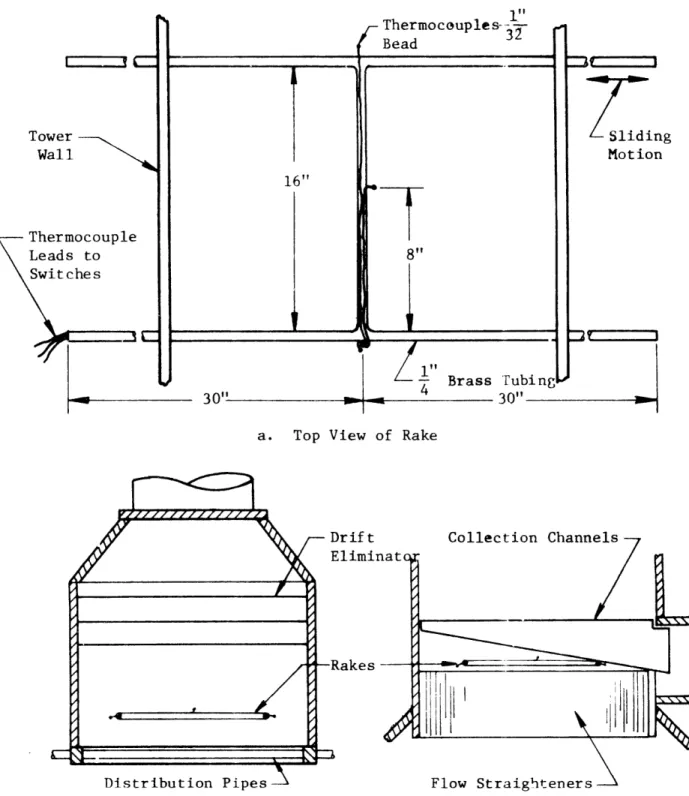
a. Top View of Rake
b. End View Above Distribution Pipes c. End View Below Collection Channels
Figure 2-5: Location of Sliding Rakes Used to Measure Air Temperature Above the Distribution Pipes and Below the Collection Channels
11
Towe
Wal
To, a
tor
bution
Q =mair (h + w. h -h w h
air airin in vapori air out vaporout
m c (T - T ) + (m - Am ) c water
water p water. o water water p
water in
(T
- T )
(2-4)
water o
out
where m, h, w, and T are mas flow rates, enthalpies, absolute humidities
and temperature respectively. Q is the heat transfer rate and c is
water the specific heat at constant pressure for water, which is assumed to be
1 BTU/lb °F. T is the reference temperature at which the enthalpies
m o
are evaluated. Here T is 320F. The reference for the water vapor is
liquid water at 320F. Am water is the amount of water transferred to the
air stream, and is given by:
Am
=m
(w
-w
)
(2-5)
water air out in
The value of m . is determined by the pitot tube measurement, and is
air
subject to the associated error. hair and hair are determined by
air
air
out
the air temperature measurements as are h and h Errors
vapor vapor
out
in these values are determined by inaccuracies in the thermocouple reading,
as are errors in Twater and Twater . win and wout are measured with
in out
the dew point hygrometer.
To evaluate the effect of instrument limitations, an uncertainty analysis is made using the following form of equation 2-4, combined with equation 2-5.
6Q = mn (har + w h -h w h )
air air in vapor air out vapor
in in out out
+
mr c
(T
-T)
-c
water p water. o
water in water
(
-
m
(w
-w
))(T
t
- T )
(2-6)
water air out in water o
out
where 6 Q is the discrepancy between the air and water sides of heat
balance. The uncertainty u is calculated by the following equation [9]:
1 2 2 2
u(=
x
uu)
+
(-
u
2
)
+...
+
( u
where x, 2,. .. x are the humidities, enthalpies, temperatures and flow
rates in equation 2-6 and u, ...u are their respective uncertainties.
The following values which satisfy the energy balance might be typical test conditions for the model tower:
. = 150 + 8 lb /min
air - m
= 170 + 1.7 lb /min
water - m
Air temperature in = 900F + .10F (after collection troughs)
Dew point temperature in = 50*F + .3'°
Air temperature out = 100°F + .1°F
Dew point temperature out = 55F + .3°F
T = 1200F + .1°F
water-in
water = 116.40F + .10F
out
The heat transfer rate for this case as cauculated using equation 2-4 is 625.6 BTU/min. The uncertainty according to equation 2-7 is 46.6 BTU/min or 7.5%. To illustrate the dependence of the error in
Q on the test conditions the following set of conditions is investigated:
air = 150 + 8 lb /min
air- m
mr = 90 + 1.7 lb /min
water - m
Air temperature in = 900F + .10F
Dew point temperature in = 20'F + .3°F
Air temperature out = 1030F + .1°F
Dew point temperature out = 33°F + .3°F
T = 140°F + .1°F
in
T = 1320F + .19F
water-out
In this case Q = 745.43 and the uncertainty is 43.83. Even though the water temperature change and the absolute humidity may e more accurately measured for this case, the effect on the energy balance is insignificant.
The error in the air flow measurement still predominates, and the un-certainty is essentially unchanged (see Appendix B). Due to an increase
in Q, however, the percent error is reduced to 5.9%.
Other factors which may influence the accuracy of the data, include the fact that the nine locations may not give a true average over the
cross-section. The hygrometer sampling tube may occasionally remove water droplets with the air, and the pitot tube measurements may
be affected by the proximity of other tower components such as the dis-tribution pipes and the drift elminators. (See Fig. 2-6). The magnitude of these possible errors is difficult to predict analytically.
CHAPTER 3
COMPARISON OF TEST RESULTS AND COMPUTER PROGRAM
3.1 Computer Program
The domputer program (Appendix H) was the same as given in reference [1], modified to match measured values of the dry plate surface heat transfer coefficient and the wet-to-dry surface area ratio.
The basic equations were taken from a paper by G. Yadigaroglu which was concerned with totally wet towers with flat packing plates. They were then modified to include heat transfer from the dry surface. The solution involves choosing values for the temperatures, water flow rates, absolute humidity and heat transfer rates and solving for the incremental
changes. These changes are then added to the initial values and the solution found in a "marching out" or Euler process.
The expressions for the water surface and dry plate heat transfer coefficinets h and hDp are taken from the Dittus-Boeiter relation as used by Yadigaroglu [2].
Nu = .022 Pr Re (3-1)
For calculating fin efficiency, the packing plates were modeled as simple plate fins (shown in Fig. 2-3). Fin efficiency was then calculated from the expression:
tan hZ2h/kt
fin
Z2
(-2)
Z h/kt
The mass transfer coefficient is derived from the Chilton-Colburn
analogy between heat and mass transfer may be written: [1]
hD = hwet surface 2/3 (33)
wet surface p C
mix mix
where mix' Cmin and Sc are the density, specific heat and Schmidt number
of the air-water vapor mixture. The characteristic length used for these relations is the hydraulic diameter of the air flow channel between
the packing plates [12].
Provision was also made to allow the program to run for a completely wet and completely dry surface area. Comparison with previously published results provided a check on the program's validity [1].
Physical properties of air, liquid water and water vapor were
approximated by correlating equations [4 and 5] and/or simple curve fits [1], and may be seen in the computer listing (Appendix H).
Overall heat transfer is given by the equation:
Qtot = (T - T +m a(wout win)(TR -To ) (3-4)
in out out in
And evaporative heat transfer given by:
Qevap (mg - mi )[h - C(T - T. ) (3-5)
evapn out fgT in out
in
Where T is the temperature at which the enthalpy of the saturated liquid
to be zero. in this case T = 320F(0°C) so as to remain consistant with
o
3.2 Determination of Surface Transfer Coefficients
Certain parameters of the packing section were unknown functions
of geometry and flow conditions. Two of these, the wet-to-dry surface area ratio and the dry plate surface heat transfer coefficient, were determined in auxiliary experiments and these values used to modify the analytic predictions in the computer analogy.
The determination of Awet/Adry was done twice, before and after painting the packing plates. (See Appendix E).
Before painting the deposit buildup was easily visible on the surface and its width could be directly measured with a scale. This was assumed to be the entire extent of the wet surface area due to the "blotter
effect" noted in Appendix E. Using the observed deposit width of 0.25 in (0.6 cm) from the trough bottom and the water free surface width as
0.125 in. (0.3 cm) gives a calculated Awet/Adry of 11%.
After painting the plates a photographic method was necessary as there was no longer a measureable deposit line. The paint used was non-reflecting
and black. A columnated light source was shone down into the trough from the side. Any reflection seen would have to come from the water surface, since the water did not wet the plate and could not "climb" up the side of the trough. The reflection was recorded by a high quality single-lens reflex camera using close-up lenses for magnification. Enlargements of
the photographs showed a clear separation between water surface and plate area. These photographs, after correction for depth-of-field, show a water
surface area width of 0.134 in (0.34 cm). This corresponds to a wet-to-dry surface area ratio of 4%. This was later increased to 55% as it became evident that the same non-wetting characteristics that helped cut the
total wetted surface area were now letting the water streams wander on the upper portion of the packing plates.
This area ratio did not change significantly over the available range of water flow rates.
The dry surface heat transfer coefficient of the packing plates was checked by evaluation of the transient response of the plate temperature to a step change in air temperature. The packing plates were cooled 15 to 20'F (8-11°C) below ambient (intake)air temperature. The apparatus
exhaust fan was then started, pulling the warmer ambient air into the packing section at a known rate of flow. Local plate and air temperatures were
recorded at 10 second intervals until plate temperature approached intake air temperature.
Analysis (Ref. 8], Chapter 3) of this data (See Appendix J) indicated a dry plate surface heat transfer coefficient equal to 3.3 BU/hr-ft2°F
(160/kal/h-m2°C). This value was approximately 1.5 times higher than
the value predicted by equation 3-1 when corrected for entrance effects [16]. This increase was attributed to the highly irregular flow channel and
the high inlet turbulence from the flow straighteners and collection channels (Figure 2-1).
Two other paramters, the wet surface heat and mass transfer coefficients could not be experimentally measured but were increased by a factor of
1.5 also. This was done as the wet surface heat and mass transfer
coefficients depend on the same flow conditions as the dry heat transfer coefficient (except or the relative Reynolds number between the air and the moving water surface).
3.3 Summary of Test Data and Computer Predictions
The summary charts (Tables 3-1, 3-2) list the major points of comparison between the computer prediction and the model tower test results. For the model tower tests both air side and water side enthalpy change was calculated. On the air side:
T T T
AH =
outw
(fg +
T
outCdT)
i(hg
+ f
in
CdT)+
C
(3.6)
o 0o T a
a,
in
Where T is the reference temperature where the enthalpy of saturated
liquid is taken as zero, and where h is the latent eat of vaporization
fg
at the reference temperature. In practice the air side enthalpy change
was evaluated from tabulated values [6] of dry air ::, water vapor enthalpy.
These tables were based on T = 32°F (0°C) and for consistency this value
of T wll be used in all calculations.
0 On the water side:
TZ T9.
AH = m 9
f
in CdT - a(wut - Win) T C dT (3-7)out TZ o
out
Where the second term on the righthand side of the equation represents the enthalpy loss due to mass transfer. In practice, the heat capacity of water was taken to be a constant, 1 BTU/lbm-°F (1 kcal/kg-°C) and AH evaluated directly from the measured inlet and outlet conditions.
For energy balance calculations, the error was calculated from the equation:
AH + AH
Er a 2(
where 1/2(AH - AHz) is the average of the air and water side enthalpy changes and appears in Tables (3-1, 3-2) as Qtotal for the model tower tests.
Q was evaluated for the model tower tests from the inlet
evap
and exhaust conditions based on the thermodynamic relations:
T T
0 =am water
Qeap
=(
-
fh
+
f
aout
C dT -
w
in C dT] (3-9)
evap a out in fg T v T
T o
Assuming constant C and rearranging this can be written as:
T.
Qeyap i ( (u- [h in C(T. - T )(3-10)
evap a out in fg v kin aout
Where C was taken to be 0.4458 BTU/lbmQF (0.4458 kcal/kgQC) and hfg in
was taken from tabulated values [6].
The values of Q and Q for the computer model were calculated
evap total
from the exhaust conditions predicted by the program and are presented in the tables for each test run. A specific discussion of each table follows below.
The energy balance (AH + AH = 0) provides an indication of the validity of the experimental process. Analysis (see Section 2.5) of this particular experiment showed a maximum possible error of 15% (as defined above) based on individual instrument repeatability. In practice this limit was exceeded on several occasions. These descrepencies have been attributed to changing flow conditions. Data measurements for a typical run required approximately one hour. Water temperatures were observed
to remain fairly constant during this time as were, to a lesser extent air temperatures. The greatest problem was encountered in the humidity
data. The optical dewpoint hydrometer, while highly repeatable, was slow readiag and as much as 20 to 30 minutes could elapse between
beginning to scan the inlet section and finishing the scan of the outlet section. Water sprays, steam jets and other watery experiments in the laboratory had a noticeable effect on the air humidity content. Efforts to reduce this interference included running at odd hours and attempting
to control local sources of humidity. Reasonable energy balances were thus obtained with the larger errors blamed on unobserved humidity and air temperature transients.
This summary is divided into two parts, 5 data runs completed before
painting the packing plates and 4 runs done since that: time (see Appendix E).
Program inputs for the first part consist of ambient inlet conditions to the model tower packing section plus these approximate parameters (see Section 3-2):
~Jet/Adry= 11%
h = 3.3 BTU/hr-ft2°F (16.1 kcal/h-m2 C)
dry plate
het = 3.6 BTU/hr-ft2°F(18.0 kcal/h-m2 C)
hD = 240 ft/hr (75 m/h)
wet surface
As can be seen from the summary chart (Table 3-1), only once does the predicted evaporative heat transfer rate differ by more than 10% of the measured rate and never does the total heat transfer rate fall outside
the measured air and water side heat transfer rates.
Corrosion noted on the plates after the initial series of data runs eventually necessitated the coating of the packing plates with an acrylic
was found to be 5.5% (Section 3-2). An order of magnitude analysis shows that the resistance to heat transfer added by painting the surface is very small when compared to the convective heat transfer coefficient. Since the wet srface characteristics have been assumed to remain
the same as-before the painting, (except for the surface area ratio) all the transfer coefficients have been left as in the previous runs.
Refering to the summary chart, Table 3-2, the four runs produced good energy balances, however the correlation between measured and
computer-predicted total heat transfer is not as close as in the previous series. The experimentally measured heat transfer rate is consistently low in each of the four cases, but moves closer to the computer-predicted value in consecutive runs. By the last run (on 6/24) the difference is much less than 10% of the measured value and the predicted value well within the measured air and water side heat transfer rates.
It was speculated that a temporary resistance to heat transfer was caused by incomplete wetting of the newly painted plates. The
approach of measured to predicted heat transfer can be a "wearing in" period during which the non-wetting characteristic declined. There was no noticeable change in the wet-to-dry surface area ratio.
As Table 3-2 shows, the evaporative heat transfer predictions match closely with the measured values in each run.
From these results it was concluded that the agreement between the analytic (computer) model and the heat transfer model tower test results were good enough to permit the use of the computer program (listed in Appendix H) to generate data for the comparisons in Chapter 4.
TABLE 3-1
Comparison of Computer Program and Model Tower Test Results -Unpainted Packing Plates Aet/Adry = 11%, Galvanized Plates
wet dry TD Qtotal (F) BTU/min Qevap BTU/min Air Side Heat Trans-fer (BTU/min) Water Side Heat Trans-fer (B'U/niin) 43.7 839 875 36.7 677 700 38.1 759 765 43.3 935 955 44.5 877 900 Run Date Qtot Qevap (%) Energy Balance Error (%) 3/19 measured computer 3/22 measured computer 3/23 am measured computer 3/23 pm measured computer 3/25 measured computer 48 53 50 51 405 460 336 358 427 402 490 526 463 481 738 638 750 835 844 939 727 768 1017 909 24 13 2 18 7 56 53 52 55 55 54
TABLE 3-2
Comparison of Computer Program and Model Tower Test Results -Painted Packing Plates
AwetlAdry = 5.5%, Plates coated 0.001 in Crylon
R paint ITD Qtotal (F) BTU/min Qevap BTU/min Air Side Heat Trans-fer(BTU/min) Water Side Heat Trans-fer(BTU/min) 42.3 544 654 53.7 755 366 52.8 701 771 28.0 380 400 Run Dates Qtotal Qevap (%) Energy Balance Error(%) 518
5/6
measured computer5/11
measured computer 5/25 measured computer6/24
measured computer 571 812 279 278 440 371 316 305 195 171 697 51 43 58 43 45 40 51 43 653 413 10 15 14 17 749 346CHAPTER 4
PERFORMANCE COMPARISON FOR VARIOUS COOLING TOWER COMBINATIONS
This chapter compares the performance for a given power plant of the two most widespread types of cooling towers used today, the
evaporative (wet) and the non-evaporative (dry), with that of the V-trough
packing design developed in this project (wet-dry) (see Section 2-1).
To generate the data necessary for these comparisons an idealized design has been made of each tower type (Appendix D). Each of these designs
is sized to give the same hot water temperature drop and total heat transfer rate for a set of fixed design inlet conditions. The designs have then been evaluated by computer analogy under a number of differing inlet conditions and the results (evaporation rate, heat transfer rate, exit air conditions) used as a basis for the following comparisons.
Also included are the combination-type towers used by some designers to overcome the disadvantages of single wet and dry systems. Studies of these [13] systems are very promising and the main thrust of this chapter is directed toward the analysis of these systems.
1.1 Description of Combination-Type Systems
A combination tower design consists of two individual cooling towers in parallel or series connection, each bearing a share of the heat load
requirement. Towers can be inter-connected in several different ways
(Figure 4-1), but for simplicity it was assumed that each tower acted independently and received its share of the hot water to be cooled at the same temperature as in Figure 4-1C. In this analysis, the designs use a dry tower sized so that it alone can handle the required heat load
__
__
_ __
__
_
_-1
S.-.a) = s: CL CL S- .- II 4) o I ( Ixr
uj,- 4 -- -i 1 CI Eu · a - s. s-S- S -D3 @ S-a)>3
.-
O
C00
->0
LIJ 1--L:
C, (1)0
C~t-0
0
a;0
4 1 a)_I 4) 1 c I aj 4) 0 4-) U-,.CO
a) F-., C LL0
3
O o * O .rl ou
o 0 u O S-a) 4, -C 4-I a) Cc
'-4 U- S.-u, C) a0
(_)0
4-) (..) -- -i w _IS- S-L L m I r I ac
x I
xl
W I W I = S-- --C 4A . S o0 o U1 00- );
S
-orn.,
'o W -0-H r0 C rL n 44.
0
'
s
'
*H 0 4 " t-· n I W) U) -0 Lla S.-) __ 5 c 4-) (O OS -t3
>
L - cr--, WQ . - I.C
I--e.
.
· ~- c ~ £0
.) C) - -LLV-- 0
; oD F
r--o
->
o
W F-oo
o
c a) o00
0 '-4 0O3
t
_~
o10
I S-a) (A Uo
4-a j _ Q-1 U)0
0
C-) = =I -
_ . I I I I - -I IG
I -.0-below a certain ambient dry-bulb temperature, and a wet tower which is added only at higher ambient temperatures when the dry tower is unable to carry the entire heat load alone. This design has the advantages of being much lower in cost than a single dry tower sized to handle the
fixed heat load at all operating conditions [13] while evaporating much less water than a single, equivalent wet tower.
The advantages of this concept are such that it was decided to include combinations of dry and wet-dry concept towers (described in this work) which would also reflect some of the advantages of the con-ventional dry and wet tower combination systems.
For the purposes of this comparison, it was assumed that the basic component towers (dry, wet, wet-dry) could each be linearly employed; that is, if a certain tower could transfer heat at a rate Q under one
set of ambient conditions, and at a rate 2Q at some other ambient condition, it would be possible to simply take one-half of the tower out of service
to keep the heat transfer rate constant at this second set of conditions. The fan power and water loss would also be reduced by the same fraction.
This assumption is more accurate when applied to large cooling tower systems which consist of many controlable units than when applied to a single tower.
The following eight representative combinations will be compared and referred to by the names listed here.
1) DRY tower: completely non-evaporative, this tower transfers all heat by forced convection;
85% of its heat load through latent heat of evaporation with the remaining heat transfer due to convection from the water surface;
3) WET/DRY tower: V-trough type packing with a wet-to-dry surface area ratio of 5%. This configuration is similar to the model
tower which was built and evaluated at M.I.T. within the last year.
4) WET + DRY @ 800F: a DRY tower sized to handle the design heat
load below 80F dry-bulb (27QC) inlet air and a WET tower to help carry the design heat load at higher ambient temperatures.
5) WET + DRY @ 60F: similar to (4), with the DRY tower sized at
609F(16°C) inlet air and the WET tower added at higher ambient
temperatures.
6) WET + DRY @ 400F: similar to (4), with the DRY tower sized at
400F (4CC) inlet air and the WET tower added at higher ambient
temperatures.
7) WET/DRY + DRY @ 60OF: a DRY tower sized to handle the required heat load at 60QF (16'C) inlet air and a WET/DRY tower to help
carry the design heat load at higher ambient temperatures.
8) WET/DRY + DRY @ 40°F: similar to (7), with the DRY tower sized
at 40F (4°C) inlet air and the WET/DRY tower added at higher
ambient temperatures.
Performance for each of these configuations was evaluated by means of the computer program listed in Appendix H using the individual design parameters given in Appendix D.
4.2 Performance Predictions
The following sections and figures compare various aspects of
performance for the combination cooling towers described above. For the most part these comparisons are based on a constant rate of heat rejection
and a constant inlet hot water temperature for each system being
evaluated. At high ambient temperatures both components of a combination system share the heat load, with the DRY component operating at its
maximum capacity for those conditions and the evaporating (WET or WET/DRY) component making up the rest of the requirement,
As the ambient temperature decreases, the DRY component carries an increasing portion of the fixed heat load as the evaporating tower is cut back to hold the system heat rejection rate constant. When the DRY component sizing temperature is reached, the DRY tower carries the entire heat load and the WET component is completely shut down. Only for
temperatures below this point is the DRY component capacity reduced in order to maintain a constant system heat rejection rate.
Use of these graphs must be tempered with the knowledge that each basic tower type (DRY, WET, WET/DRY) has a different mechanism for heat
transfer. Usual heat exchanger performance comparison parameters may be misleading when applied to a WET or WET/DRY tower due to the portion of heat transferred by evaporation. For this reason, no attempt has been
made to consolidate the findings into a single figure or section, but rather many views of system performance are presented, with overall conclusions appearing below.
4.2.1 Heat Transfer Rate
Figure 4-2 shows the variation of the overall heat rejection
capabilities of the three basic designs with inlet dry bulb temperature. These and the following performance curves were taken from data
calculated by the comptuer program listed in Appendix H.
DRY tower heat transfer rate under these conditions is linearly dependent on the initial temperature difference (ITD) between the
ambient air and the inlet hot water. Thus the total heat rejection
rate at Tamb = 90F (320C), ITD = 400F (22°C), would be half that at
Tamb = 50F (100C), ITD = 800F (449C), etc.
The WET tower has two heat transfer mechanisms which must be taken together to determine the overall heat transfer rate. One, dry convection from the hot water surface is essentially the same as that of the dry
tower above, decreasing linearly to zero as T = T This mechanism,
amb 9, This mechanism,
in
however, makes up only 15% of the total heat rejection on the average and thus has small influence on the total performance of the tower. The major portion of the heat load is transferred by evaporation which varies linearly as to the difference of the partial water vapor pressures of the ambient air and inlet hot water. For most of the operating range of the WET tower, this difference is a strong function of the inlet hot water temperature due to the non-linearity of the temperature-saturation
pressure curve for water. Only at ambient temperatures close to the inlet hot water temperature, does the moisture content of the ambient air
become an important parameters (Figure 33).
The combined result of these two mechanisms gives the WET tower a fairly flat performance curve over most of its operating range.
Fig. 4-2 A
Total and Evaporative Heat Transfer Rate
DRY Inlet Air vs Temperature Thot water= 130 F (53 C) Inlet Air 40% R.H. a i 4 C r~--- -Design Point WET/DRY "I
W
(C) (F) 40 60 80 100 120Inlet Air Temperature
Fig. 4-2 B
Total and Evaporative Inlet Air
u,,4- T.CC D,+-- VS , T m-.+ -.. p r-a UrOL 100 F (38 C) 40% R.H. C7
r-cr
oL 0 JFT/DRY 10 20 1 30 40 50 (C) I I I 1 60 80Inlet Air Temperature 3.0 2.5 2.0 C C' 5 1.0 0.5 1.5
1.0
0.5 40 I I 100 I 1 0120 (F) _ C', (A (UFig. 4-2 C
Total and Evaporative Inlet Air
Heat Transfer Rate . Temperature
CY
_-\DRY Thot water= 160 F (71 C)
+I~ro
hot water
WET/DRY - Inlet Air @ 40% R.H.
-WET WET/DRY IJ O 4 40 10 I I I- I I I6 60 20 I 30 I 180 80 40 I 100I 100 120
Inlet Air Temperature
Fig. 4.3
Variation of Total wth Relative
Heat Transfer Rate Humidity
Thot water= 130 F (53 C) hot water DRY 10% R.H. 90% R.H. 10 I - I I I
I
I
I
I I !6 60 20 30 L i I v 30 40 i I - 1 100 50 I 120Inlet Air Temperature 3.0 2.5 2.0
.5
c
cn V) 0) 1 r" crcr
1.0
0.5 50 i (C) (F) 2.5 2.0 1.5 cr Cr CD,1.0
0.5 90% WET 0 I 40 (C) (F) IFor the WET/DRY tower, the same two mechanisms for heat transfer are also operating, but their proportional share of the heat load has been changed. On the average about 60 to 70% of the heat load is
rejected by dry convection with the remaining 30 to 40% rejected through evaporation. Thus the WET/DRY tower seems to behave much more like the DRY tower, where overall capacity increases with the ITD. The WET/DRY
tower is also less affected than the WET tower by ambient air moisture content at high ambient air temperatures (Figure 4-3).
4.2.2 Air Flow Requirements
Figure 4-4 compares the required air mass flow rates of the various designs using a purely WET tower as a basis. Heat load is held constant
here at Q and the combination towers are employed as described in Sec.
design
4.1. Air mass flow is proportional to fan equipment and power consumption as well as overall tower size.
For a DRY tower the necessary air mass flow increases rapidly as the initial temperature difference is reduced,
The WET + DRY combination towers behave as a purely DRY tower until they reach the temperature for which the DRY portion was sized. Above this design point the rate of increase of the air flow rate is reduced as the WET portion now takes a growing share of the heat load.
The WET/DRY tower operated above the WET tower flow rate, but well below those of the WET + DRY towers in all cases. It also exhibits much less of a tendency to rise at higher temperatures than does the DRY tower.
The WET/DRY + DRY towers require slightly more air flow than the WET + DRY towers with the same all-dry design temperature. This was due to the reduced evaporative share of the heat load and the higher air flow requirements of the WET/DRY tower over a WET tower,
O 0 '- q+ m ob
> +
fif 0 0 In .4+40
o
0
0
0:
c.
C,
Lw4
e
W W Irt ! ,:r L. L-D D 4 o =r r to S. .r-I 4iI-c
C 0 '.0 0This graph does not take into account air pressure drop across the tower which is an essential parameter of pumping power costs.
4.2.3 Water Consumption
Figure 4-5 compares the rate of water consumption of the various towers for a fixed heat rejection rate using a purely WET tower continuously
operating at 90°' dry-bulb (32CC), 40% R.H, for comparison. Inlet hot
water for all towers was assumed to be constant at 130°F (54°C).
The combination towers of both WET + DRY and WET/DRY + DRY
configurations consume no water until inlet conditions rise above the DRY component design temperature at which time the evaporating component must be brought into service. The water consumption rates for all designs
then rise to meet where Ta 130aF (54°C), at which point all heat
transfer must be done by evaporation.
The WET/DRY tower has a relatively constant consumption rate in the lower operating ranges, but begins to consume more water as inlet air temperature increases and the convective heat transfer rate is reduced.
All the combination towers and the WET/DRY tower consume much less water than a WET tower under the same conditions. All WET/DRY+ DRY
systems consume far less water than similar WET + DRY systems having the same DRY tower design temperature.
The variation of water consumption rate with ambient and inlet hot water temperature was investigated as one means of optimizing the wet-dry design. The WET/DRY tower used in the previous comparisons was evaluated
Lo Li_
o o
LL
LL_
C - u L I-4 aJ )*_
4 Q4_
@E
I,%. LL > rr-c rc 00 Eo · 3 · a 4) 34-ao,06 aaMO4 laM..M/.. M
0
o o
4) .-E I-C:)c
0D 00 _ 10 _ _ _ 0· Cwith varying inlet temperatures and fixed heat load. The results appear
in Figure 4-6.
As an example, for the T. = 130OF (54aC) curve, water consumption is
in
seen to rise with ambient air temperature as more of the tower comes
on line and evaporation takes over a growing share of the heat load.
Finally, at 900? (320C), the WET/DRY tower is operating at full capacity.
Any further increase in ambient air temperature would cause the tower heat transfer rate to drop below the fixed heat load consumption of the
WET/DRY tower for fixed hot water inlet temperature of 1300F (54°C) over
a range of inlet air temperatures.
The same procedure was followed for T. - 1200F (49QC), 110°F
in
(43QC), and 100F (38°C) with the same tower design. These curves also appear in Figure 4-5. The endpoints and the dashed line represent water consumption and inlet air temperature when the design is allowed
to run continuously at full capacity under a fixed heat load.
A WET/DRY tower system, optimized for minimum water consumption, would therefore be run at maximum capacity whenever possible, and only cut
back when T (and thus turbine back pressure) falls below an acceptable
in
level. This also minimized turbine back pressure under all operating conditions and increases power plant gross output.
Running the tower system at full capacity also means higher operating and maintenance costs, but these should be more than offset by reductions in power generating costs.
Fiq. 4-6
Variation of Water Consumption Rate
with Inlet Air and Water Temperature
Q=QDesign Inlet Air @ 40% R.H. :er )n /
/00-10 20 I 30 I 40 (C) I 60 Inlet Air 880
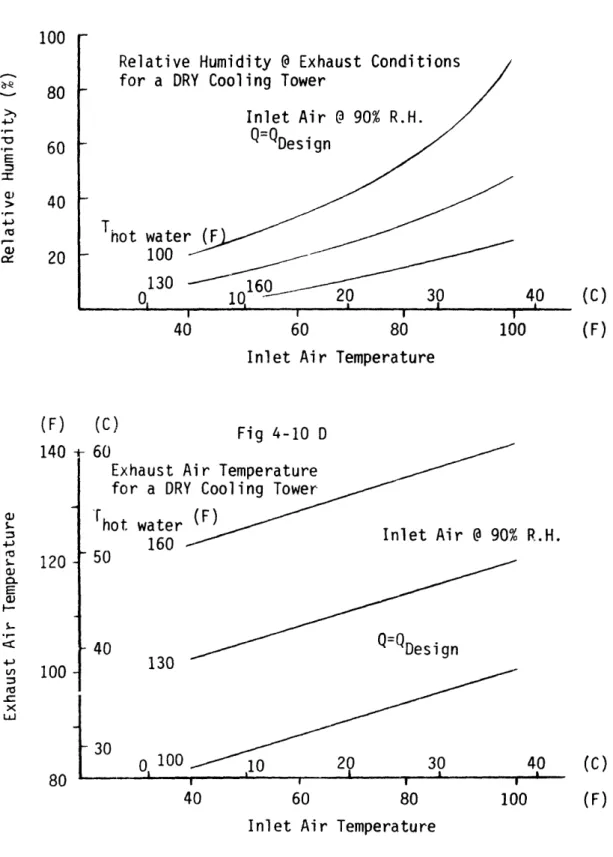
Tempera ture 0.6 0.5 .-r, o ~ 0.4 -0.3 0.2 I Thot wa - 130 120 11n 40 iOO (F) ·Figures 4-7 A,B,C,D compare the monthly water consumption rates of the various systems for locations around the country. All systems
had a constant heat load,inlet hot water of 130°F (540C), and were again
compared using a WET tower working at 900F (329F) for a basis.
Water consumption for all designs in general climbs during the summer months and declines during the winter. It can also be seen
that the WET + DRY @ 60°F and the WET/DRY + DRY @ 400F designs have
approximately equal water consumption in each location.
Climatic data were summarized from reference [14] and individual configuration performance under various conditions (evaporation rate, heat transfer rate, etc) taken from the preceeding figures. This use of hourly temperature distributions gives an accurate description of the weather conditions under which towers would be operating and makes possible this sort of analysis.
Please note that each value is a monthly consumption, independent of the preceeding and following months. For clarity the curves are continuous rather than stepped.
Figures 4-8 A,B represent the yearly totals of the monthly water consumption values shown in figures 4-7 A,B,C,D.A WET tower operating at 90F (32"C) was again the basis.
The WET/DRY tower is shown to consume approximately 60% less water than a WET tower under the some conditions. The consumption totals for the WET + DRY @ 40°F are also fairly close for most locations, and about 90% lower than a comparable WET tower.
Fiq. 4-7 A
Seasonal Variation of ater Consumption Rate for Albuquerque, N.l. ign er= 130 F (54 C) ter IET/DRY RY 40 F RY 60 F + DRY 40 F + DRY 60 F J F M A M J J A S 0 N D J iMonths of Year Fi. 4-7 B
Seasonal Variation of ater Consumotion Rate
for Boston, rlass.
WET
~,..__j/
Q=QDesign
Thot water= 13o F (54 C)
WET/DRY RY 0 40 F RY O 60 F DRY rq tO F DRY 60 F 3 F M A M J J A S 0 N D J Months of Year ., 3tO -0 .) (. 1.0 0.8 0.6 0.4
0.2
1.0
,n.o
V) to . . 0.80.6
0.4
0.2Fig. 4 -7 C
Seasonal Variation of Water Consumption Rate for New, N.Y.
(54 C)
' An r
Q 6 0 F DRY @ 40 F DRY @ 60 F J F M A M J J A S 0 N D J Months of Year Fig.4 -7 DSeasonal Variation of Water Consumption Rate for Los Angles, California
WET
Q=QDesign
Thot water= 130 F (54 C)hot water
, WET + DRY I.WFT -+ nRV @40 F G 60 F DRY 40 F DRY @ 60 F J F M A M J J A S 0 N D J Months of Year 1.0 0.8 (A
-o
c)X cu 0.6 0.4 0.2 1.0 0.8 0.6 (O -o r3 . 0.4 0.2W.C./W. C wet tower 90F wet t oter O( 9()F ,C WET/DRY + 40 WET/DRY + (a 60 F I {.F-DRY F ".D F -W.C./W C wet tower 90F ix.) <2C 0 P~~~~ I I I I WIT t WET t DRY (d 40 WET + DRY @ 60 F WET -' DRIY (d8 tO F
I
WEI/DRY WET/DRY + DRY (A 60 i WE1/DRYI + Dtk kP 40 1F ') (D ., .. i W. C./W.Cwet towor (a 90Fo
o
-I
WI T F i, Jtl . -%,, t I Qj Lz .i .,) I . ./) ( j If I-)! 1 / Dlk f 4 i;'? ry +- i 1!(Y I) i 0-o
C() IT) . , WET 1-is J D -3 'I 3 1-3 3 S ) ( (; 40 F ( ;i) F ;y -I -DRd , D )R) -F ,-t CD 0 ct :33 _ -t --0 I 0-) I I -v4.2.4 Minimum Turbine Back Pressure
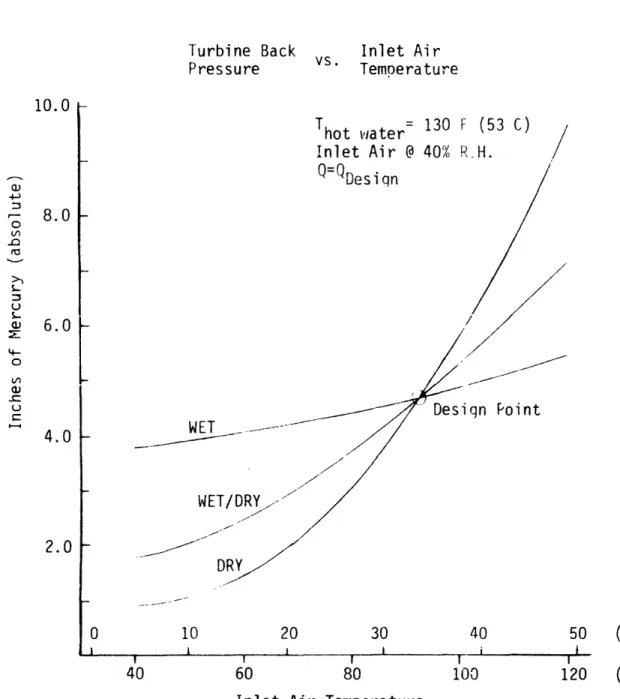
Figure 4-9 shows the variation of condenser pressure with inlet air temperature for the three basic component towers, At lower ambient temperatures it is possible, by running the towers at full capacity, to reduce the hot inlet water temperature while maintaining the design heat rejection rate.
The inlet hot water temperature is related to the turbine back pressure and overall power plant efficiency. Modern turbines can have
an operating range from 1.5 up to 15 in. of Hg (300-1300 N/m2 ) back
pressure with efficiency decreasing and capital costs increasing very rapidly for designs above 5 in. of Hg. (600 N/m2). Most turbines now being installed are low back pressure designs.
Note that the DRY tower is extremely sensitive to ambient temperature and requires very hot water above the design point of'
90F (320C) inlet air. The WET/DRY and WET towers are respectively
less sensitive and could continue to deliver full service at higher temperatures.
In practice, the inlet hot water temperature would be allowed to "float" with ambient conditions, rising or falling until the turbine design limit is reached. At low ambient temperatures where the turbine back pressure is likely to drop below the design limit, the tower
sys-tem capacity would be reduced to maintain the minimum back pressure,
At high ambient temperatures where maximum turbine back pressure would be exceeded, the generating turbines would be throttled back to reduce
the total heat load requirement to within the capacity of the tower system under the prevailing ambient conditions.
Fig. 4-9 Turbine Back Pressure Inlet Air VS* Temoerature T - 1 - /Cn r\ Design Point DRY 20 i 60 30 80 40 100
Inlet Air Temperature 10.0 4-) -U av I_

![[PDF] Cours vba Access avec explications et exemples pour reviser ensemble | Cours access](data:image/gif;base64,R0lGODlhAQABAIAAAP///wAAACH5BAEAAAAALAAAAAABAAEAAAICRAEAOw==)