The MIT Faculty has made this article openly available.
Please share
how this access benefits you. Your story matters.
Citation
Choi, Wonjoon, Joel T. Abrahamson, Jennifer M. Strano, and Michael
S. Strano. “Carbon Nanotube-Guided Thermopower Waves.”
Materials Today 13, no. 10 (October 2010): 22–33. © 2010 Elsevier
Ltd.
As Published
http://dx.doi.org/10.1016/S1369-7021(10)70183-8
Publisher
Elsevier B.V.
Version
Final published version
Citable link
http://hdl.handle.net/1721.1/96092
Terms of Use
Creative Commons Attribution
thermopower waves
Thermopower waves are a new concept for the direct conversion of
chemical to electrical energy. A nanowire with large axial thermal
diffusivity can accelerate a self-propagating reaction wave using
a fuel coated along its length. The reaction wave drives electrical
carriers in a thermopower wave, creating a high-power pulse of as
much as 7 kW/kg in experiments using carbon nanotubes. We review
nanomaterials designed to overcome limitations of thermoelectricity
and explore the emerging scientific and practical outlook for devices
using thermopower waves.
Wonjoon Choia,b, Joel T. Abrahamsona, Jennifer M. Stranoa, and Michael S. Stranoa*
a Department of Chemical Engineering, Massachusetts Institute of Technology, Cambridge, MA, 02139, USA b Department of Mechanical Engineering, Massachusetts Institute of Technology, Cambridge, MA, 02139, USA
*E-mail: [email protected] Correspondence should be addressed to M. S. S.
German physicist Thomas Johan Seebeck, with the discovery of the phenomena that bears his name, is considered the father of thermoelectricity. Seebeck stumbled upon his discovery by creating a circuit composed of two divergent metals, with junctions at different temperatures that would retract a compass magnet—the detector of electrical current for 19th century
physicists. Uncertain of what he had discovered, Seebeck initially believed his effect contributed to magnetism; however, he soon realized an electrical current was produced causing the deflection of the magnet. Today, the theory of the thermoelectric (TE) effect is largely understood and constitutes the direct conversion of a nominally steady-state temperature gradient to electrical current, or the corresponding reverse process.
The charge carriers in metals and semiconductors, such as electrons or holes, diffuse from the hotter side to the colder side when a temperature gradient is applied (Fig. 1a). A temperature difference at the junction of two electrodes generates an electrical current as per the Seebeck effect. Conversely, an electrical current drives a temperature gradient in the reverse (or Peltier) effect.
There are several driving forces that determine the current density through a conductor. The electric field and chemical potential contribute to the current proportional to the conductivity of the solid. Onsager reminds us that there is a driving force related to the temperature gradient across the conductor, and the resulting current is proportional to a coefficient, L12.
(1) (2)
E =
+
Current density: Je = σ For Je = 0E
E =
+
Δ
Δ
Δ
μ
σ
L
12L
12T
T
Field Chemical potential Temp
Conductivity Onsager coefficient
Seebeck coefficient (Γs) e
At zero current density, one can calculate the electric field that is induced across the conductor subjected to a temperature gradient, and it is proportional to L12/σ. This parameter is also called the Seebeck
coefficient, Γs. For one-dimensional conductors, an induced voltage is
calculated from a generic temperature gradient via v =
∫
T T H CΓs dT, or if Γs is constant and the gradient linear, v = Γs (TH - TC) (3)
Here, V is the voltage developed, TH is the hot, and TC is the cold
boundary condition of the junction.
A TE figure of merit, a criterion of performance of TE materials, is derived from ZT = Γ—s k 2 σ —T– (4)
Here, k is thermal conductivity of the conductor. Conventional TE devices generate power in the ranges of μW to mW and find applications1 in heat pumps, refrigeration, and aerospace. Efficiencies
are generally acknowledged to be low, limiting widespread application2.
In recent years, nanostructured materials have played a central role in advancing TE figures of merit3. Theoretical and experimental studies
have been conducted on nanoscale heat transfer4and electronic
properties5 of TE materials. Theoretically, the Dresselhaus group has
proven theoretically that lower dimensional systems could achieve higher figures of merit6, comparing the maximum figures of merit
of bismuth telluride in bulk (ZT≤0.5)7, quantum wells (ZT≤5)7, and
quantum wires with 5 Å diameter (ZT≤14)8. Later, they reported a
model where the smaller diameter and trigonal axis of Bi nanowires could significantly enhance their ZT9,10. More recently, nanostructures
in SiGe were shown to increase the power factor (Γs2× σ) 2 times
under 1000 K, resulting in an increase of ZT in comparison to SiGe without nanostructures11.
Among many nanomaterials, Bi-based materials have captivated the interests of researchers due to their superior TE properties. Poudel et al.12
Fig. 1 (a) Schematic of measurement of conventional TE effect (top) and core/shell nanostructure launching a thermopower wave (bottom). Scanning electron microscopic images of microdevices for thermal transport measurements of (b) individual multiwalled nanotubes (MWNT) and (c) single-walled carbon nanotubes (SWNT). (d) Comparison of TE power generation (MWNT bulk materials, individual SWNT, individual MWNT, and graphite) between 0 K and 958 K. Linear fitting was used on the basis of experimental data. (Part (b,d) reprinted with permission from33-34 © 2001, 2007 American Physical Society. Part (c) reprinted with
permission from23 © 2005 American Chemical Society.)
(b) (a)
(c)
showed the highest ZT of 1.4 at 100 ˚C in BiSbTe bulk alloy, whereas Bi2Te3 thin films have ZT = 0.83 at room temperature14. Another TE
criterion, the Seebeck coefficient, turned out to be larger in Bi nanowires (260 μV/K)13 than in other structures such as BiSbTe bulk alloys (220
μV/K)12 or Bi
2Te3 thin films (188 μV/K)14, without having higher ZT.
Lin et al.14 demonstrated that decreasing the diameter of nanowires
and adding 5% Sb enhanced the Seebeck effect in Bi1-xSbx nanowires of
diameter 40 nm (-64 μV/K) and 65 nm (-57 μV/K), compared to pure Bi nanowire arrays of 40 nm (-55 μV/K) and 65 nm (-48 μV/K). All these forms surpassed the Seebeck coefficient of bulk Bi1-xSbx (-45 μV/K).
However, scaling up Bi-based materials for practical application has proven difficult, prompting the consideration of other materials for TE energy generation. Silicon nanowires15 and p-doped silicon nanowires16
have a usable ZT, 0.6 at 300 K, and 1.0 at 200 K, respectively, an improvement of a factor of 100 over bulk Si. A core/shell structure of Ge/Si with p-doping has been recently predicted to enhance ZT up to 0.8517. Also, the Seebeck coefficients of other nanostructured materials,
such as ZnO (-400 μV/K)18, GaN (-40 μV/K)18, PbTe thin films (620
μV/K)19, PbSe (193 μV/K)20, and InSb (-220 μV/K)21 have been studied
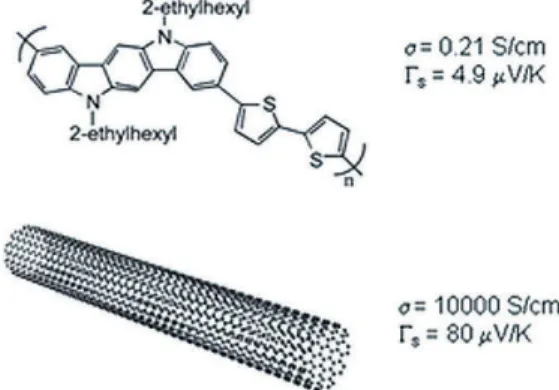
widely. Among one-dimensional conductors, including conjugated polymers and carbon nanotubes (CNTs), Seebeck coefficients are generally too small22, as shown in Table 1, largely excluding these
materials as viable candidates for TE devices.
Carbon nanotubes as thermoelectric devices:
the current state of the art
CNTs have been explored as components of TE devices due to their high axial thermal conductivity (3000 W/m/K)23-25 and electrical
conductivity (10000 S/cm)26,27 in high aspect ratio, one-dimensional
structures28,29. As shown in Fig. 1a30, in a typical experiment, a
thermoelectric conductor is placed between metal contacts that are temperature-controlled31. As the temperatures of the contacts are
varied, a multimeter or oscilloscope can then measure Seebeck voltage and/or current that is induced by the temperature gradient.
Hone et al.32 measured the thermal conductivity of crystalline
ropes of single-walled carbon nanotubes (SWNT) to be only 35 W/m/K at room temperature. They found that the thermal conductivity is dominated by phonons at all temperatures with a mean free path on the order of 1 μm. Kim et al.33 and Yu et al.23 were the first to
measure thermal conductivity and Seebeck coefficient in an individual multiwalled carbon nanotube (MWNT) and a SWNT, respectively (Fig. 1b, c). By contrast, the thermal conductivity of individual nanotubes is much higher, 3,000 W/m/K for MWNT and as much as 10,000 W/m/K for SWNT. However, the Seebeck coefficient for MWNT, 80 μV/K, is higher than that of SWNT, 40 μV/K. While these measurements were in the temperature range of 10 K to 300 K, Zhang et al.34extended this work by comparing consolidated sintered
MWNT mats with individual MWNT and SWNT up to 958 K (Fig. 1d). Even though the Seebeck coefficients of all types of nanotubes are higher than graphite, MWNT mats demonstrated relatively lower Seebeck coefficients (10 μV/K) than individual MWNT and SWNT due to the low charge carrier concentration that can freely move in bulk materials. Doped CNTs have also been considered as candidates to enhance the TE effect35-37. Doping can change CNT conduction from
p-type to n-type, but has not been found to increase the Seebeck
coefficient. The overall TE figures of merit of CNTs have not been competitive in comparison to renowned TE materials such as bismuth telluride (287 μV/K)38-40, silicon nanowires16, or Bi
2Te3/Sb2Te3
superlattices (243 μV/K)41.
Lately, new mixed structures of CNTs and other materials, including integration into MEMS devices, have been receiving engineering attention. The Seebeck coefficient of a CNT sheet coated with polyaniline (Fig. 2a) is remarkably higher (22 μV/K) than that of both of bulk parent samples (Fig. 2b)42 (12 μV/K for CNTs, 3 μV/K for polyaniline). Van et al.43 integrated a CNT/Au junction in a
micro-thermocouple but did not find any difference in Seebeck coefficient or TE performance (Fig. 2c, d). More recently, the Seebeck coefficient of graphene (up to 80 μV/K) has been reported44,45. Thus, the TE
Table 1 Conductivities and Seebeck coefficients for example conjugated polymers and multiwalled carbon nanotubes
performance of CNTs lags significantly behind inorganic nanowires despite these advances. The simultaneously high phonon and electron conductivities in CNTs, combined with their low Seebeck coefficients, limit their use in these applications.
A new concept: thermopower waves guided
along nanowires and nanostructures
The challenge with conventional TE devices is maintaining a large thermal gradient while allowing a large electrical current to flow through the interface. In devices designed to harvest electrical power from waste heat, the goal of materials scientists has been to select materials that conduct heat primarily as phonons but block their propagation across an interface where electrical conduction is large. An alternate means of creating a large thermal gradient, even in a material that conducts both heat and electrical current well, is to create a self-sustaining reaction wave46 (Fig. 1a). This can be achieved by thermally
coupling an exothermic fuel with an anisotropic heat conductor, as depicted schematically in Fig. 3a.
Mathematically, a chemical reaction wave coupled to such a conductor can be represented with equations describing thermal transport in the fuel (5), thermal transport in the anisotropic heat conductor (6), and the reaction of the fuel (7)46.
∂ — ∂— u – τ1 = ∂ — ∂ 2 —u ξ21 + (1 – η)e –1/u 1 – γ1 (u1 – u2) , (5) ∂ — ∂— u – τ2 = α0 ∂ — ∂ 2 —u ξ22 + γ2 (u1 – u2) , (6) ∂ — ∂ η τ — = β(1 – η)e–1/u 1 , (7)
Here subscript “1” refers to the fuel, and “2” refers to the anisotropic conductor. All in non-dimensional terms, τ is time, ξ is space, u is temperature, η is extent of reaction of the fuel, γ is the interfacial conductance between the two materials, and α0 is the ratio of the thermal diffusivities of the anisotropic conductor to that of the fuel. β is the inverse adiabatic temperature rise of the reaction, equivalent to –C –Q— p R — Ea
, where Cp is the specific heat of the fuel, Ea is the activation energy of the reaction, R is the universal gas constant, and Q is the enthalpy of reaction. In this simplest form, the equations neglect convection and radiation.
The parameter β is a significant factor in determining wave properties, such as the average velocity or the presence or form of velocity oscillations47. In this coupled system, α
0 determines the
Fig. 2 (a) Electron micrographs of thick pristine carbon nanotube sheet (left), and polyaniline (PANI) coated sheet (right). (b) Seebeck coefficients of two parent materials (CNT sheet, PANI) and new nanocomposite (PANI-coated CNT sheet). (c) Scanning electron microscopic images of Au-CNT (thermally coupled) device. (d) TE voltage across the junctions of Au-CNT thermocouple plotted as a function of temperature. Calculated Seebeck coefficient is also shown. (Part (a,b) reprinted with permission from42 © 2010 Wiley. Part (c,d) reprinted with permission from43 © 2010 IOP.)
(a)
(d)
(b)
(c)
acceleration of the reaction wave. Fig. 3b demonstrates this with simulation results from the numerical solution of equations (5-7) for a variety of conceivable fuels (β values) and thermal conduits (α0 values). Most fuels have low thermal diffusivities in the range of 10-9 to 10-7 m2/s48-49, resulting in relatively slow chain reactions. For
fuels reacting without a thermal conduit, α0 = 1, and the wave is not
accelerated. However, in this coaxial structure, a nanostructure with high thermal conductivity can rapidly transfer heat along its length, transporting energy to initiate reactions in the unreacted fuel. This mechanism accelerates the one-dimensional chain reaction wave anisotropically in the surrounding fuel layer.
If the thermal conduit is also electrically conductive, the reaction wave will generate a large pulse of electrical energy accordingly. The reaction wave maintains an extremely large temperature gradient between reacted and unreacted regions, enhancing the TE effect. In addition, the rapid reaction propagation could entrain charge carriers, which may also affect the generation of electricity. This is the principle of the thermopower wave (Fig. 1a), recently proposed to overcome
certain limitations of TE energy conversion46. Further details of the
physical explanation will be discussed below.
Carbon nanotube guided-thermopower wave
Simulation
To understand anisotropic reaction waves, the wave velocity is the most important component to predict. The first simulations with one-dimensional reactions coupled to thermal conduits established that interfacial heat transfer between the fuel and conduit did not generally limit wave velocity50. A study of the theoretical limit of such a coupled
system, a one-dimensional harmonic or anharmonic bead-spring array, demonstrated the bounds on the reaction activation energy and fuel loading needed to produce stable reaction waves with velocities greater than 1 km/sec51. Later, the parameter space for the average velocities of many fuels and thermal conduits was mapped (Fig. 3b). Large thermal diffusivities in the conduit and low values of β increase velocity.
More recently, time-dependent oscillations in wave velocity were explored for a particular thermal conduit, a CNT with thermal diffusivity of 10-3 m2/s52. Previously, velocity oscillations had been
studied for reaction waves without thermal conduits; Weber et al. found that only a certain range of β values would produce oscillating reaction waves47. For a coupled reaction wave and CNT thermal
conduit, velocity oscillations have negligible amplitude for β ≤ 6, above which the amplitude increases linearly. The fundamental frequency of oscillations decreases exponentially with increasing β, and the form of oscillations changes from approximately sinusoidal to more complex, multi-component forms. This transition occurs around β = 8. The simulated frequency spectra of velocity oscillations matched well with those of voltage oscillations observed in cyclotrimethylene-trinitramine (TNA), which has β = 10.6, reacting on MWNT.
The limit of thermopower produced from just the Seebeck effect can be derived from simulated temperature gradients. A conventional TE equation can estimate the electrical specific power, P/Mt, but still dramatically under-predicts the actual performance of many thermopower wave devices by several kW/kg.
P — Mt = Ri —ρ—S 2 — πr— 2L ⎛ ⎜ ⎝
∫
L 0dT
—
dL
dL ⎞ ⎟ ⎠ 2 (8) where S is the Seebeck coefficient of the nanowire, Riis electrical resistance, ρ is the density of the nanowire, r is the radius of the nanowire,L is the conduction length, and T is spatially defined temperature. A
fast-moving temperature gradient will somewhat affect this equation by maintaining a high temperature in the reacted fuel region behind the front, and thus a large temperature gradient. On the other hand, a slow reaction wave allows the reacted region to cool on the same time scale as the wave propagation, creating a temperature gradient in the opposite direction, and thus a thermopower voltage with opposite sign that tends to reduce the net power. However, even accounting for this effect and assuming the maximum possible temperature gradient (as defined by β),
Fig. 3 (a) Schematic of a coaxial nanocomposite for anisotropic reaction waves. An exothermic chemical fuel (EM) is wrapped around a thermal conduit, such as a nanotube or nanowire. Initiation at one end of the conduit induces a one-dimensional chain reaction with amplified velocity due to fast thermal transport in the conduit. (b) Simulation of average reaction velocity using Fourier’s heat equation with an exothermic source term coupled to a thermal conduit. The x-axis represents different possible thermal diffusivities for the conduit. The parameter β is the dimensionless inverse adiabatic temperature rise of the annular fuel; different fuels have different β values. The dashed line corresponds to TNA. (Part (b) reprinted from46 © 2010 Nature Publishing group.)
(b) (a)
many thermopower wave generators produce higher-power pulses than predicted by this equation, indicating that the velocity of the wave may also play a role in generating electrical power.
Synthesis of TNA-MWNT arrays
For the first time, the concept of the thermopower wave has been realized using MWNT and TNA as the nanowire and the fuel,
respectively46. Vertically aligned MWNT were synthesized by an ethylene
chemical vapor deposition (CVD) method53. Bubbling water injection
during synthesis both improved alignment and decreased amorphous carbon content. At the end of the CVD process, the carrier gas (Ar) flow rate was decreased in order to weaken bonding between the MWNT array and silicon wafer substrate so that it could easily be detached54.
MWNT 3 to 5 mm in length comprised the completed arrays. Wet impregnation is the basic method to coat fuel on CNTs and produce the coaxial structure (Fig. 4a). TNA in acetonitrile solution was dropped into the pores of a MWNT array. As the liquid evaporated from the sparse MWNT array, the TNA solution was trapped between CNTs due to its surface tension and strong van der Waals interactions
between CNTs55. After the acetonitrile completely evaporated (about
24 hours), the MWNT array had densely contracted, its volume decreasing by about an order of magnitude, and annular coatings of TNA crystals were deposited on the sidewalls of the MWNT (Fig. 4b,c). The TNA-MWNT array maintains its aligned structure after wet impregnation. Transmission electron microscopy indicated that the annulus of TNA crystals was 6 to 9 nm thick, wrapping 22 nm-diameter MWNT, and the microbalance measurements before and after impregnation determined the mass ratio of TNA to MWNT46.
Initiation of thermopower waves
Energy input above the minimum barrier of the chemical reaction of fuel is required to launch thermopower waves. Notably, the composite structures of CNTs and fuel described above sharply reduce the required initiation energy for propagating chemical reaction waves56,57. We
describe four methods: two contact-less heating (laser irradiation and high voltage electrical discharge), and two direct contact (Joule heating and butane torch). A laser pulse (785 nm, 300 to 400 mW) can heat a spot at one end of an array, and the exothermic chemical reaction
Fig.4 (a) Synthesis process for TNA-MWNT arrays by wet impregnation. (b) Scanning electron microscopic images of MWNT grown by CVD and water injection method (left), and the preserved alignment of TNA-MWNT structure after synthesis (right). (c) Forcibly disordered TNA-MWNT array to characterize the interior (left). The TNA is the light coating, in contrast to pure MWNT. Densely packed TNA-MWNT arrays (center) can be separated into thin layers. Transmission electron microscopic images of TNA-MWNT array (right). MWNT diameter is 22 nm, and thickness of TNA layer is in the range of 6 to 9 nm. (Right of part (c) reprinted from46 © 2010 Nature Publishing group.)
(b) (a)
wave will propagate from the heating spot to the opposite end. Another contact-less method is high voltage electrical discharge, where a thin tungsten wire fixes the array in place, keeping a small gap between it and a tungsten plate below. The two tungsten elements serve as electrodes for the sub-millisecond discharge, briefly creating a high-energy plasma that starts the reaction wave.
A thin tungsten wire can be used as a Joule (resistance) heater, directly supplying energy via conduction to a sample. When a voltage is applied, the tungsten wire heats rapidly due to its resistance, and the point of contact with the array is ignited. Perhaps the simplest method is to “jump start” the reaction wave with another exothermic reaction. A small torch burning a hydrocarbon fuel (e.g. butane) will easily initiate thermopower waves, although care must be taken to precisely heat only one end of the sample.
Measurement of reaction velocity and thermopower energy generation
Three methods have been employed to measure the reaction velocity of thermopower waves. First, an optical fiber array can detect light
emitted from a series of spots in the reaction region. The optical fiber array is positioned above the array parallel to the expected reaction region, and it measures the time differences between successive fibers as the reaction wave propagates across the sample. Both position and velocity of the reaction wave can be precisely measured over time. A second method is high-speed photography. A high-speed CCD camera with a microscopic lens can record the reaction wave propagation in real time. Snapshots of the reaction wave record its position at the time of each frame.
To describe the third method to measure velocity, the
measurement of thermopower energy generation should be explained beforehand. It is similar to the setup for conventional TE measurement excepting the reaction initiation apparatus and the absence of temperature controllers on either side of the sample. A sample, such as a TNA-MWNT array, is fixed between two electrodes, which are connected to an oscilloscope (Fig. 5a). The reaction is initiated at one end, and the wave propagates across. Fig. 5b shows the launch of a thermopower wave and its propagation in real time high-speed microscopic images.
Fig 5. (a) Illustration of thermopower wave measurement system with TNA-MWNT array. When ignited at one end, the reaction propagates in one direction through the array. (b) Illustration of accompanying charge carrier movement entrained by thermopower wave (top). Real time high-speed microscopic images of thermopower wave propagation along TNA-MWNT array. (c) Comparison of voltages traces to high-speed video demonstrates that the oscillating region corresponds to the time of reaction wave propagation. The smooth region corresponds to the thermal equilibration time of MWNT array. (Top of part (b) reprinted with permission from76 © 2010 Nature Publishing group.)
(b) (a)
During the reaction propagation and subsequent cooling stages, when a temperature gradient exists, the concomitant voltage signal reflects the electrical energy that the thermopower wave generates. This signal contains much information about the thermopower wave. It can be classified into two regions (Fig. 5c): a strongly oscillating region and a smooth region. Velocity oscillations in a reaction wave47,58 can
produce significant oscillations in the voltage signal synchronously with the reaction propagation along the length of the sample, regardless of the sign of the voltage. Thus, the reaction time corresponds to the duration of the oscillating voltage signal, and velocity can be calculated accordingly. The smooth region can be explained by conventional TE voltage generation from the temperature gradient remaining after the rapid propagation of thermopower wave has finished. The voltage returns to zero when the temperature across the sample has equilibrated.
Thermopower wave reaction velocity
The reaction velocity of the thermopower wave varies with many factors, including thickness of fuel, diameter of thermal conduit, and the dimensions of the sample. A higher degree of alignment, lower quantity of amorphous carbon, and small cross-sectional area of the
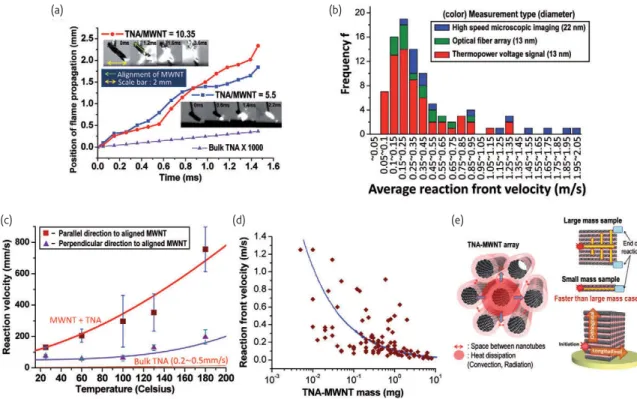
sample increases the average reaction velocity. With the optimal conditions (based on present tests), the average reaction velocity can reach 1 to 2 m/s (Fig. 6a). Across a greater range of conditions and samples, most reaction velocities are 0.1 to 2 m/s, as measured by the three methods described above (Fig. 6b). This enhanced average reaction velocity is 100 to 10000 times faster than TNA deflagrates on its own49,59-61.
Reaction velocity is strongly dependent on the thermal diffusivity of the conduit (Fig. 3b). The average reaction velocity parallel to the alignment of a MWNT array is 10 times faster than along an orthogonal orientation (Fig. 6c). This result agrees with those of an earlier study, showing that thermal diffusivity in vertically aligned MWNT strongly depends on the direction of thermal transport, varying by up to a factor of 7062. In addition, the macroscale TNA-MWNT array has a relatively large number of bulk paths for orthogonal heat transfer via extended two-dimensional flame dissipation. Since all the arrays were roughly the same length and density, the total MWNT mass is determined mostly by the cross-sectional area of the array. This results in the inverse scaling between the mass of the array and reaction velocity (Fig. 6d,e).
Fig. 6 (a) Position of reaction front during wave propagation. Electrical discharge ignited the reaction. The height of the TNA-MWNT array is 2 mm. Insets are two different examples of thermopower waves captured by high-speed microscopy. (b) Histogram of average reaction velocity for compiled data sets. Three different methods (high-speed microscopy, optical fiber array, and voltage signal from thermopower wave) were used to measure reaction velocity. (c) Reaction velocity components parallel and orthogonal to the direction of alignment of MWNT array. (d) Reaction velocity as calculated from thermopower voltage signals. The blue line is a curve fit to guide the eye. (e) Illustration of heat transfer in TNA-MWNT array. Heat dissipation is blocked between individual nanotubes in the array. Convection or radiation from reacting fuel is absorbed by surrounding MWNT, contributing to their reaction waves (left). Orthogonal heat transfer is not suppressed in large mass (2D) devices compared to small mass (1D) devices (top right). Orthogonal and longitudinal heat transfer directions in a TNA-MWNT array (bottom right). (Part (a,c) reprinted from46 © 2010 Nature Publishing group.)
(b) (a)
High specific power electrical pulse: correlation with reaction velocity
A thermal reaction wave leads to a thermopower wave and concomitantly to the generation of a high specific power electrical pulse with constant polarity. In TNA-MWNT, the exothermic
decomposition of TNA creates the moving temperature gradient across the MWNT which can then produce electrical energy. The electrical charge carriers tend to move from the reaction front zone (the hottest area) to the unreacted zone in the CNT (the coldest area) as shown in the schematic of Fig. 5b.
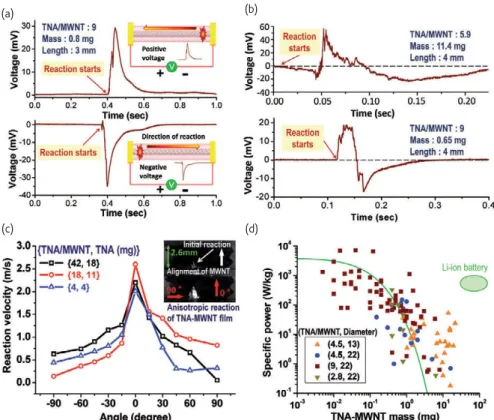
We should note the difference between samples with large and small masses. Mostly, the TNA-MWNT arrays were 3 to 5 mm long in their alignment direction. Thus, variations in mass correspond to variations in the cross-sectional area, i.e. the number of nanotubes in one array. As expected from simulations of the thermopower wave model, a small-mass sample with fast reaction velocity generates a sharp electrical pulse of constant polarity (Fig. 7a). However, a large-mass sample with slow reaction velocity will cool significantly behind the reaction front, creating opposing thermal gradients and thus almost zero voltage. This case can be envisioned as a symmetrical thermal pulse moving across the sample.
Likewise, initiating the reaction in the middle of the sample will create two opposing temperature gradients, and the voltage signal will have peaks of both polarities during the chemical reaction (Fig. 7b). This cancellation of voltage leads to the loss of electrical energy. Fig. 7c is a map of reaction velocities as a function of orientation angle from the initiation point. Increased orthogonal heat transfer slows the reaction wave and hurts the performance (i.e. decreases the specific power) of large-mass TNA-MWNT devices.
Although MWNTs have a relatively low Seebeck coefficient (80 μV/K)33, thermopower waves are free from the requirements of
low phonon and high electron transport rates, unlike conventional TE methods. The temperature gradient is preserved for the duration of reaction propagation, and materials with low TE figures of merit could still generate electrical energy with higher efficiency than conventional TE would suggest46. This is evidenced by Fig. 7d, which shows peak
specific power (that is, the maximum power output of the sample divided by its mass) as a function of total mass of the TNA-MWNT array. The inverse scaling trend of specific power values with sample mass is due to orthogonal heat transfer and slow reaction velocities as discussed previously. It implies that these types of nanocomposites have great potential to improve the power density of micro-/nano-devices.
Fig. 7 (a) Electrical pulse of single polarity induced by a thermopower wave. Either positive or negative voltages can be produced, depending on the direction of reaction propagation. (b) Reversal of polarity and an inflection point in the case of large mass TNA-MWNT (top) or ignition in the middle of array (bottom). (c) Map of reaction propagation in massive TNA-MWNT array, where orthogonal heat transfer cannot be neglected. Alignment of MWNT is critical for fast reaction velocity. Reactions were initiated at the base of the array by electrical discharge. (d) Peak specific power of TNA-MWNT thermopower wave generators. Three different mass ratios (TNA/MWNT) and two different diameters of MWNT were tested in a total of 115 samples. The predicted conventional TE effect for a temperature difference between 300 K and 2800 K is the green line. (Reproduced from46 © 2010 Nature Publishing group.)
(b) (a)
It is worthy of note that the predicted maximum TE specific power from the Seebeck effect is still much lower than many of the measured specific power values. The physical mechanism of thermopower waves may induce a unique enhancement in the motion of electrical charge carriers. Many studies have reported that electron-phonon coupling in one-dimensionally confined nanowires leads to electrical current generated by means of liquid flow in the same direction63,64, as well
as negative differential conductance65. Moving thermal gradients could
create similar physical effects on the surface of MWNT, which could in turn accelerate carriers confined in the narrow region of the reaction front, leading to extra energy production in addition to the static TE effect46.
Effects of carbon nanotube and their alignment for launching thermopower waves
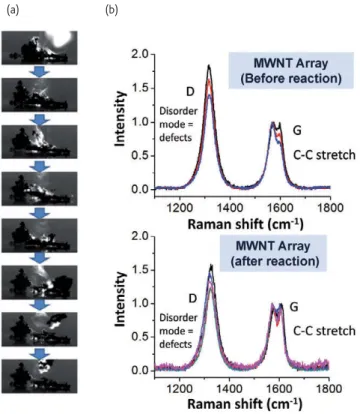
The presence and alignment of CNT are very important for creating and maintaining thermopower waves, respectively. Comparisons between TNA-MWNT samples of aligned, unaligned CNTs, or activated carbon (AC) demonstrates these roles. AC and unaligned MWNT were coated with TNA by the same wet impregnation method described earlier, producing contiguous solid materials similar to aligned TNA-MWNT. TNA-AC needed much more energy to initiate reaction than TNA-MWNT. The reaction did not propagate completely but rather stopped, even though the AC contained no large pores. In the case of TNA-unaligned MWNT, the initiation energy requirement was similar to aligned TNA-MWNT, though the reaction wave was not continuous. Part of the array separated due to a pressure wave (Fig. 8a) created by the reaction, and the velocity was significantly lower than TNA-aligned MWNT case. The alignment and porosity of the MWNT arrays helps to shape the TNA coatings around the MWNT walls continuously. Finally, Raman spectroscopy indicates that the MWNT array is still intact (Fig. 8b) after thermopower wave propagation. If fuel were coated on a MWNT array repeatedly between thermopower wave reactions, it would be reusable—a new concept for a “fuel cell.”
Comparison with other energy storage and
generation technologies
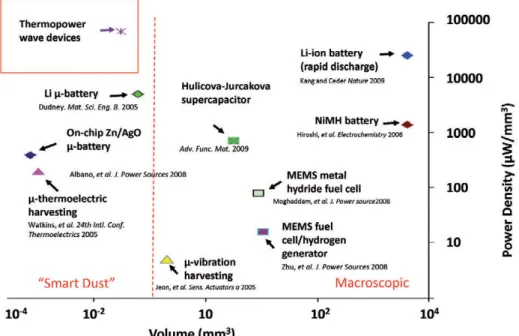
Thermopower waves in TNA-MWNT can create electrical pulses of high specific power, up to 7 kW/kg. Even though the duration of electrical discharge is relatively short, the maximum power density can compete even with high- performance Li-ion batteries, demonstrating the utility of thermopower waves. Fig. 9 shows various electrical energy systems compared on the basis of their power density and volume. Recently, Kang and Ceder66 reported macroscale Li-ion batteries with power
densities up to 25 W/cm3, far surpassing previous Li-ion technologies.
By comparison, NiMH batteries can produce about 1 W/cm3 at a
similar scale67. However, the necessity of smaller power sources for
MEMS devices has spurred development of electrical energy sources between 10-1 and 102 mm3 in size such as MEMS fuel cells68,69,
supercapacitors70, and vibration energy harvesters71. The power density
of these devices has remained lower than that of full-size Li-ion batteries.
However, for so-called “smart dust” applications72, power sources
smaller than 10-1 mm3 are indispensable, as the total device volume
must be less than 1 mm3. For example, a 10-3 mm3 thermoelectric
harvester73 can produce about 200 μW/mm3. More recently, Albano
et al.74 have designed an even smaller on-chip Zn/AgO battery
operating at about 400 μW/mm3. Dudney et al.75 have reported
a somewhat larger Li microbattery with high power density up to 10 000 μW/mm3. Notably, the power density of thermopower
wave generators (up to 80 000 μW/mm3) surpasses all these power
sources and easily fits within smart dust size limitations, even at this initial stage of research with only one nanocomposite, TNA-MWNT. Moreover, since the scaling trend of thermopower wave generator specific power is inversely proportional to nanocomposite size, the synthesis of materials at extremely small scales is expected to boost maximum peak power. Opportunities for further enhancement also exist in reducing thermal losses, particularly radiation, through systems engineering and design.
While large-scale supercapacitors (not included in Fig. 9) will generally still produce the highest power pulses of these available
Fig. 8 (a) High-speed photographs of TNA on unaligned MWNT. The reaction wave did not propagate solely in one direction. Part of the TNA-MWNT sample could not withstand the pressure wave created by the reaction and separated from the main body. (b) Raman spectra of MWNT array before and after reaction of TNA. The original structure and properties of the carbon nanotubes are preserved.
(b) (a)
technologies, their self-discharge rate is high enough that they are not practical for long-term energy storage. Likewise, self-discharge saps energy stored in batteries, although generally over a longer time scale than capacitors. Thermopower waves, by contrast, use energy stored in the chemical bonds of fuels, which can remain stable for years, providing another advantage over these other power generation systems. Systems like fuel cells also use chemical fuels as energy sources, but have much lower power density compared to thermopower wave generators due to their slower reaction rates.
Outlook and future challenges
We have reviewed the recently reported concept of thermopower waves, which evolve from rapid chemical reaction waves as concomitant high power electrical energy pulses. Many interesting directions for future theoretical and applied research exist. For example, more common fuels such as gasoline, ethanol, methane, or formic acid will need to be tested to enable wider applications for thermopower wave generators. These fuels may need catalysts to lower activation energy barriers and increase reaction rates, necessitating more detailed design of the nanostructures that serve as thermal and electrical conduits. The performance of thermopower waves will be affected by the choice of fuel, as shown by the dependence on β in the simulations of Fig. 2b. Differences in thermal diffusivity, specific heat, activation energy, and enthalpy of reaction can thus all play roles.
Another practical research advance would be on-chip initiation of thermopower waves, necessary for their application as micro- and nanoscale power sources. This may involve nanostructures to concentrate diffuse or broadband energy sources. In addition to enabling remote initiation, on-chip integration should increase energy efficiency of thermopower wave devices by minimizing the input energy needed to start the reaction. At present, the peak power output of these devices is excellent, but higher efficiencies are needed.
Energy efficiency would also be significantly increased by insulating against thermal losses. Due to high reaction temperatures, radiation is the largest mode of heat loss in the present device design. One could surround the fuel/thermal conduit composites with layers of insulation to reduce these losses, but the effect on the reaction of the fuel remains to be investigated. It could limit fuel choices to those that
Fig. 9 Comparison of power densities from various electrical energy sources. (Some volumes were estimated from published device descriptions.) Two different volume scales are presented; “smart dust” is generally defined to be less than 1 mm3.
Instrument Citation
Carbon nanotube CVD
• Thermo Fisher Scientific Lindberg/Blue M * 1100°C, TF55035A (CVD furnace) • Aalborg SDPROC Microprocessor Driven Command Module (Mass flow
controller)
High Speed Microscopy
• Canadian Photonic Labs Inc. Mega Speed, CPL-MS70KS2B90 (High speed camera) with Nikon, AF Micro-NIKKOR 60 mm f/2.8D (Lens), and CPL GN 250 light (Iight)
Thermopower measurment
• Yokogawa, DL 1735E Digital Oscilloscope, 4 channels (Oscilloscope) • BK precision 1692, DC regulated power supply (DC power supply) • Agilent 33250 A Function/Waveform generator (Function generator) • B & K Tec INC, BRM 785 nm laser (laser)
• Thorlabs, SV2-FC, Photo-detector (Photo detector) Carbon Nanotube Characterization
• JEOL, JSM-6060 Scanning Electron Microscope (SEM)
• JEOL 200CX General Purpose Transmission Electron Microscope (TEM) • Horiba Jobin Yvon LabRAM HR 800 Raman system (Raman)
REFERENCES
1 Riffat, S. B., and Ma, X. L. Appl Therm Eng (2003) 23, 913. 2 DiSalvo, F. J., Science (1999) 285, 703
3 Chen, G., et al., Int Mater Rev (2003) 48, 45. 4 Chen, G., Ieee T Compon Pack T (2006) 29, 238. 5 Dresselhaus, M. S., et al., Phys Solid State (1999) 41, 679. 6 Dresselhaus, M. S., et al., Semiconduct Semimet (2001) 71, 1. 7 Hicks, L. D., and Dresselhaus, M. S., Phys Rev B (1993) 47, 12727. 8 Hicks, L. D., and Dresselhaus, M. S., Phys Rev B (1993) 47, 16631. 9 Lin, Y. M., et al., Phys Rev B (2000) 62, 4610.
10 Sun, X., et al., Appl Phys Lett (1999) 74, 4005. 11 Dresselhaus, M. S., et al., Adv Mater (92007) 19, 1043. 12 Poudel, B., et al., Science (2008) 320, 634. 13 Zhou, J. H., et al., Appl Phys Lett (2005) 87, 33109. 14 Lin, Y. M., et al., Appl Phys Lett (2002) 81, 2403. 15 Hochbaum, A. I., et al. Nature (2008) 451, 163. 16 Boukai, A. I., et al. Nature (2008) 451, 168. 17 Chen, X., et al., J Phys Chem C (2010) 114, 9096. 18 Lee, C. H., et al., Appl Phys Lett (2009) 94, 022106. 19 Tai, G., et al., J Phys Chem C (2008)112, 11314. 20 Liang, W. J., et al. Nano Lett (2009) 9, 1689. 21 Uryupin, O. N., et al. J Electron Mater (2009) 38, 990. 22 Wakim, S., et al., Polymer Reviews (2008) 48, 432. 23 Yu, C. H., et al., Nano Lett (2005) 5, 1842. 24 Adu, C. K. W., et al., Chem Phys Lett (2001) 337, 31. 25 Sumanasekera, G. U., et al., Phys Rev Lett (2002) 89, 166801. 26 Ebbesen, T. W., et al. Nature (1996) 382, 54.
27 Ando, Y., et al., Int J Inorg Mater (1999) 1, 77. 28 Cahill, D. G., et al. J Appl Phys (2003) 93, 793.
29 Fisher, T. S., and Walker, D. G., J Heat Trans-T Asme (2002) 124, 954. 30 Kunadian, I., et al., Carbon (2009) 47, 589.
31 Shi, L., et al. J Heat Trans-T Asme (2003) 125, 1209. 32 Hone, J., et al. Phys Rev Lett (1998) 80, 1042. 33 Kim, P., et al., Phys Rev Lett (2001) 8721, 215502. 34 Zhang, H. L., et al. Phys Rev B (2007) 75, 205407. 35 Choi, Y. M., et al. Nano Lett (2003) 3, 839. 36 Vavro, J., et al. Phys Rev Lett (2003) 90, 065503. 37 Sadanadan, B., et al. J Nanosci Nanotechno (2003) 3, 99. 38 Takashiri, M., et al., J Appl Phys (2007) 101, 074301. 39 Zhao, X. B., et al. Appl Phys Lett (2005) 86, 062111.
40 Li, L., et al. Appl Phys Lett (2006) 88, 103119. 41 Venkatasubramanian, R., et al., Nature (2001) 413, 597. 42 Meng, C. Z., et al., Adv Mater (2010) 22, 535. 43 Van, T. D., et al. Smart Mater Struct (2010) 19, 075003. 44 Wei, P., et al., Phys Rev Lett (2009) 102, 166808. 45 Zuev, Y. M., et al., Phys Rev Lett (2009) 102, 096807. 46 Choi, W., et al. Nat Mater (2010) 9, 423.
47 Weber, R. O., et al., P Roy Soc Lond a Mat (1997) 453, 1105. 48 Liau, Y. C., et al., Combust Flame (2001) 126, 1680. 49 Volkov, E. N., et al., Combust Explo Shock (2008) 44, 43. 50 Abrahamson, J. T., et al., Nanotechnology (2008) 19, 195701. 51 Nair, N., and Strano, M. S., Phys Rev B (2009) 80, 174301.
52. Abrahamson, J. T., et al., Wave Front Velocity Oscillations of Carbon Nanotube-Guided
Thermopower Waves: Nanoscale Alternating Current Sources. Submitted (2010).
53 Hata, K., et al. Science (2004) 306, 1362. 54 Liu, K., et al. Adv Mater (2007) 19, 975. 55 Futaba, D. N., et al. Nat Mater (2006) 5, 987. 56 Ajayan, P. M., et al. Science (2002) 296, 705. 57 Manaa, M. R., et al., J Am Chem Soc (2005) 127, 13786. 58 Please, C. P., et al., Combust Theor Model (2003) 7, 129. 59 Aleksandrov, V. V., et al., Combust Flame (1979) 35, 1. 60 Homan, B. E., et al., Combust Flame (2000) 120, 301. 61 Zenin, A., J Propul Power (1995) 11, 752.
62 Ivanov, I., et al., Appl Phys Lett (2006) 89, 223110. 63 Ghosh, S., et al., Science (2003) 299, 1042.
64 Fung, C. K. M., et al., Flow rate measurement inside polymer microfluidic systems using carbon nanotube sensors. Ieee Sensor (2005) Oct. 30 – Nov. 3, 541. 65 Pop, E., et al., Phys Rev Lett (2005) 95, 155505.
66 Kang, B., and Ceder, G., Nature (2009) 458, 190. 67 Kuriyama, N., et al., Vacuum (1996) 47, 889. 68 Moghaddam, S., et al., J Power Sources (2008) 185, 445. 69 Zhu, L., et al., J Power Sources (2008) 185, 1305.
70 Hulicova-Jurcakova, D., et al., Adv Funct Mater (2009) 19, 1800. 71 Jeon, Y. B., et al., Sensor Actuat a-Phys (2005) 122, 16. 72 Sailor, M. J., and Link, J. R., Chem Commun (2005) 11, 1375.
73 Watkins, C., et al., ICT: 24th International Conference on Thermoelectrics (2005)
250-252, 533.
74 Albano, F., et al. J Power Sources (2008) 185, 1524. 75 Dudney, N. J., Mat Sci Eng B-Solid (2005) 116, 245. 76 Aliev, A. E., and Baughman, R. H., Nat Mater (2010) 9, 385.
do not require oxygen. Moreover, for approximately one-dimensional structures smaller than 1 mm in diameter that operate at high temperature, the increase in diameter from insulation actually increases radiation heat losses by increasing the surface area. Higher energy efficiency will also increase the energy density of thermopower wave devices, making them smaller and more lightweight and thus more desirable for portable applications.
Fundamentally, the science and application of thermopower waves will be driven forward by new nanostructures that can control the direction and speed of these reactions and convert heat to electron motion (i.e. current) more efficiently. As shown in Fig. 3b, nanowires with different thermal diffusivities and electrical properties may alter
the dynamics of the chemical reaction wave as well as the electricity produced. Materials with large Seebeck coefficients such as silicon nanowires or bismuth telluride could be alternative thermal conduits but may not be the most suitable due to their low thermal diffusivities.
In the theoretical regime, the biggest question is what the figure of merit is for thermopower waves in contrast to static thermopower. What material properties give rise to the additional power observed above the Seebeck limit? What roles do electron-phonon coupling and the Seebeck coefficient itself play? Or are other properties and phenomena the most important? Investigations of these physical principles will clarify what the true nature of the “electron entrainment” effect is and elucidate the design rules for high power, efficient, controllable thermopower wave devices.