HAL Id: hal-01829172
https://hal.umontpellier.fr/hal-01829172
Submitted on 3 Jul 2018HAL is a multi-disciplinary open access archive for the deposit and dissemination of sci-entific research documents, whether they are pub-lished or not. The documents may come from teaching and research institutions in France or abroad, or from public or private research centers.
L’archive ouverte pluridisciplinaire HAL, est destinée au dépôt et à la diffusion de documents scientifiques de niveau recherche, publiés ou non, émanant des établissements d’enseignement et de recherche français ou étrangers, des laboratoires publics ou privés.
Women’s attractiveness is linked to expected age at
menopause
Jeanne Bovet, Melissa Barkat-Defradas, Valérie Durand, Charlotte Faurie,
Michel Raymond
To cite this version:
Jeanne Bovet, Melissa Barkat-Defradas, Valérie Durand, Charlotte Faurie, Michel Raymond. Women’s attractiveness is linked to expected age at menopause. Journal of Evolutionary Biology, Wiley, 2018, 31 (2), pp.229-238. �10.1111/jeb.13214�. �hal-01829172�
1
Article published in the Journal of Evolutionary Psychology. DOI: 10.1111/jeb.13214 1
WOMEN
’
S ATTRACTIVENESS IS LINKED TO EXPECTED AGE AT
2
MENOPAUSE
3
(
WOMEN’
S ATTRACTIVENESS AND AGE AT MENOPAUSE)
4 5
Jeanne Bovet
a,*, Mélissa Barkat-Defradas
b, Valérie Durand
b, Charlotte Faurie
b,
6
Michel Raymond
b7
a. Institute for Advanced Study in Toulouse, France 8
b. Institut des sciences de l’évolution de Montpellier. CNRS UMR 5554 – IRD – EPHE- 9
Université de Montpellier, Montpellier, France 10
* Corresponding author. Address: Institute for Advanced Study in Toulouse, Manufacture des 11
Tabacs, 21 allée de Brienne, 31015 Toulouse Cedex 6; Telephone: +33668114426; E-mail 12
address: jeanne.bovet@iast.fr
13
Data available from the Dryad Digital Repository: https://doi.org/10.5061/dryad.jb7m1
14
Acknowledgements 15
The authors would like to thank Mona Joly for assisting in data collection, as well as the City 16
Hall of Montpellier, Luc Gomel and all the staff from the Serre Amazonienne for providing 17
places to recruit raters. We also thank two anonymous reviewers for their valuable comments 18
on the manuscript. This study was supported by the Agence Nationale pour la Recherche 19
‘HUMANWAY’ project (ANR- 12-BSV7-0008-01). Funding from the ANR through the 20
Labex IAST to J.B. is also gratefully acknowledged. This is contribution 2017-283 of the 21
Institut des Sciences de l’Evolution de Montpellier (UMR CNRS 5554). 22
2 Abstract
23
A great number of studies have shown that features linked to immediate fertility explain a 24
large part of the variance in female attractiveness. This is consistent with an evolutionary 25
perspective, as men are expected to prefer females at the age at which fertility peaks (at least 26
for short-term relationships) in order to increase their reproductive success. However, for 27
long-term relationships, a high residual reproductive value (the expected future reproductive 28
output, linked to age at menopause) becomes relevant as well. In that case, young age AND 29
late menopause are expected to be preferred by men. However, the extent to which facial 30
features provide cues to the likely age at menopause has never been investigated so far. Here, 31
we show that expected age at menopause is linked to facial attractiveness of young women. 32
As age at menopause is heritable, we used the mother’s age at menopause as a proxy for her 33
daughter’s expected age of menopause. We found that men judged faces of women with a 34
later expected age at menopause as more attractive than those of women with an earlier 35
expected age at menopause. This result holds when age, cues of immediate fertility and facial 36
ageing were controlled for. Additionally, we found that the expected age at menopause was 37
not correlated with any of the other variables considered (including immediate fertility cues 38
and facial ageing). Our results show the existence of a new correlate of women’s facial 39
attractiveness, expected age at menopause, which is independent from immediate fertility cues 40
and facial ageing. 41
42 43 44 45
Key words: humans, sexual selection, mate choice, female attractiveness, face, menopause, 46
residual reproductive value, fertility 47
3 1. Introduction
48
Why some women are more attractive than others has been the focus of many studies, and it 49
has been repeatedly shown that features linked to immediate fertility (i.e. fertility at a given 50
time) explain a large part of the variance in attractiveness (see Rhodes 2006 for a review). 51
Cues of immediate fertility can be found in body shape, voice pitch, or facial features; in fact, 52
all traits linked to sexual maturity, age and parity or substantially influenced by sex hormones 53
(which are factors influencing immediate fertility) have the potential to influence physical 54
attractiveness (see, for example, Symons 1995; Henss 2000; Singh 2002; Jasienska et al. 55
2004; Feinberg et al. 2005; Law Smith et al. 2006; Pipitone and Gallup 2008; Singh et al. 56
2010; Little et al. 2011; Puts et al. 2012, 2013; Pfluger et al. 2012; Jones 2014; Mondragón-57
Ceballos et al. 2015; Sugiyama 2015; Butovskaya et al. 2017 but see Marcinkowska et al. 58
2014, 2015 for some modulations of these preferences). To increase their reproductive 59
success, males should prefer females of the age at which age-specific fertility peaks, at least 60
for short-term mates (Maestripieri et al. 2014). For long-term relationships such as marriage, 61
however, residual reproductive value - the expected future reproductive output - becomes 62
pertinent too. In humans, this trend is strengthened by the existence of reproductive 63
senescence or menopause (i.e., the permanent cessation of menstruation), associated with the 64
ultimate cessation of child-bearing potential, long before the somatic senescence. 65
Consequently, for long-term relationships, the number of offspring produced by the couple 66
will depend in part on the number of years before the woman reach menopause, particularly in 67
natural fertility populations where reproduction could theoretically extend until menopause. 68
Thus, men can increase their reproductive success by choosing a long-term mate with 69
a longer reproductive window (i.e. higher residual reproductive value). The first criterion of a 70
long reproductive window is of course age. And indeed, youth is one of the most important 71
factor of women’s attractiveness (Buunk et al. 2001). Then, for a given age, the temporal 72
reproductive window will vary according to the age at menopause, which is highly variable 73
both across and within populations (Avis et al. 2001; Thomas et al. 2001; Velde et al. 2002; 74
4
Dratva et al. 2009; Morris et al. 2011; Stepaniak et al. 2013). If the future age at menopause is 75
somehow detectable in young adults, it could contribute substantially to mate choice and thus 76
influence female attractiveness. It is possible that previously identified components of 77
immediate fertility are also informative of female residual reproductive value: reproductive 78
value at a young age and later in life could be positively correlated due to some common 79
underlying factors, or negatively correlated as a result of a biological trade-off (Hamilton 80
1966; Wood et al. 2001; Carter and Nguyen 2011). Alternatively, future age at menopause 81
could be independent of immediate fertility cues, and thus a correlate of attractiveness that has 82
not yet been identified. 83
In this study, we investigated whether expected age at menopause is related to the 84
attractiveness of young women’s faces. As age at menopause is heritable (heritability between 85
0.42 and 0.72 depending on the study: Snieder et al. 1998; de Bruin et al. 2001; van Asselt et 86
al. 2004; Murabito et al. 2005; Morris et al. 2011), mother’s age at menopause was used as a 87
proxy for the daughter’s expected age of menopause. To better understand how the residual 88
reproductive value could be facially detectable, immediate fertility cues were included in the 89
model as possible explanatory variables. It could also be speculated that women who reach 90
menopause later have an overall slower life history trajectory, with a slower general physical 91
ageing, and may look younger, at the same age, than women who will experience menopause 92
at an earlier age (in line with this idea, a later age at menopause is associated with a longer 93
life expectancy, for a review see Gold 2011). To see if general physical ageing could mediate 94
the relationship between facial attractiveness and expected age at menopause, we included 95
facial ageing (measured as the difference between actual age and perceived age) as another 96
explanatory variable. 97
98
2. Materials and Methods 99
2.1 Ethics Statement. The protocol used to recruit participants and collect data was approved
100
(#1226659) by the French National Committee of Information and Liberty (CNIL). For each 101
5
participant, the general purpose of the study was explained (“a study on the determinants of 102
mate choice”) and a written voluntary agreement was requested for a statistical use of data 103
(private information and photographs). Data were analysed anonymously. 104
2.2 Stimuli. A total of 97 women between 25 and 35 years of age were recruited by social
105
networks and advertising in Montpellier, France. Sixty-eight Caucasian women whose mother 106
had a natural and known age at menopause constituted our final stimuli sample (mean age = 107
28.4, age range: 25-35, see table S4). Volunteers were instructed to come to the lab after 108
collecting information about their mother’s and (when possible) grandmothers’ menopause 109
(menopause was defined as the first full year without any menstruation) and without wearing 110
any make-up. For each woman, the following information was collected: date and place of 111
birth for themselves, their parents and grandparents; monthly income (divided into ten classes 112
from less than 760€ to more than 4705€) for themselves and their parents; education level; 113
and age at menopause for their mother and grandmothers. A facial photograph was taken with 114
the same digital still camera (Canon EOS 20D) at a distance of 1 m using the same general 115
settings. Each woman was asked to have a neutral facial expression, to remove any glasses or 116
earrings, and to wear a hairband (to make sure that all the face was visible). All photographs 117
were electronically processed using Adobe Photoshop CS3 to normalise size (photographs 118
were aligned on eyes position, with a fixed distance between eyes and chin), colour balance, 119
contrast and luminosity (using the Photoshop auto-corrections tools). Hairstyle was cropped, 120
and the background was replaced by a uniform grey colour (see figure 1). A compensation of 121
20€ was provided for the subjects’ participation. 122
2.3 Procedure. A Delphi-based computer program was generated to present randomly drawn
123
pairs of photographs of the 68 women (see figure 1). For each pair, the rater was instructed to 124
click on the photograph depicting the woman he found the most attractive (the outcome 125
measure of our study). The position of the photograph on the screen (left or right) was 126
randomly ascribed. Each rater had 30 distinct pairs of photographs to assess, corresponding to 127
60 different women. If the rater knew one of the women he had to judge, the trial was 128
6
removed. Also, the first pair seen by each participant was not used for the analyses, because 129
the task could require some habituation. Three pairs, randomly chosen from among those 130
previously viewed, were presented again at the end to estimate judgement reliability. 131
2.4 Raters. A total of 156 male raters assessed the relative attractiveness of these women.
132
Volunteer raters were recruited in public places in Montpellier (France) and were unaware of 133
the purpose of the study when assessing the pairs of pictures. For each rater, the following 134
information was collected: date and place of birth, grandparents’ origins, monthly income, 135
occupation, house ownership, taxability, education level, and sexual orientation. Only data 136
from Caucasian and heterosexual raters were used for the analyses. Assessments of unreliable 137
raters (i.e., with more than one incorrect answer during the test of judgement reliability) were 138
removed. A total of 119 raters were retained in the final sample, with a mean age of 36.2 (age 139
range: 17-72, see table S4). Each woman was observed, on average, by 101.1 raters (range: 140
93-108). 141
2.5 Immediate fertility cues. We collected 3 physical features hypothesised to be linked to
142
women’s immediate fertility: the waist-to-hip ratio (the ratio between body circumference at 143
the waist and the hips or WHR, Singh 1993; Jasienska et al. 2004; Singh and Randall 2007; 144
Lassek and Gaulin 2007; Mondragón-Ceballos et al. 2015; Butovskaya et al. 2017; but see 145
Nenko and Jasienska 2009), the fundamental frequency of the voice (F0, Harries et al. 1998; 146
Abitbol et al. 1999; Feinberg 2008; Evans et al. 2008; Abend et al. 2014) and the facial 147
femininity (Farkas 1987; Johnston and Franklin 1993; Perrett et al. 1998; Fink and Neave 148
2005; Law Smith et al. 2006; Little et al. 2011; Pfluger et al. 2012; Jones 2014). The WHR 149
was measured in the lab by the investigator. To measure the F0, women were recorded reading 150
the French version of a standard text (“La bise et le soleil”) using a Tascam DR-07 MKII 151
digital recorder. Across each recording, the fundamental frequency (F0, the acoustic correlate 152
of pitch) was measured using Praat software (Boersma and Weenink 2013). To generate 153
morphological facial femininity scores, a geometric morphometric analysis of the faces was 154
7
used following methods described in Scott et al. 2010; Lee et al. 2014; Dixson et al. 2017: 155
First, the coordinates of 142 landmarks (anatomical points present in all individuals, e.g. the 156
corners of the lips) and semi-landmarks (sliding points positioned along some anatomical 157
curves, such as the bow of the eyebrow) were delineated for each female face, as well as for 158
26 male facial photographs retrieved from another database. These 26 additional men were 159
recruited according to the same criteria as for the women’s recruitment: heterosexuality, 160
Caucasian origin, 25-35 years old. The delineation of the landmarks and semi-landmarks were 161
done using Psychomorph (Tiddeman et al. 2005). The R package Geomorph (version 3.0.3) 162
was used to carry out a Procrustes superimposition of the landmark and semi-landmark data, 163
which removes non-shape information such as translation, size, and rotational effects 164
(Zelditch et al. 2012, 2013). A Principal Component Analysis (PCA) was conducted on the 165
Procrustes-registered landmarks and semi-landmarks data of the 26 male faces and 26 female 166
faces randomly drawn from this study dataset, matching the age distribution of the 26 men. 167
This PCA produced shape variables which are a decomposition of the landmark coordinates of 168
the male and female faces (see figure S1). The values on the factors of the PCA were 169
computed for the remaining 42 female faces (not used to create the PCA). Then, a linear 170
discriminant analysis (LDA) incorporating the two first components of the PCA was used to 171
discriminate between male and female faces. The resulting analysis provided correct sex 172
classification for 92.6% of faces. Discriminant function scores were therefore used as an 173
index of facial femininity, with high scores indicating a more feminine facial morphology 174
scores (Scott et al. 2010; Lee et al. 2014; Dixson et al. 2017). All analyses were performed 175
using R software, version 3.4.2. 176
2.6 Estimation of facial ageing. It could be speculated that women who reach menopause
177
later have an overall slower life history trajectory, with a slower general physical ageing, and 178
may look younger, at the same age, than women who will experience menopause at an earlier 179
age. To control for this possibility, a second Delphi-based computer program was generated to 180
present the facial photographs of the 68 women to 136 raters. For each photograph, the rater 181
8
was instructed to estimate the age of the woman (see figure S2). Each rater had 20 distinct 182
photographs to assess, randomly drawn among the 68 pictures. Three photographs, randomly 183
chosen among those previously viewed, were presented again at the end to estimate 184
judgement reliability. For each rater, information about sex and age was collected. The 185
reliability of raters was assessed by computing the sum of absolute differences between the 3 186
first estimations and the corresponding repetitions. Raters with values higher than 15 years 187
were removed (a more stringent threshold of 9 years, or no threshold, did not change 188
qualitatively the results). A total of 107 facial ageing raters (including 61 women) were 189
retained in the final sample, with a mean age of 35.1 (age range: 16-65). Each woman was 190
observed, on average, by 31.2 raters (range: 24-43). For each woman, the difference between 191
their real age and the mean age given by the raters was calculated. This variable represents the 192
facial ageing of the women, a critical explanatory variable for the analysis of attractiveness. 193
2.7 Statistical analyses. Logistical regressions were used to analyse raters' attractiveness
194
preferences. The binary response variable corresponded to being chosen or not for the focal 195
woman (arbitrarily the woman presented at the left position) during the presentation of each 196
pair. Women and attractiveness raters were considered random samples from a larger 197
population of interest and were thus random-effect variables. Therefore, generalised linear 198
mixed models with a binomial error structure were used. For each choice made by a rater, the 199
difference between the ages at menopause of the focal and the non-focal woman’s mothers 200
was calculated. The value of this difference was integrated into the model as the main variable 201
of interest. To control for potential confounding effects, the differences between the focal and 202
the non-focal woman’s ages and socio-economic status (SES, a PCA combination of 203
education level and the woman’s and her parents’ monthly incomes) were introduced into the 204
model. Because the subjects displayed a perceptible smile in some photographs, a qualitative 205
variable describing this aspect was also introduced (this binary variable was coded by three 206
independent raters, blind to the other characteristics of the women). Variables concerning the 207
raters’ characteristics were also included in the model as potential confounding effects. These 208
9
variables were the rater’s age and SES (a PCA combination of the variables “monthly 209
income”, “occupation”, “house ownership”, “taxability”, and “education level”). All variables 210
were standardized for the analysis. In a second model, the difference between the two women 211
for cues of immediate fertility (facial femininity, WHR and F0), and facial ageing were 212
included as explanatory variables. Indeed, these variables, which may be linked to expected 213
age at menopause, could potentially mediate the relationship between expected age at 214
menopause and facial attractiveness. 215
Linear regression was used to analyse the mother’s age at menopause according to the 216
maternal grandmother’s age at menopause. The “one-parent - one child” regression coefficient 217
represents half the heritability (h2) of the trait (Lynch and Walsh 1998). Pearson correlations
218
were used to analyse relationships between each woman’s measured traits: expected age at 219
menopause, immediate fertility cues, facial ageing, age, and SES. All statistical analyses were 220
performed using R software, version 3.4.2. 221
222
3. Results 223
3.1 Attractiveness, age at menopause and immediate fertility. The variable expected age at
224
menopause (estimated by mother’s age at menopause) had a significant positive effect on the 225
probability of a woman being chosen as the most attractive: Men tend to prefer women who 226
are likely to reach menopause later (β = 0.22, SE = 0.053, P < 0.001 see model 1 in table 2). 227
This result holds when immediate fertility cues and facial ageing are controlled for (β = 0.24, 228
SE = 0.053, P < 0.001, see model 2 in table 1 and figure 2), showing that the effect of 229
expected age at menopause on attractiveness is not due to know cues of immediate fertility 230
cues or facial ageing. Additionally, the 3 cues of immediate fertility had a significant effect on 231
the probability of being chosen: men tend to prefer more feminine faces (β = 0.4, SE = 0.057, 232
P < 0.001, see model 2 in table 1), and the faces of women who have a higher (i.e. more 233
feminine) F0 (β = 0.2, SE = 0.058, P = 0.001). In contradiction with our prediction, men also 234
10
tend to prefer the faces of women who had a higher (i.e. more masculine) WHR (β = 0.13, SE 235
= 0.057, P = 0.02). Facial ageing had a negative effect on the probability to be chosen (β = -236
0.56, SE = 0.06, P < 0.001): Independently of their actual age, women who look younger than 237
their actual age were preferred by men. Women’s age and smile demonstrated a significant 238
effect on the probability of being chosen: men preferred women who were younger (β < -0.2, 239
P < 0.001, see models 1 and 2 in table 1) and smiled more (β > 0.27, P < 0.001, see models 1 240
and 2 in table 1). The socio-economic status of the woman had a negative effect on the 241
probability to be chosen as the more attractive, but this result was significant only in model 2 242
(β = -0.17, SE = 0.057, P = 0.003). The raters’ age and socio-economic level had no 243
significant effect on their choices (all P > 0.5, see models 1 and 2 in table 1). 244
3.2 Menopause and other women’s features. There was no significant correlation between
245
expected age at menopause and immediate fertility cues (facial femininity, F0 and WHR), 246
facial ageing, woman’s age or socio-economic status (all P > 0.1, see table 2), showing that 247
expected age at menopause is capturing a distinct correlate of facial attractiveness. There was 248
no significant correlation between the other variables, except a negative correlation between 249
facial ageing and SES (r = -0.29, P = 0.021, see table 2). 250
3.3 Heritability of age at menopause. To help establish the validity of our sample, we
251
measured the heritability of age at menopause, for comparison with previous studies done 252
with various samples and methods (Snieder et al. 1998; de Bruin et al. 2001; van Asselt et al. 253
2004; Murabito et al. 2005; Morris et al. 2011). Here we used the regression between grand-254
mother and mother, without controlling for possible shared environments (this is not crucial 255
for the present study, as the main purpose here is to establish the validity of the mothers’ age 256
at menopause as a proxy for the daughters’ expected age at menopause). Among the 97 257
women, 42 completed information about both their mother’s and maternal grandmother’s 258
menopause. The mean age at menopause was 51.0 (range: 42-58) for the mothers and 50.3 259
(range: 39-60) for the grandmothers. The maternal grandmother’s age at menopause had a 260
11
significant effect on the mother’s age at menopause (β = 0.275, SE = 0.11, P = 0.016, see 261
figure 3). This implies a heritability of age at menopause from the maternal side of 27.5% and 262
thus an overall heritability h² ~ 55% (SE = 0.22). 263
4. Discussion 264
Here, we show that expected age at menopause is significantly related to the facial 265
attractiveness of young women. This result holds when variables potentially linked to 266
immediate fertility (age, facial femininity, voice pitch and WHR), facial ageing and socio-267
economic status are controlled for. Additionally, immediate fertility cues and facial ageing 268
were not correlated with the expected age at menopause. Thus, the expected age at menopause 269
seems to be linked to independent facial information, which is not deducible from previously 270
documented components of facial attractiveness linked to immediate fertility or facial ageing. 271
Results classically found in the literature were replicated in this study, suggesting that 272
this sample of young females is not different from those described elsewhere. First, our 273
sample provided an heritability estimate for age at menopause of 0.55, consistent with 274
previous values ranging from 0.42 to 0.72 (Snieder et al. 1998; de Bruin et al. 2001; van 275
Asselt et al. 2004; Murabito et al. 2005; Morris et al. 2011). Moreover, immediate fertility 276
cues were positively correlated with facial attractiveness, as in previous studies: men in our 277
sample preferred more feminine faces as in Cunningham et al. 1995; Perrett et al. 1998; 278
Rhodes et al. 2003; Koehler et al. 2004; Little et al. 2011, and facial attractiveness was 279
positively correlated to pitch voice (F0), consistent with Collins and Missing 2003; Feinberg 280
et al. 2005; Wheatley et al. 2014; Smith et al. 2016. Also, attractive faces were rated younger 281
than their true age, as in the study of Kwart (2012). However, two variables had significant 282
effects on attractiveness, but in the opposite direction than expected. First, men in our sample 283
had a preference for faces of women who have a higher (i.e. more masculine) WHR, which is 284
in contradiction with the idea that face and body would signal one same quality. However, our 285
results go in the same direction than results of Thornhill and Grammer (1999), who found a 286
12
positive but insignificant correlation between facial attractiveness and WHR. Further studies 287
are needed to investigate if face and WHR are signaling different aspects of female mate 288
quality. Secondly, we found that socio-economic status of the women had a negative effect on 289
facial attractiveness. We were expecting a positive correlation, as a higher socio-economic 290
status is related to less stress during development, better nutrition, less unhealthy behavior, 291
etc. (Adler et al. 1994; Kalick et al. 1998). But here again, even if counterintuitive, our results 292
are in the same direction than a previous study showing a negative correlation between facial 293
attractiveness and SES for female (Hume and Montgomerie 2001). We cannot speculate on 294
this result, as the variance of SES in our female sample is very narrow (women were all 295
students at the university). However, we can suggest that it deserves more study (a lot of 296
research focused on the effect of attractiveness on SES, but less on the reverse relationship). 297
Spurious significant results may sometimes arise following model simplification 298
(Whittingham et al. 2006). This statistical bias is unlikely in this study, as all terms were kept 299
and no model simplification was performed. However, it is still possible that a confounding 300
variable, which remains to be identified, explains the link between expected age at menopause 301
and facial attractiveness. Moreover, further study is needed to specify the facial cues used by 302
men to detect residual reproductive value in young women (in this respect, figure S3 shows 303
the differences in face shape between women of high and low expected age at menopause). 304
Here, we investigated the mediating role of immediate fertility cues and facial ageing, as 305
residual reproductive value could potentially be linked to these two traits (Wood et al. 2001; 306
Gold 2011). The next step would be to consider a large range of facial features such as facial 307
symmetry, averageness, adiposity, skin colour, skin homogeneity, hair, etc., in an exploratory 308
attempt to detect the facial cues linked to expected age at menopause. Also, age at menopause 309
could additionally be assessed with more objective methods then self-report, for example by 310
using the serum antimüllerian hormone concentration (Disseldorp et al. 2008), or through 311
genetic analysis (He et al. 2009, 2010). Assuming that preferences reflect actual mate choice 312
(which remains to be established for this trait), men’s preference for women signalling a late 313
13
age at menopause - and thus a longer temporal reproductive window - could suggests a 314
current selection towards a later menopause, at least in Western societies. Interestingly, a 315
secular trend of increased menopausal age has recently been observed (vanNoord et al. 1997; 316
Rodstrom et al. 2003; Dratva et al. 2009). This suggests that the social, familial and cultural 317
conditions found today in Western societies are promoting current selection towards a later 318
menopause in women. As a consequence, studies carried out in these societies are probably 319
not adequate to empirically test evolutionary hypotheses on the ancestral selection on the 320
emergence or maintenance of an extensive post-reproductive life-span in the human lineage 321
(Thouzeau and Raymond 2017). Our results also suggest that sexual selection should be 322
included in studies investigating the evolution of menopause in humans. 323
Somatic senescence, or ageing, is readily detectable in a face through wrinkles, skin 324
texture and colouration, etc. (for a review, see Rhodes 2009). Those traits are specifically 325
targeted by cosmetic changes when a younger appearance is desirable. Facial traits correlated 326
with reproductive senescence have yet to be identified, and it remains to be determined 327
whether they can be, or are already, manipulated to increase attractiveness by signalling a 328
later menopause. 329
References 330
Abend P, Pflüger LS, Koppensteiner M, et al (2014) The sound of female shape: a redundant 331
signal of vocal and facial attractiveness. Evol Hum Behav 36:174–181. doi: 332
10.1016/j.evolhumbehav.2014.10.004 333
Abitbol J, Abitbol P, Abitbol B (1999) Sex hormones and the female voice. J Voice 13:424– 334
446. doi: 10.1016/s0892-1997(99)80048-4 335
Adler NE, Boyce T, Chesney MA, et al (1994) Socioeconomic status and health: The 336
challenge of the gradient. Am Psychol 49:15–24. doi: 10.1037/0003-066X.49.1.15 337
Avis NE, Stellato R, Crawford S, et al (2001) Is there a menopausal syndrome? Menopausal 338
status and symptoms across racial/ethnic groups. Soc Sci Med 52:345–356. doi: 339
10.1016/S0277-9536(00)00147-7 340
Boersma P, Weenink D (2013) Praat: doing phonetics by computer. 341
Butovskaya M, Sorokowska A, Karwowski M, et al (2017) Waist-to-hip ratio, body-mass 342
index, age and number of children in seven traditional societies. Sci Rep 7:1622. doi: 343
14 10.1038/s41598-017-01916-9
344
Buunk BP, Dijkstra P, Kenrick DT, Warntjes A (2001) Age preferences for mates as related to 345
gender, own age, and involvement level. Evol Hum Behav 22:241–250. 346
Carter AJ, Nguyen AQ (2011) Antagonistic pleiotropy as a widespread mechanism for the 347
maintenance of polymorphic disease alleles. BMC Med Genet 12:160. doi: 348
10.1186/1471-2350-12-160 349
Collins SA, Missing C (2003) Vocal and visual attractiveness are related in women. Anim 350
Behav 65:997–1004. doi: 10.1006/anbe.2003.2123 351
Cunningham MR, Roberts AR, Wu CH, et al (1995) Their Ideas of Beauty Are, on the Whole, 352
the Same as Ours - Consistency and Variability in the Cross-Cultural Perception of 353
Female Physical Attractiveness. J Pers Soc Psychol 68:261–279. 354
de Bruin JP, Bovenhuis H, van Noord PAH, et al (2001) The role of genetic factors in age at 355
natural menopause. Hum Reprod 16:2014–2018. doi: 10.1093/humrep/16.9.2014 356
Disseldorp J van, Faddy MJ, Themmen APN, et al (2008) Relationship of Serum 357
Antimüllerian Hormone Concentration to Age at Menopause. J Clin Endocrinol Metab 358
93:2129–2134. doi: 10.1210/jc.2007-2093 359
Dixson BJW, Lee AJ, Sherlock JM, Talamas SN (2017) Beneath the beard: do facial 360
morphometrics influence the strength of judgments of men’s beardedness? Evol Hum 361
Behav 38:164–174. doi: 10.1016/j.evolhumbehav.2016.08.004 362
Dratva J, Real FG, Schindler C, et al (2009) Is age at menopause increasing across Europe? 363
Results on age at menopause and determinants from two population-based studies. 364
Menopause- J North Am Menopause Soc 16:385–394. 365
Evans S, Neave N, Wakelin D, Hamilton C (2008) The relationship between testosterone and 366
vocal frequencies in human males. Physiol Behav 93:783–788. doi: 367
10.1016/j.physbeh.2007.11.033 368
Farkas L (1987) Age-and sex-related changes in facial proportions. Anthr Facial Proportions 369
Med Springf Charles C Thomas P 29–56. 370
Feinberg DR (2008) Are human faces and voices ornaments signaling common underlying 371
cues to mate value? Evol Anthropol 17:112–118. doi: 10.1002/evan.20166 372
Feinberg DR, Jones BC, DeBruine LM, et al (2005) The voice and face of woman: One 373
ornament that signals quality? Evol Hum Behav 26:398–408. 374
Fink B, Neave N (2005) The biology of facial beauty. Int J Cosmet Sci 27:317–325. doi: 375
10.1111/j.1467-2494.2005.00286.x 376
Gold EB (2011) The Timing of the Age at Which Natural Menopause Occurs. Obstet Gynecol 377
Clin North Am 38:425–440. doi: 10.1016/j.ogc.2011.05.002 378
Hamilton WD (1966) The moulding of senescence by natural selection. J Theor Biol 12:12– 379
45. doi: 10.1016/0022-5193(66)90184-6 380
Harries M, Hawkins S, Hacking J, Hughes I (1998) Changes in the male voice at puberty: 381
vocal fold length and its relationship to the fundamental frequency of the voice. J 382
Laryngol Otol 112:451–454. 383
15
He C, Kraft P, Chasman D, et al (2010) A large-scale candidate gene association study of age 384
at menarche and age at natural menopause. Hum Genet 128:515–527. doi: 385
10.1007/s00439-010-0878-4 386
He C, Kraft P, Chen C, et al (2009) Genome-wide association studies identify loci associated 387
with age at menarche and age at natural menopause. Nat Genet 41:724–728. doi: 388
http://www.nature.com/ng/journal/v41/n6/suppinfo/ng.385_S1.html 389
Henss R (2000) Waist-to-hip ratio and female attractiveness. Evidence from photographic 390
stimuli and methodological considerations. Personal Individ Differ 28:501–513. 391
Hume DK, Montgomerie R (2001) Facial attractiveness signals different aspects of “quality” 392
in women and men. Evol Hum Behav 22:93–112. 393
Jasienska G, Ziomkiewicz A, Ellison PT, et al (2004) Large breasts and narrow waists indicate 394
high reproductive potential in women. Proc R Soc B-Biol Sci 271:1213–1217. 395
Johnston VS, Franklin M (1993) Is Beauty in the Eye of the Beholder. Ethol Sociobiol 396
14:183–199. 397
Jones BC (2014) Agreement and Individual Differences in Men’s Preferences for Women’s 398
Facial Characteristics. In: Evolutionary Perspectives on Human Sexual Psychology 399
and Behavior. Springer, New York, NY, pp 87–102 400
Kalick SM, Zebrowitz LA, Langlois JH, Johnson RM (1998) Does Human Facial 401
Attractiveness Honestly Advertise Health? Longitudinal Data on an Evolutionary 402
Question. Psychol Sci 9:8–13. doi: 10.1111/1467-9280.00002 403
Koehler N, Simmons LW, Rhodes G, Peters M (2004) The relationship between sexual 404
dimorphism in human faces and fluctuating asymmetry. Proc R Soc B-Biol Sci 405
271:S233–S236. 406
Kwart DG, Foulsham T, Kingstone A (2012) Age and beauty are in the eye of the beholder. 407
Perception 41:925–938. 408
Lassek WD, Gaulin SJC (2007) Menarche is related to fat distribution. Am J Phys Anthropol 409
133:1147–1151. doi: 10.1002/ajpa.20644 410
Law Smith MJ, Perrett DI, Jones BC, et al (2006) Facial appearance is a cue to oestrogen 411
levels in women. Proc R Soc B-Biol Sci 273:135–140. 412
Lee AJ, Mitchem DG, Wright MJ, et al (2014) Genetic Factors That Increase Male Facial 413
Masculinity Decrease Facial Attractiveness of Female Relatives. Psychol Sci 25:476– 414
484. doi: 10.1177/0956797613510724 415
Little AC, Jones BC, DeBruine LM (2011) Facial attractiveness: evolutionary based research. 416
Philos Trans R Soc B Biol Sci 366:1638–1659. doi: 10.1098/rstb.2010.0404 417
Lynch M, Walsh B (1998) Genetics and analysis of quantitative traits. Sinauer Associates, 418
Sunderland 419
Maestripieri D, Klimczuk ACE, Traficonte DM, Wilson MC (2014) A greater decline in 420
female facial attractiveness during middle age reflects women’s loss of reproductive 421
value. 422
Marcinkowska UM, Dixson BJ, Kozlov MV, Rantala MJ (2015) Men’s Preferences for 423
16
Female Facial Femininity Decline With Age. J Gerontol B Psychol Sci Soc Sci. doi: 424
10.1093/geronb/gbv077 425
Marcinkowska UM, Kozlov MV, Cai H, et al (2014) Cross-cultural variation in men’s 426
preference for sexual dimorphism in women’s faces. Biol Lett. doi: 427
10.1098/rsbl.2013.0850 428
Mondragón-Ceballos R, Garcia Granados MD, Cerda-Molina AL, et al (2015) Waist-to-Hip 429
Ratio, but Not Body Mass Index, Is Associated with Testosterone and Estradiol 430
Concentrations in Young Women. 431
Morris DH, Jones ME, Schoemaker MJ, et al (2011) Familial concordance for age at natural 432
menopause: results from the Breakthrough Generations Study. Menopause 18:956– 433
961. 434
Murabito JM, Yang Q, Fox C, et al (2005) Heritability of age at natural menopause in the 435
Framingham Heart Study. J Clin Endocrinol Metab 90:3427–3430. 436
Nenko I, Jasienska G (2009) Fertility, body size, and shape: An empirical test of the covert 437
maternal depletion hypothesis. Am J Hum Biol 21:520–523. doi: 10.1002/ajhb.20938 438
Perrett DI, Lee KJ, Penton-Voak I, et al (1998) Effects of sexual dimorphism on facial 439
attractiveness. Nature 394:884–887. 440
Pfluger LS, Oberzaucher E, Katina S, et al (2012) Cues to fertility: perceived attractiveness 441
and facial shape predict reproductive success. Evol Hum Behav 33:708–714. 442
Pipitone RN, Gallup GG (2008) Women’s voice attractiveness varies across the menstrual 443
cycle. Evol Hum Behav 29:268–274. 444
Puts DA, Bailey DH, Cardenas RA, et al (2013) Women’s attractiveness changes with 445
estradiol and progesterone across the ovulatory cycle. Horm Behav 63:13–19. 446
Puts DA, Jones BC, DeBruine LM (2012) Sexual Selection on Human Faces and Voices. J 447
Sex Res 49:227–243. doi: 10.1080/00224499.2012.658924 448
Rhodes G (2006) The evolutionary psychology of facial beauty. In: Annual Review of 449
Psychology. Annual Reviews, Palo Alto, pp 199–226 450
Rhodes G, Chan J, Zebrowitz LA, Simmons LW (2003) Does sexual dimorphism in human 451
faces signal health? Proc R Soc Lond B Biol Sci 270:S93–S95. doi: 452
10.1098/rsbl.2003.0023 453
Rhodes MG (2009) Age Estimation of Faces: A Review. Appl Cogn Psychol 23:1–12. 454
Rodstrom K, Bengtsson C, Milsom I, et al (2003) Evidence for a secular trend in menopausal 455
age: a population study of women in Gothenburg. Menopause- J North Am 456
Menopause Soc 10:538–543. 457
Scott IML, Pound N, Stephen ID, et al (2010) Does Masculinity Matter? The Contribution of 458
Masculine Face Shape to Male Attractiveness in Humans. 459
Singh D (1993) Body Shape and Women’s Attractiveness - the Critical Role of Waist-to-Hip 460
Ratio. Hum Nat- Interdiscip Biosoc Perspect 4:297–321. 461
Singh D (2002) Female mate value at a glance: Relationship of waist-to-hip ratio to health, 462
17
fecundity and attractiveness. Neuroendocrinol Lett 23:81–91. 463
Singh D, Dixson BJ, Jessop TS, et al (2010) Cross-cultural consensus for waist-hip ratio and 464
women’s attractiveness. Evol Hum Behav 31:176–181. 465
Singh D, Randall PK (2007) Beauty is in the eye of the plastic surgeon: Waist-hip ratio 466
(WHR) and women’s attractiveness. Personal Individ Differ 43:329–340. doi: 467
10.1016/j.paid.2006.12.003 468
Smith HMJ, Dunn AK, Baguley T, Stacey PC (2016) Concordant Cues in Faces and Voices: 469
Testing the Backup Signal Hypothesis. Evol Psychol. doi: 470
10.1177/1474704916630317 471
Snieder H, MacGregor AJ, Spector TD (1998) Genes Control the Cessation of a Woman’s 472
Reproductive Life: A Twin Study of Hysterectomy and Age at Menopause. J Clin 473
Endocrinol Metab 83:1875–1880. doi: 10.1210/jcem.83.6.4890 474
Stepaniak U, Szafraniec K, Kubinova R, et al (2013) Age at natural menopause in three 475
Central and Eastern European urban populations: The HAPIEE study. Maturitas 476
75:87–93. 477
Sugiyama LS (2015) Physical Attractiveness: An Adaptationist Perspective. In: The 478
Handbook of Evolutionary Psychology. John Wiley & Sons, Inc., 479
Symons D (1995) Beauty is in the adaptations of the beholder: The evolutionary psychology 480
of human female sexual attractiveness. Sex Nat Sex Cult 80–118. 481
Thomas F, Renaud F, Benefice E, et al (2001) International variability of ages at menarche 482
and menopause: Patterns and main determinants. Hum Biol 73:271–290. 483
Thornhill R, Grammer K (1999) The Body and Face of Woman: One Ornament that Signals 484
Quality? Evol Hum Behav 20:105–120. doi: 10.1016/S1090-5138(98)00044-0 485
Thouzeau V, Raymond M (2017) Emergence and maintenance of menopause in humans: A 486
game theory model. J Theor Biol 430:229–236. doi: 10.1016/j.jtbi.2017.07.019 487
Tiddeman B p., Stirrat M r., Perrett D i. (2005) Towards Realism in Facial Image 488
Transformation: Results of a Wavelet MRF Method. Comput Graph Forum 24:449– 489
456. doi: 10.1111/j.1467-8659.2005.00870.x 490
van Asselt KM, Kok HS, Pearson PL, et al (2004) Heritability of menopausal age in mothers 491
and daughters. Fertil Steril 82:1348–1351. 492
vanNoord PAH, Dubas JS, Dorland M, et al (1997) Age at natural menopause in a population-493
based screening cohort: The role of menarche, fecundity, and lifestyle factors. Fertil 494
Steril 68:95–102. 495
Velde T, R E, Pearson PL (2002) The variability of female reproductive ageing. Hum Reprod 496
Update 8:141–154. doi: 10.1093/humupd/8.2.141 497
Wheatley JR, Apicella CA, Burriss RP, et al (2014) Women’s faces and voices are cues to 498
reproductive potential in industrial and forager societies. Evol Hum Behav 35:264– 499
271. doi: 10.1016/j.evolhumbehav.2014.02.006 500
Whittingham MJ, Stephens PA, Bradbury RB, Freckleton RP (2006) Why do we still use 501
stepwise modelling in ecology and behaviour? J Anim Ecol 75:1182–1189. 502
18
Wood JW, O’Connor KA, Holman DJ, et al (2001) The evolution of menopause by 503
antagonistic pleiotropy. Cent Stud Demogr Ecol Work Pap 1–4. 504
Zelditch ML, Swiderski DL, Sheets HD (2012) Geometric Morphometrics for Biologists: A 505
Primer. Academic Press 506
Zelditch ML, Swiderski DL, Sheets HD (2013) A Practical Companion to Geometric 507
Morphometrics for Biologists: Running analyses in freely-available software. 508
19 Tables and figures captions
510
Table 1. Effects of the different variables on the probability to be chosen during the test of
511
attractiveness (male raters had to choose the woman found to be the most attractive between 512
two facial photographs). N = 3439 observations (119 male raters and 68 female faces). Model 513
1 only includes the variable of interest (mother’s age at menopause), and the control 514
variables. Model 2 also includes cues of immediate fertility and facial ageing as explanatory 515
variables. Significance codes: *** p < 0.001; ** p < 0.01; * p< 0.05. 516 Model 1 Model 2 Estimate Std. Error z value Pr(>|z|) Estimate Std. Error z value Pr(>|z|) (Intercept) 0.092 0.121 0.762 0.446 0.096 0.112 0.861 0.389 Mother's age at menopause† 0.217 0.053 4.129 < 0.001 *** 0.240 0.053 4.516 < 0.001 *** WHR† ‐ ‐ ‐ ‐ 0.132 0.057 2.321 0.020 * Facial femininity† ‐ ‐ ‐ ‐ 0.404 0.057 7.148 < 0.001 *** F0† ‐ ‐ ‐ ‐ 0.200 0.058 3.469 0.001 ** Age† ‐0.204 0.053 ‐3.883 < 0.001 *** ‐0.271 0.058 ‐4.683 < 0.001 *** Facial ageing † ‐ ‐ ‐ ‐ ‐0.563 0.060 ‐9.350 < 0.001 *** Smile† 0.335 0.053 6.364 < 0.001 *** 0.271 0.058 4.662 < 0.001 *** Socio‐economic status† ‐0.067 0.052 ‐1.302 0.193 ‐0.170 0.057 ‐3.009 0.003 ** Raters' characteristics Age ‐0.033 0.061 ‐0.548 0.584 ‐0.041 0.063 ‐0.642 0.521 Socio‐economic status ‐0.015 0.061 ‐0.252 0.801 ‐0.012 0.063 ‐0.187 0.852
†For each of these variables, the difference between the two women presented was integrated
517
into the model. 518
Table 2. Pearson’s correlations between measures in the female sample (N=68 women).
519 Significance codes: *** p < 0.001; ** p < 0.01; * p < 0.05. 520 Age Mother's age at menopause F0 WHR Facial femininity Facial ageing Mother's age at menopause 0.07 F0 ‐0.10 0.07 WHR 0.22 ‐0.04 0.01 Facial femininity ‐0.20 ‐0.13 0.03 ‐0.01 Facial ageing ‐0.23 ‐0.08 ‐0.13 ‐0.03 0.24 Socio‐economic status 0.05 0.13 0.08 0.20 ‐0.18 ‐0.29* 521
20
Figure 1. Example of screenshot during the evaluation of women’s facial attractiveness by the
522
raters. For each pair of women, which was randomly chosen, the rater was instructed to click 523
on the photograph of the woman that he found the most attractive. Photographs reproduced 524
with permission. 525
Figure 2. Predicted probability to be chosen during the test of attractiveness, according to the
526
difference in expected age at menopause (unstandardized values) between the focal and the 527
non-focal women, controlling for all the other variables of model 2. Circle areas are 528
proportional to the number of choices made by the raters: chosen (1) or not (0) as the most 529
attractive woman. 95% confidence interval is represented by the dotted lines. 530
Figure 3. Relationship between age at menopause of mothers and maternal grandmothers.
531
Plain line represents the linear regression with all points (β = 0.275, SE = 0.11, P = 0.016, 532
corresponding to a heritability of age at menopause h2 = 0.55). 95% confidence interval in
533 grey. 534 535 Supporting Information 536
Figure S1. Results of the Principal Component Analysis (PCA) conducted on the
Procrustes-537
registered landmarks and semi-landmarks data. This PCA produced shape variables which are 538
a decomposition of the landmark coordinates of the female (black dots) and male (grey dots) 539
faces. Only the two first components (or shape variables) are represented here. 540
Figure S2. Example of screenshot during the evaluation of women’s age by the raters. The
541
rater was instructed to estimate the women’s age. The age appearing by default for each 542
picture was randomized. For each woman, the difference between their real age and the mean 543
age given by the raters was calculated. This variable represents the facial ageing of the 544
women. Photograph reproduced with permission. 545
Figure S3. Top: Shape differences of a low expected reproductive value face (average face of
546
the 7 women with the earlier expected age at menopause in our sample) relative to the average 547
face (average of all the women’s face in our study), on a Thin-Plate Spline (TPS) grid. 548
Bottom: shape differences of a high expected reproductive value face (average face of the 7 549
women with the later expected age at menopause) relative to the average face. For both, the 550
shape deformation has been magnified by 2. Figure created using R package Geomorph 3.0.3. 551
21
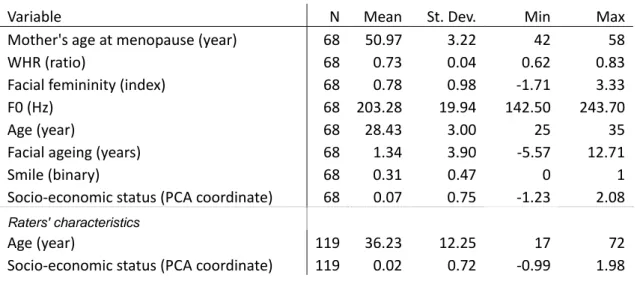
Table S4. Descriptive statistics
553
Variable N Mean St. Dev. Min Max
Mother's age at menopause (year) 68 50.97 3.22 42 58 WHR (ratio) 68 0.73 0.04 0.62 0.83 Facial femininity (index) 68 0.78 0.98 ‐1.71 3.33 F0 (Hz) 68 203.28 19.94 142.50 243.70 Age (year) 68 28.43 3.00 25 35 Facial ageing (years) 68 1.34 3.90 ‐5.57 12.71 Smile (binary) 68 0.31 0.47 0 1 Socio‐economic status (PCA coordinate) 68 0.07 0.75 ‐1.23 2.08 Raters' characteristics Age (year) 119 36.23 12.25 17 72 Socio‐economic status (PCA coordinate) 119 0.02 0.72 ‐0.99 1.98 554