Supporting Information
Covalent Triazine Frameworks Incorporating Charged Polypyrrole Channels for High Performance Lithium-Sulfur Batteries
Jiheon Kim,†,‡ Ahmed Elabd,§,‡ Sung-Yoon Chung,*, † Ali Coskun,*, § Jang Wook Choi*, ҩ †Department of Materials Science and Engineering, Korea Advanced Institute of Science and Technology, 291 Daehak-ro, Yuseong-gu, Daejeon 34141, Republic of Korea
§Department of Chemistry, University of Fribourg, Chemin de Musee 9, Fribourg 1700, Switzerland. ҩSchool of Chemical and Biological Engineering and Institute of Chemical Processes, Seoul National University, 1 Gwanak-ro, Gwanak-gu, Seoul 08826, Republic of Korea
Figure S1. XRD spectra of elemental sulfur, S-CTF 0%, S-CTF 1%,
Figure S2. C 1s XPS profiles of (a) cPpy-S-CTF 0%, (b) cPpy-S-CTF 1% (c) cPpy-S-CTF
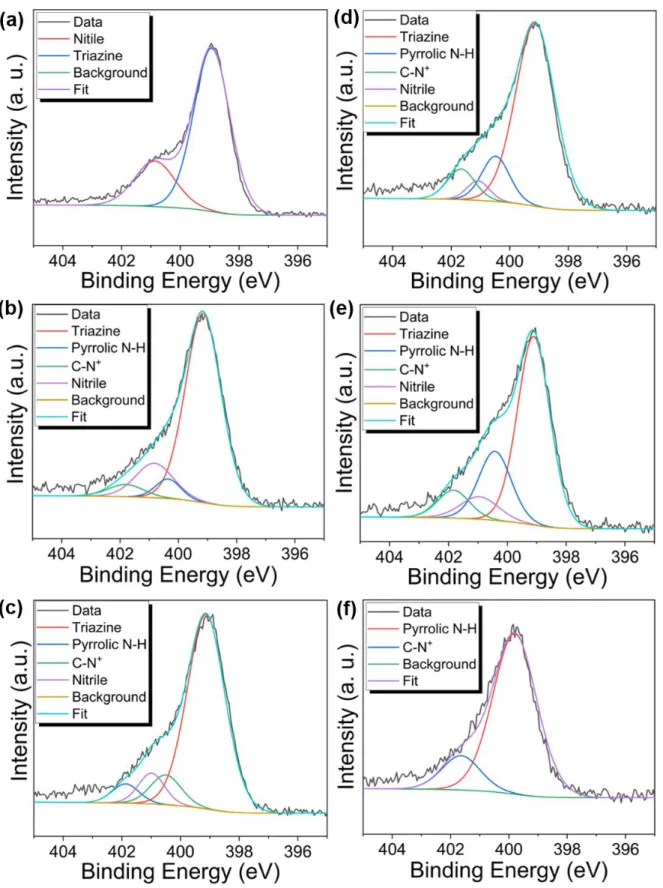
Figure S3. N 1s XPS profiles of (a) cPpy-S-CTF 0%, (b) cPpy-S-CTF 1% (c) cPpy-S-CTF
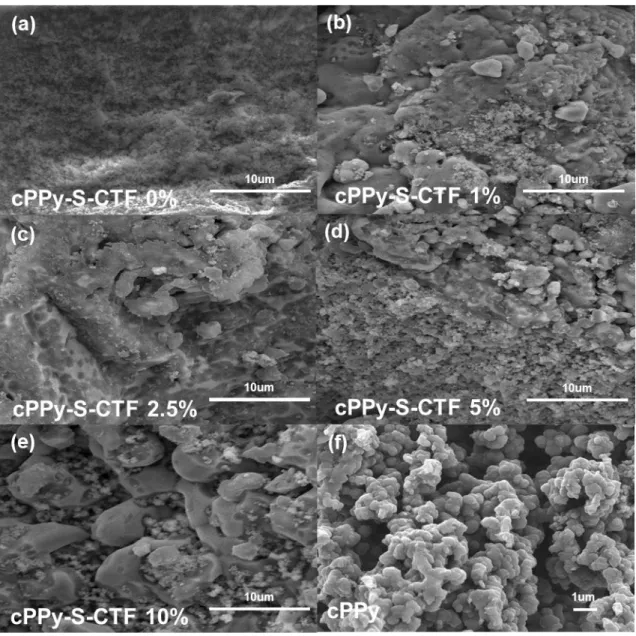
Figure S4. SEM images of various cPpy-S-CTFs. (a) cPpy-S-CTF 0%. (b) cPpy-S-CTF
Figure S5. (a) Calculated Rouquerol plot of cPpy-CTF 0% according to pressure range used
for the BET surface area calculation. (b) BET Linear plot of cPpy-CTF 0% obtained from nitrogen isotherms at 77 K. The selected points are located in the pressure ranges of 0.01 to 0.18 according to the Rouquerol plot.
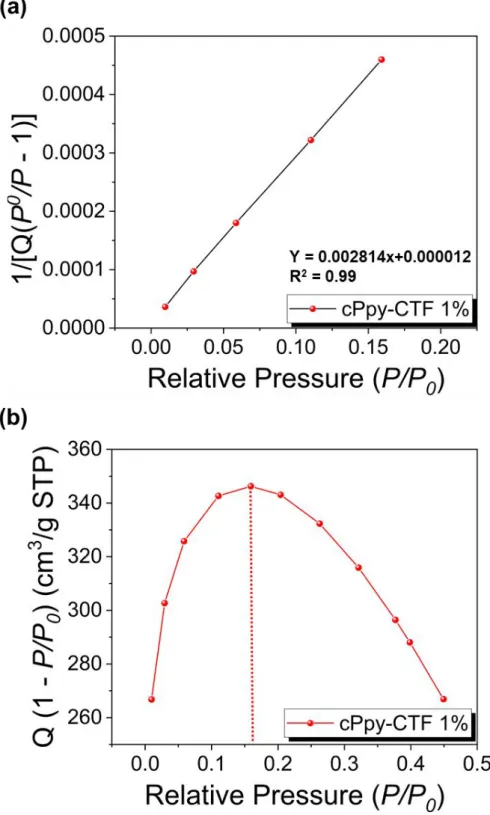
Figure S6. (a) Calculated Rouquerol plot of cPpy-CTF 1% according to pressure range used
for the BET surface area calculation. (b) BET Linear plot of cPpy-CTF 1% obtained from nitrogen isotherms at 77 K. The selected points are located in the pressure ranges of 0.01 to
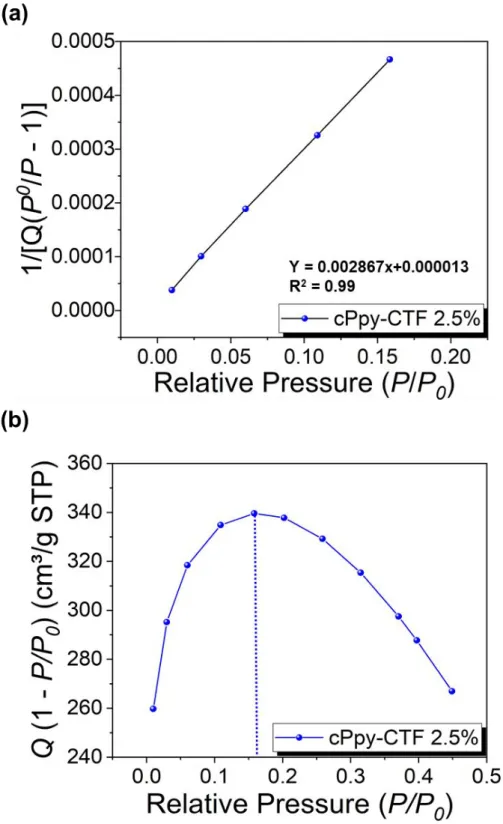
Figure S7. (a) Calculated Rouquerol plot of cPpy-CTF 2.5% according to pressure
ra-nge used for the BET surface area calculation. (b) BET Linear plot of cPpy-CTF 2.5 % obtained from nitrogen isotherms at 77 K. The selected points are located in the p ressure ranges of 0.01 to 0.18 according to the Rouquerol plot.
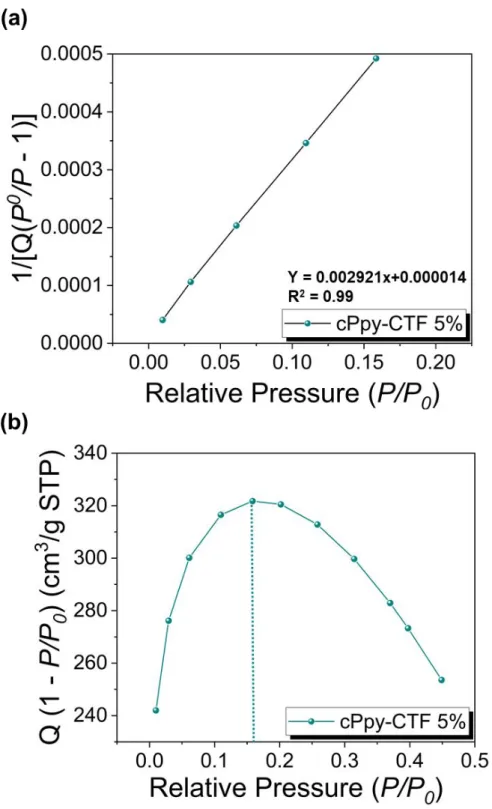
Figure S8. (a) Calculated Rouquerol plot of cPpy-CTF 5% according to pressure range used
for the BET surface area calculation. (b) BET Linear plot of cPpy-CTF 5% obtained from nitrogen isotherms at 77 K. The selected points are located in the pressure ranges of 0.01 to
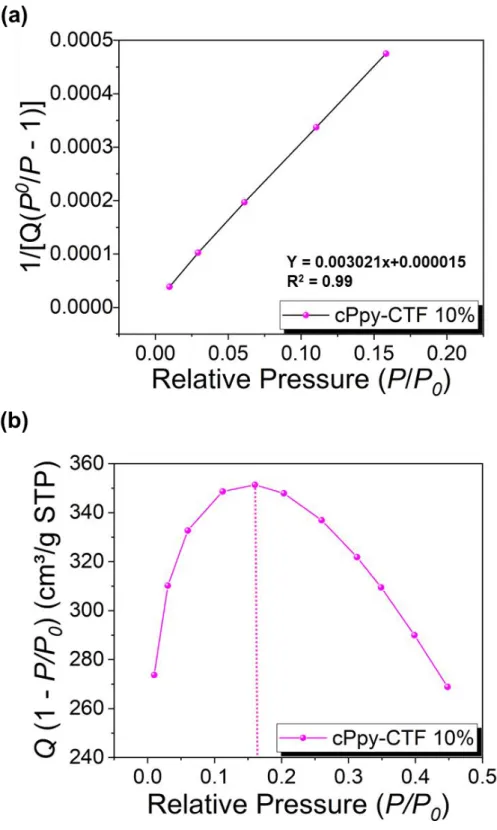
Figure S9. (a) Calculated Rouquerol plot of cPpy-CTF 10% according to pressure range used
for the BET surface area calculation. (b) BET Linear plot of cPpy-CTF 10% obtained from nitrogen isotherms at 77 K. The selected points are located in the pressure range of 0.01 to 0.18 according to the Rouquerol plot.
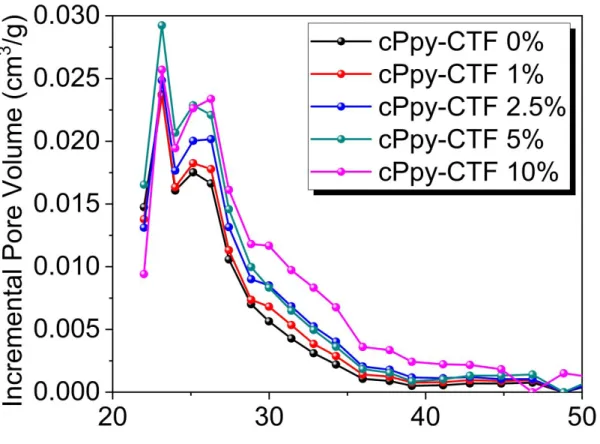
Figure S10. NLDFT pore size distributions of various cPpy-CTFs using standard carbon slit
Figure S11. Visual effects of the 3 mM Li2S6 in DOL/DME (1:1 v/v) solution when exposed to various cPpy-CTFs over 3, 6 and 24 h (a, b, c). Time dependent UV-Vis absorption spectra of (d) cPpy-CTF 1%, (e) cPpy-CTF 5%, and (f) cPpy alone in 3 mM Li2S6 in DOL/DME (1:1 v/v) solution. (g) Plots of UV–Vis absorbance changes with time.
Figure S12. (a) Cycling performance and coulombic efficiencies of cPpy-S-CTFs at 1C and
0.8 mgsulfur cm–2 for 500 cycles. (d) Cycling performance and Coulombic efficiencies of cPpy-S-CTFs at 2C and 0.8 mgsulfur cm–2 for 300 cycles.
Figure S13. (a) First discharge–charge profiles of bare cPpy at 0.05C (1st cycle) and 0.5C (subsequent cycles) in the potential range 1.8–2.7 V. (b) Overlaid first discharge -charge profiles of cPpy-S-CTFs and cPpy at 0.05C in the potential range 1.8–2.7 V.
Figure S14. CV plots of (a) cPpy-S-CTF 0%, (b) cPpy-S-CTF 2.5%, and (c) cPpy-S-CTF 5%
in the potential range 1.8–2.7 V at various scan rates (0.05–0.5 mV s–1). Plots of CV peak current vs. the square root of scan rate for (d) cathodic reaction 1 (S8 → Li2S4), (e) cathodic
Figure S15. Nyquist plots of cPpy-S-CTFs (0–10%). (a) Before cycling, (b) after 100th charge, and (c) after 100th discharge.
Table S1. ID/IG values calculated from Raman spectroscopy of various cPpy-S-CTFs.
Samples ID [a.u.] IG [a.u.] ID/IG
cPpy-S-CTF 0% 7897 8395 0.941
cPpy-S-CTF 1% 7858 8366 0.939
cPpy-S-CTF 2.5% 7651.5 7996 0.956
cPpy-S-CTF 5% 6986 7368 0.948
Table S2. Textural Properties of various cPpy-S-CTFs. Samples BET a) [m2g–1] Smicro b) [m2g–1] Sext [m2g–1] Vmicro c) [cm3g–1] Vext d) [cm3g–1] Vtotal e) [cm3g–1] CTF-0% Ppy 1561 1472 89 0.70 0.10 0.80 CTF-1% Ppy 1539 1412 127 0.68 .12 0.80 CTF-2.5% Ppy 1511 1379 132 0.67 0.13 0.80 CTF-5% Ppy 1497 1332 165 0.65 .17 0.82 CTF-10% Ppy 1483 1298 184 0.64 0.19 0.83
a) Brunauer–Emmett–Teller (BET) surface area calculated over the pressure range (P/P
o) of
0.01–1.0. b) Micro pore surface area calculated using t-plot method. c) Micro pore volume calculated using t-plot method. Total pore volume obtained at P/Po = 0.99. e) Vext =Vtotal – Vmicro.
Table S3. EIS results of cPpy-S-CTF 0, 1, 2.5, 5, and 10% before cycling, after 100
cycles of full charge and discharge.
Samples Resistance Before Cycling After 100
th cycle (Full charge) After 100th cycle (Full discharge) Ro [Ω] 3.5 15.6 40.3 Rct [Ω] 16.7 6.0 21.5 cPpy-S-CTF 0% Rs [Ω] - 11.2 14.0 Ro [Ω] 3.1 10.9 13.4 Rct [Ω] 16.4 5.8 20.2 cPpy-S-CTF 1% Rs [Ω] - 11.8 12.8 Ro [Ω] 2.7 7.8 8.7 Rct [Ω] 15.7 5.1 15.2 cPpy-S-CTF 2.5% Rs [Ω] - 9.1 11.8 Ro [Ω] 2.8 9.5 10.6 Rct [Ω] 15.4 4.6 15.9 cPpy-S-CTF 5% Rs [Ω] 10.1 12.4 Ro [Ω] 3.2 10.1 13.0 Rct [Ω] 14.7 5.2 18.9 cPpy-S-CTF 10% Rs [Ω] 10.9 13.9