Economic Impacts of the Urban Ring
-
A Spatial Analysis
By
Waiduen V. Lee
Bachelor of Science in Environmental Economics and Policy
Bachelor of Arts in Economics
University of California at Berkeley, 1998
Submitted to the Department of Urban Studies and Planning
in partial fulfillment of the requirements for the degree of
Master in City Planning
at the
MASSACHUSETTS INSTITUTE OF TECHNOLOGY
June 2001
@ 2001 Waiduen Lee. All Rights Reserved
geaumo**''"*y reant to Mo
AMl
rduc
a ndwmt
1a~we
usdd V
Sa
p
Department of Urban
Certified by
Department oT Urban,-
A
Studies and Planning
May 17, 2001
Joseph
rreira, Jr.
Studie and Planning
Thesis Supervisor
Accepted by
Professor Dennis Frenchman
Chair, MCP Committee
Department of Urban Studies and Planning
Author
'ZoTC)
- - r
Economic Impacts of the Urban Ring
-
A Spatial Analysis
by
Waiduen V. Lee
Submitted to the Department of Urban Studies and Planning, MIT on May 17, 2001
in partial fulfillment of the requirements for the Degree of Master in City Planning.
ABSTRACT
Many projects are targeted at stimulating economic development. Some research has
studied the overall economic impacts of development proposed. However, quantitative
studies of the spatial distribution of economic impacts are often neglected. In this thesis, I
study ways of modeling the spatial distribution of economic impacts from regional
infrastructure investments. For this study, I assume that certain distributional impacts
depend upon estimated neighborhood-to-neighborhood changes in travel time. I use the
proposed Urban Ring in the Greater Boston Area as my case study, and origin-destination
(O-D) data for metropolitan Boston to identify current journey-to-work commuting
patterns. However, the existing set of ridership data from the Census Transportation
Planning Package (CTPP) are time and skill demanding to manipulate. I also estimate
ridership using residential and job location data without the O-D matrix. I find that the
fractions of total travel time savings are the largest in Allston / Brighton, Jamaica Plain,
and Roxbury. These neighborhoods are characterized by large population sizes and high
population densities; they locate in between the Central Business District and the suburb.
Between the results computed from the two sets of ridership data, there are some
differences in magnitude, but not in the general ranking, of neighborhood impacts.
Thesis Advisor:
Joseph Ferreira, Jr.
Title:
Professor of Urban Studies and Operations Research
Department of Urban Studies and Planning, MIT
Thesis Readers:
Karen R. Polenske
Professor of Regional Political Economy and Planning
Department of Urban Studies and Planning, MIT
Ralph Gakenheimer
Professor of Urban Planning
ACKNOWLEDGEMENTS
I must thank Professor Joseph Ferreira for his insightful opinions, tremendous help
with data analysis, encouragement, support, and most importantly, his precious time
while I was working on the thesis. It is a wonderful experience working with Joe. I am
grateful to Professor Ralph Gakenheimer for sharing his experiences in transportation
issues and scenario build-out, and Professor Karen R. Polenske for introducing me to
the Urban Ring project and leading me through the methodologies to economic impacts
analysis.
I also want to thank other individuals from MIT. The Planning Support Systems (PSS)
Group in the Department of Urban Studies and Planning offered me great help with data
collection. The following people deserve my special thanks: Ming Zhang, Anne
Thompson, Mizuki Kawabata, Myoung-Gu Kang, Jiawen Yang, and Tom Grayson.
Victor Rivas, my team partner in the Regional Socioeconomic Impact Analyses and
Modeling class, has helped me a lot in sorting out the main issues of the Project. Nicolas
Rockler has given me a lot of insightful comments on application of the REMI model.
Staff members of the Boston Redevelopment Authority (BRA) have helped me a lot
from the very beginning of the research. John Avault has been very enthusiastic and
encouraging, and has given me so many inspirations. Greg Perkins very generously
offered his office and computer to me so that I could finish my analysis. Rolf Goetze has
helped me with GIS data and has given me constructive feedbacks on how to produce
good maps, and Richard Garver has been very supportive to me and introduced me to
different individuals and parties involved in the project.
Individuals from the transportation agencies also deserve my thanks. Peter Calcaterra,
Project Manager of the Urban Ring from MBTA has given me a lot of insider's
information. Vijay Mihal from the Central Transportation Planning Staff (CTPS) has
been so kind to share all information he knows of with me. George Sanborn from the
State Transportation Library has helped me a lot with information that cannot be found
anywhere else. My conversation with William Kuttner is also very inspirational.
Of course, I have to thank my parents for supporting me in every way for more than
twenty years. Lastly, I must express my gratefulness to Joseph Wu for his support,
understanding, and scripts.
TABLE OF CONTENTS Chapter 1 Introduc 1.1 Research Object 1.2 Current Method Transportation I 1.3 Research Backg 1.4 Research Specif 1.5 Thesis Structure Chapter 2 Curre 2.1 Population Dens 2.2 Economic Activ tion 1 ive 1
s to Study Travel Time Savings and Economic Impacts of
nfrastructure Projects 1
round 2
ics and Data 3
5
it Spatial Pattern in Metropolitan Boston 6
ity and Other Demographic Characteristics 6
iies 9
2.3 Radial Transit System
2.4 Dominant Mode of Transportation
2.5 Land Use
2.6 Disadvantageous Neighborhoods
2.7 The Urban Rina
Chapter 3 Methodology 20
3.1 Introduction 20
3.2 Geographic Unit of Analysis 20
3.3 Factors Contributing to Spatial Distribution of Savings in Travel Time 21
3.3.1 General Assumptions 22
3.3.2 Residence-Work Travel Time Savings 23
3.3.2.1 Origin and Destination 23
3.3.2.2 Trip Distance Estimation 24
3.3.2.3 Change in Travel Distance 26
3.3.2.4 Zero Distance Saved for Peripheral Trips 28
3.3.3 Ridership of each Residence-Work Trip 30
3.3.3.1 Using CTPP Data 30
Savings at Neighborhood Level 31
At Per Capita Level 32
3.3.3.2 Using Residential and Job Location Data 32
Place of Origin / Residence 33
Places of Destination / Work 33
Effective Savings in Residence-Work Trip Distance at Neighborhood Level 34
Cross-County Trips 35
3.3.4 Other Factors that Affect Travel Time / Distance Savings as a result of the
Chapter 4 Results - Travel Time Savings Distribution 39
4.1 Results using CTPP Ridership Data 39
4.1.1 General Pattern - At Neighborhood Level 41
4.1.1.1 Proximity to the Urban Ring and Downtown 41
Savings in Travel Distance 42
Population Size and Population Density 43
4.1.1.2 Commuting Behavior 44
4.1.1.3 Number of Trips Made in the Neighborhood 45
4.1.1.4 Conclusion - General Pattern 46
4.1.2 Scenario-Specific Observations 47
4.1.2.1 Relationship between Locations, Population Sizes and Densities, and
Preference over Mode of Transportation 50
Public Transportation Services Provision 50
Opportunity Costs of Riding the Transit 51
4.1.3 Results - at Per Capita Level 53
4.2 Assigning Zero Distance Savings to Periphery Trips 55
4.2.1 Results - at Neighborhood Level 56
4.2.2 Results - at Per Capita Level 57
4.2.3 General Observations 58
4.2.3.1 At Neighborhood Level 58
4.2.3.2 At Per Capita Level 59
4.2.4 Comparing Passenger-miles Savings at the Neighborhood Level versus
Passenger-miles Savings to an Average Commuter 60
4.3 Results using Ridership Estimated with Residential and Job Location Data 60
4.3.1 General Pattern - at Neighborhood Level 62
4.3.1.1 Proximity to the Urban Ring and Downtown 62
4.3.1.2 Number and Share of Employed Residents in the Neighborhood 63
4.3.2 Scenario-Specific Observations 65
4.4 Conclusion 66
Chapter 5 Comparison between Results from the Two Sets of Data:
Ridership from CTPP versus Ridership Estimated with Residential
and Job Location Data 68
5.1 Introduction 68
5.2 Results 70
5.3 Overall Observations for Suffolk County 71
5.4 More Detailed Observations for Neighborhoods 72
5.4.1 Neighborhoods where Results from Census Data are Higher in Both
Scenarios 75
5.4.2 Neighborhoods where Results form Census Data are Lower in Both
Scenarios 76
5.4.3 Neighborhoods where Results from Census Data are Lower in One Scenario
Only 78
5.5 Conclusion: General Applicability of Estimating Residence-Work Ridership
Chapter 6 Discussions: Limitation of the Model, Data, and its Usefulness in
Analyzing Economic Impacts 83
6.1 Introduction 83
6.2 Limitations of the Model 85
6.2.1 Assumptions on Travel Behavior 85
6.2.1.1 Representative Points 85
6.2.1.2 Utility of the Urban Ring 86
6.2.2 Assumptions of the Model 86
6.2.2.1 Static Nature 86
6.2.2.2 Area of Analysis 87
6.3 Data Constraints 87
6.3.1 Outdatedness 87
6.3.2 Static Nature 88
6.4 Usefulness of the Model in Analyzing Economic Impacts 88
Chapter 7 Conclusion 90
7.1 Review: Distribution of Travel Time Savings 90
7.2 Review: Distribution of Economic Impacts 93
7.3 Final Words 94
Appendix A Integrating Travel Tine Savings Distribution and Economic Impacts
Maps, Appendices, and Figures Appendix B
LIST OF TABLES
Table 2.1 Population Sizes and Densities of Each Suffolk County Neighborhood and
Neighborhood Cities 8
Table 2.2 Boston as Percentage of CMSA, Private-Sector Employment, 1972 and
1990 11
Table 2.3 Direct vs. Indirect Routes for a Jamaica Plain - Dorchester Trip 13
Table 2.4 Distribution of Different Modes of Transportation Used 15
Table 2.5 Percentage of 1990 Land Use in Each City (%) 17
Table 3.1 Assigning Weights to Roads by Road Type 25
Table 3.2 Change in Residence-Work Trip Distance 27
Table 3.3 Assigning Zero Values to Distance Saved for Peripheral Trips 29
Table 4.1 Relative Effective Savings in Travel Distance (Wes(i)) and Corresponding
Ranking for Each Neighborhood i,
Assuming All O-D Pairs are Impacted by the Urban Ring
Using CTPP Ridership Data 40
Table 4.2 Percentage of Commuters who Leave their Neighborhoods
(where origin and destination neighborhoods are different) 45
Table 4.3 General Relationship between Relative Effective Savings (Wesij),
Proximity to the Urban Ring, and Relative Employment Share (Wemp(ij) 47
Table 4.4 Share of Suffolk County's Transit Riders in the Neighborhood (Wpcbli())
and their Corresponding Relative Savings in Commute Time (Wes(i)),
Computed with CTPP Ridership Data 52
Table 4.5 Passenger-miles Savings to an Average Commuter in Neighborhood i and
Corresponding Ranking for Each Neighborhood i,
Using CTPP Ridership Data 54
Table 4.6 Comparing Relative Effective Savings in Travel Distance (Wes(ij)) at
Neighborhood Level,
Zero Values Assigned vs. Not Assigned to Peripheral Trips,
Using CTPP Ridership Data 56
Table 4.7 Comparing Passenger-miles Savings to an Average Commuter in the
Neighborhood,
Zero Values Assigned vs. Not Assigned to Peripheral Trips
Using CTPP Ridership Data 57
Table 4.8 Fraction of Effective Savings in Travel Distance (weighted by Road Type)
(Wes(ij)), using Ridership Data estimated with Census Residential and
CTPS Job Location Data 61
Table 5.1 Comparing Neighborhood's Fraction of "Distance" Saved (Wes(ij)), using
the Two Sets of Ridership Data 71
Table 5.2 Difference between Wes(i) Computed with Estimated Ridership based on
Census Data and Wes(i) computed with CTPP Ridership Data 73
The Case of Longwood Medical and Academic Area Box 1
CHAPTER
1
INTRODUCTION
1.1 RESEARCH OBJECTIVE
In this thesis, I develop a model to examine the current and anticipated commuting patterns caused by a transportation infrastructure project, and the relationship between changes in commuting patterns and economic impacts. The focus of the analysis is short-term distributional effects of travel time savings; long-term shifts in commuting and land use patterns are not modeled. Geographic Information Systems (GIS) and readily available data on commuting patterns, residence characteristics, and employment location are used. The proposed Urban Ring Project is used as the case of analysis.
1.2 CURRENT METHODS TO STUDY TRAVEL TIME SAVINGS AND ECONOMIC IMPACTS OF TRANSPORTATION INFRASTRUCTURE PROJECTS
Most transportation infrastructure projects are designed to stimulate economic growth and development. Although many methods have been developed to study the potential economic impacts, "economic impacts" are mostly analyzed by Cost-Benefit Analysis method (Banister and Berechman, 2000; Eberts, 2000), and the scales of analysis for most studies conducted are at regional level (Weisbrod, 2000). Few studies are oriented towards the distribution of economic
impacts because appropriate model and data for studies of such kind are unavailable. Data needed for useful studies should describe transportation system characteristics, employment, firm-level
characteristics, transportation financial information, commodity flows, and accompanying characteristics of the region (Eberts, 2000), and the model should deal with the spatial
characteristics of the area. However, in most cases, such data either do not exist at all or are not available in user-friendly formats.
1.3 RESEARCH BACKGROUND
As shown in Map 1 in Appendix B, the Urban Ring Project is a 15-mile long inner loop that connects the airport to other inner city employment centers, using a combination of
transportation system management (TSM), bus rapid transit (BRT) system, and light rail / rapid transit. 1 The project is selected to be the case study in this thesis for two main reasons. The primary motivation is that advocates of the Urban Ring argue that many commuters in Boston
and the surrounding area are spending a large amount of time making transfers. This is
particularly true for the transit dependent poor on the south of the proposed Urban Ring. Upon the completion of the Urban Ring Project, traveling between non-Central Business District areas can be more direct, and travel time can be reduced (Conservation Law Foundation, 2001). However, the degree to which commuters will have their commuting improved depends on where they live and which transportation mode they use. There has been no study so far on how the Urban Ring Project can save travel time of commuters of different modes of transportation in each area.
The secondary motivation is that the Boston Redevelopment Authority (BRA) is currently exploring the potential of using an economic model developed by the Regional
Economic Modeling, Inc. (REMI) to forecast economic impacts of several infrastructure projects in Boston, one of those being the Urban Ring Project. However, the smallest geographic unit of
1 Details of the Urban Ring Project are described in Section 2.7.
PAGE 2
forecasts generated by the REMI model is Suffolk County. Economic impact analyses for any geographic units smaller than Suffolk County are not available. It is still uncertain whether or not
the REMI model is the best economic model for forecasting economic impacts generated by the
Urban Ring. The Urban Ring involves more than one jurisdiction,2 and spillover effects are large;
moreover, the Urban Ring and REMI's forecasts focus on different geographic scales. If a model is developed to forecast the spatial distribution of benefits (such as reduction in travel time) by geographical units smaller than the county level, then certain relevant economic impact forecasts generated by the REMI model or other economic models can be analyzed spatially. Therefore, the Urban Ring Project is a good case for many research topics.
Because of its many interesting characteristics, I use the proposed Urban Ring Project as the case to model spatial distribution of travel time savings, and will comment on how travel time
savings distribution can be translated into labor productivity change distribution.
1.4 RESEARCH SPECIFICS AND DATA
The focus of spatial impacts from the Urban Ring Project is short term. Land use and commuting pattern do not change within the time frame of this study. Although some changes in land use and residence-work commuting patterns are expected in a longer term, it is beyond the scope of this study to also account for the possible long term shifts.
I assume that the distribution of certain economic impacts depend upon the distribution of
travel time savings. Travel time savings can be approximated by travel distance savings with some adjustments for average speeds, and the distance can be calculated with Geographic
2 The Urban Ring is designed to loop through Chelsea, Everett, Somerville, Cambridge, Brookline, and
seven neighborhoods in Boston.
PAGE 3 CHAPTER 1 INTRODUCTION
Information Systems (GIS) skills, using appropriate geographic data. Total travel distance savings in a neighborhood can then be computed with O-D distribution data.
The best source of ridership data is the Census Transportation Planning Package (CTPP). The CTPP data are a set of transportation data tabulated by number of trips made for each origin-destination (O-D) pair based on 1990 Census data, and is produced by the U.S. Department of Transportation. The number of trips for each O-D pair at the census tract level is available from
the CTPP data. However, it is very time and skill demanding to extract the CTPP ridership data into useable formats. Analysts would be interested in using simpler methods and other data sets that can estimate ridership if the estimates are close enough to the CTPP ridership. Therefore, a
second set of data from two sources - the 1990 Census data containing residential characteristics
and the 1990 job location data from Central Transportation Planning Staff (CTPS) - are used.
Both Census residential data and CTPS job location data are available in relatively user-friendly formats.
Two scenarios are built based on different assumptions. In Scenario A, all commuters are assumed to benefit (in terms of travel time savings) from the Project, regardless of transportation
mode used. This can happen in two possible cases: (1) all private vehicle commuters shift to transit; or (2) there is a large enough number of private vehicle riders shifting to transit, such that traffic on the road is sufficiently reduced, which in turn reduces travel time of the rest of private vehicle riders who do not shift their mode of transportation. In reality, the Urban Ring is targeted at improving commuting of transit riders, and it will save at most only a limited amount of time for private vehicle riders. Therefore, total travel time savings is overestimated when it is computed under the assumption that all commuters benefit from the Project. Nonetheless, travel time savings computed in this scenario is the maximal possible savings. In Scenario B, only transit riders are assumed to benefit from the Project because the Urban Ring will make residence
PAGE 4
- work journey routes more direct. This set of estimations is computed based on the current commuting behavior, assuming that no commuters shift transportation modes. However, some private vehicle riders will find the Urban Ring very convenient, and they will shift to ride transit
instead. As a result, on top of the current transit riders, there are other commuters who also have travel time saved. Therefore, the overall impacts estimated under Scenario B will tend to be underestimated.
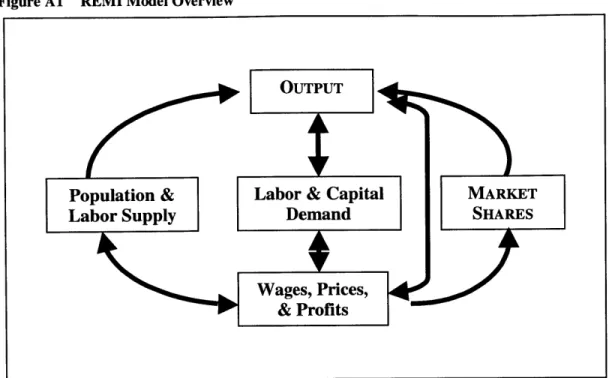
The distribution of travel time savings can then be used to forecast distribution of selected economic impacts. There are several economic models available that forecast economic impacts at the county level or higher; in this thesis, the REMI model is used. I will discuss whether or not the REMI model is appropriate to forecast economic impacts of the Urban Ring.
My discussion is based on the way the REMI model deals with reduction in travel time caused by
a transportation infrastructure project.
1.5 THESIS STRUCTURE
In Chapter 2, I briefly present the current spatial pattern in Greater Boston, and the economic benefits that can be expected from the Urban Ring based on such situations. In Chapter 3, I explain the model that I have developed for forecasting distribution of distance
savings in residential - work trips. In Chapter 4, I present and discuss the results computed with
the two sets of ridership data. The results are compared in Chapter 5. Chapter 6 is a discussion
on the limitations of my model and the REMI model, and Chapter 7 is the conclusion. I integrate the distribution of travel time savings with the REMI model in Appendix A.
PAGE 5 CHAPTER I INTRODUCTION
CHAPTER
2
CURRENT SPATIAL PATTERN IN METROPOLITAN BOSTON
The main objective of this thesis is to forecast the distribution of benefits, in terms of travel time saved, caused by the Urban Ring Project. From the travel time savings distribution,
the different impacts on all commuters or transit riders in each neighborhood can be analyzed. However, it is difficult to imagine the possible impacts without understanding the current spatial pattern in the region. Therefore, in this chapter, the spatial pattern of population, commuting behavior, economic activities, public transportation services, and land use are studied.
The focus of the study is on the 16 Boston neighborhoods and the other three Suffolk County cities (Chelsea, Revere, and Winthrop). However, four other "Urban Ring cities" (Brookline, Cambridge, Everett, and Somerville) are also studied because of their proximities to the Urban Ring structure. A map showing the locations of neighborhoods and cities being studied can be found in Map 1: Boston Neighborhoods and the Proposed Urban Ring, and a list of the neighborhoods and the cities can be found in Appendix B-2.
2.1 POPULATION DENSITY AND OTHER DEMOGRAPHIC CHARACTERISTICS
Map 2 and Map 3 shows the population densities and residential employment densities 3
in Suffolk County and part of the metropolitan area, respectively. From Map 2, Map 3, and Table
Beacon Hill, South End, and Fenway / Kenmore, have very high population densities. Population sizes are large in Allston / Brighton, Roxbury, and Jamaica Plain; these neighborhoods are to the
south or to the west of the Central Business District (CBD), but are not very far away from it. 4
However, from Map 2, one can observe that population densities in Roxbury and Jamaica Plain are not uniformly distributed; they are much higher in areas that are closer to the CBD. To the east of the CBD, population sizes in East Boston, South Boston, and Chelsea are similar. However, because large tracks of land in the former two neighborhoods are not zoned for residential use, 5 the overall population densities in East Boston and South Boston are lower than that in Chelsea. In the more remote neighborhoods, such as West Roxbury, Hyde Park,
Roslindale, and Winthrop, population sizes are smaller, and population densities are lower. Relatively fewer people prefer to reside in these remote neighborhoods as compared to those closer to the CBD, possibly due to the less well provided public transportation and other services in the area as well as historical zoning pattern. This will be discussed later in this chapter.
Population sizes and densities also vary in cities outside Suffolk County. Both Cambridge and Somerville have very large population sizes and high population densities. Brookline also has a rather large population size, but the city's population density is low because it has a large land area. However, population density distribution in the city is not uniform; most of the people reside in the T-accessible areas. In Everett, population size is small and population density is low when compared with other "Urban Ring cities".
3
Residential employment density is defined as the number of employed residents who are age 16 and over and do not work at home living in a unit area of land.4 The centers of Allston / Brighton, Roxbury, and Jamaica Plain are within 10 miles from the CBD. s The Logan International Airport is located in East Boston, and the piers are located in South Boston.
TABLE 2.1 POPULATION SIZES AND DENSITIES OF EACH SUFFOLK COUNTY
NEIGHBORHOOD AND NEIGHBORING CITIES
Population Fraction of Land Area Population
Neighborhood / Cities Population Density
(persons) (%) (acre) (persons per
acre)
East Boston 34,156 3.7 2,957 11.6
Charlestown 16,974 1.8 812 20.9
outh Boston 31,825 3.4 1,983 16.1
Central 21,666 2.3 884 24.5
Back Bay I Beacon Hill 24,666 2.6 581 42.4
South End 32,888 3.5 831 39.6 Fenway / Kenmore 33,526 3.6 801 41.9 Allston / Brighton 70,284 7.5 2,955 23.8 Jamaica Plain 41,448 4.4 2,073 20.0 Roxbury 57,532 6.2 2,857 20.1 North Dorchester 26,425 2.8 1,243 21.3 South Dorchester 59,727 6.4 2,540 23.5 Mattapan 35,895 3.8 1,564 22.9 Roslindale 30,298 3.2 1,951 15.5 West Roxbury 29,716 3.2 3,501 8.5 Hyde Park 32,621 3.5 3,155 10.3 Chelsea 28,710 3.1 1,401 20.5 Revere 43,344 4.6 3,865 11.2 Winthrop 18,904 2.0 1,329 14.2 Brookline 54,718 5.9 4,365 12.5 Cambridge 95,802 10.3 4,562 21.0 Everett 35,701 3.8 2,333 15.3 Somerville 76,210 8.2 2,696 28.3 otal 933,036 100.0 Sources:
-Population data from 1990 Census.
-Neighborhood and city border from Boston Redevelopment Authority (BRA) and 1990 TIGER files from
US Bureau of the Census.
-Land area calculated by ArcView, based on 1990 TIGER files.
-The 16 Boston neighborhoods are listed on the top of the list, in the order according to the neighborhood's proximity to the CBD.
The rest of the Suffolk County cities are listed after the Boston neighborhoods, followed by the other "Urban Ring cities".
Besides population density distribution, household income distribution is another demographic characteristic worth looking at. From Map 4: Median Household Income, if the focus of analysis is within 10 miles of the CBD, one can observe that the median household income distribution is doughnut-shaped. This means that within 10 miles of the CBD, the median household incomes are high in the CBD, much lower in the areas right next to the CBD, and then
higher further away in the suburb areas. From Map 4, median household incomes are the lowest in places that are in between the CBD and the suburbs, such as the large, low-income area in Roxbury. Besides, most blockgroups in North Dorchester, South End, and South Boston have below-average median household incomes. Areas in the CBD, such as Back Bay / Beacon Hill, and areas closer to the suburbs, such as Brookline, Allston / Brighton and the western part of Cambridge have higher median household incomes.
2.2 ECONOMIC ACTIVITIES
Despite the fact that there was some sprawling of businesses to the outer belt of the region during the last few decades, the Central Business District (CBD) in the City of Boston is still the major cluster of most economic activities today. In 1990, 25 per cent of all private business employment in the Consolidated Metropolitan Statistical Area (CMSA) is in Boston,
while only 14 per cent of the CMSA's population lives in the city. 6 As shown in Map 5: Job
Density and Other Major Economic Activity Centers, Central is leading other Suffolk County
neighborhoods in job density, while at the same time, a large number of employments are also found in other CBD neighborhoods, such as Fenway / Kenmore, South End, South Boston, Charlestown, and the part of Allston / Brighton that is attached to Fenway / Kenmore. Beyond the boundary of the City of Boston, job densities are also relatively high in Cambridge, Longwood Medical Area in Brookline, and the southern part of Somerville, when compared with the rest of the CMSA region. Most other economic active centers, such as movie theatres and play theatres, sports stadiums, large shopping centers, and major hospitals, are also found in the above areas. Therefore, there is a high demand for commuting to these places. Map 6 shows the distribution of
employment-to-labor force ratio at the neighborhood level. If the employment-to-labor force ratio is large, there are more jobs than residents in the neighborhood. Therefore, many workers are expected to commute into the neighborhood. Examples of neighborhoods with large employment-to-labor force ratios are Central, Cambridge, South Boston, Back Bay / Beacon Hill, and Fenway
/ Kenmore. If the employment-to-labor force ratios are small, there are more residents than jobs
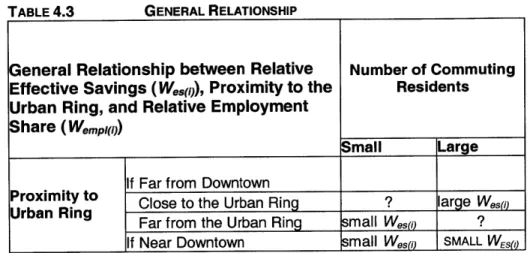
in the neighborhood. Many workers are expected to commute to other neighborhoods to work. Examples of such neighborhoods include Roslindale, Mattapan, South Dorchester, and Winthrop. The following diagram explains the relationship between employment-to-labor force ratio and direction of residence-to-work commuting.
Dominant direction of Residence-to-Work Commuting
Neighborhood i Neighborhood j
Low employment-to- High
employment-to-labor force ratio. Fewer labor force ratio. More
jobs than residents.
jobs
than residents.In fact, one out of every eight trips made on the T (Boston's rapid transit system) starts and / or ends in the Urban Ring corridor (Conservation Law Foundation, 2001). However, due to
the radial nature of the transit network, most transit riders need to route the residence - work trips
through the downtown, although it is not the most direct and fastest way to travel to their destinations.
6 Economic data from Bluestone and Stevenson as calculated with Commonwealth of Massachusetts data;
city population data from Commonwealth of Massachusetts homepage; MSA population data from Census Bureau homepage.
However, when Map 2: Population Density, Map 3: Residential Employment Density, and Map 5: Job Density and Other Economic Activity Centers are compared, one can observe that population densities are more uniformly distributed than job densities. In other words, the
population gradient is lower than the job gradient. This is another indication that a lot of people who live in places outside the CBD need to commute to the area for work, shopping, or other
economic activities. When the map of job locations and economic activity centers (Map 5) and the maps of population and residential employment densities (Map 2 and Map 3) are overlaid, one can observe that many economically active centers and some high population density areas do not coincide. Using Roxbury as an example, there are no cinemas / theatres, large shopping centers, and large employers in the community. It is therefore safe to conclude that most of the Roxbury residents need to commute to other regions to work or for leisure activities. Applying the same reasoning, it can be seen that there is a high demand of commuting from the non-CBD
neighborhoods to the CBD.
At this point, it is important to note that businesses and jobs are in fact gradually spreading out to places outside Boston. Between 1972 and 1990, Boston's share of employment in the Consolidated Metropolitan Statistical Area (CMSA) has dropped. The changes in several sectors are highlighted in the following table:
TABLE 2.2 BOSTON AS PERCENTAGE OF CMSA, PRIVATE-SECTOR EMPLOYMENT,
1972 AND 1990
1972 1990
Total Private 31.5 24.5
Manufacturing 15.8 9.2
Trade 29.2 15.9
Finance, Insurance, and Real Estate (FIRE) 66.5 47.4
Services 38.9 32.4
Source: Bluestone and Stevenson (2000),
calculated from 1999 Commonwealth of Massachusetts data.
PAGE 11 CHAPTER 2 SPATIAL PATTERN
A large number of new employment and many new establishments are found in places
outside the city of Boston. For example, in the high technology industry, employment along Route 128 has increased from 61,000 in the late 1960's to more than 140,000 in 1992, and the number of establishments has increased from 268 to 2,514 for the same time period (Saxenian,
1996). If the trend of sprawl is to continue in the next few decades, more and more jobs and
establishments will be found outside the City of Boston. In other words, the demand of commuting to the non-CBD areas is increasing, given that the trend is expected to continue.
2.3 RADIAL TRANSIT SYSTEM
The mass transit system of Boston is characterized by its radial nature, heading into the city from the surrounding suburbs. This means that trips with origins or destinations in the CBD are easy to make, but circumferential travel is slow and difficult. If one travels within, to, and / or from the Urban Ring corridor, transfers are often needed, making the trips time-consuming and inconvenient (MBTA Newsletter, Winter 2000/2001).
Some densely populated areas, such as certain places in Roxbury, Jamaica Plain, South Boston, and Somerville, etc., are not well served by the transit, or are served by a transit line that does not go to other areas except downtown Boston. This is best illustrated by a trip made from Jamaica Plain to North Dorchester. For example, if a person wants to ride the rapid transit (the
"T") from Jamaica Plain to North Dorchester, then he/she must take the Orange Line to
Downtown Crossing Station first, and make a transfer there to the Red Line. ArcView's Network Analyst tool can draw the person's route and calculate the trip distance. Assume the origin is 330 Lamartine Street, Jamaica Plain, an address near Green Street Station along the Orange Line (Point A), and the destination is 50 Playstead Road, North Dorchester (Point B).
PAGE 12
CHAPTER 2 SPATIAL PATTERN PAGE 13
The direct road distance between the two locations are just 3.68 miles apart, which is represented by the zigzag line from A to B. However, if the commuter decides to ride the rapid transit, the new route would be from A (point of origin in Jamaica Plain) to C (Downtown Crossing Station), then from C to B (point of destination in North Dorchester). An additional 4 miles are needed:
TABLE 2.3 DIRECT VS. INDIRECT ROUTES FOR A JAMAICA PLAIN - DORCHESTER TRIP
ROAD ROAD
FROM
To
DISTANCE DISTANCE(meters)
(miles)
ROUTE
1:
DIRECT TRIP300 Lamartime St,
50 Playstead Rd, North
5,915
3.68
Jamaica Plain
Dorchester
ROUTE 2: TRANSFER AT 300 Lamartime St, 400 Washington St,
DOWNTOWN CROSSING Jamaica Plain Boston (Downtown 6,745 4.19
Crossing T)
400 Washington St,
50 Playstead Rd, North
Boston (Downtown
Dorchester
5,610
3.49
Crossing T)
Total
12,355
7.68
[Additional
6,440
4.00
Sources: ArcView Network Analyst, 1990 Census TIGER file
Although there are buses that provide more direct services in areas which are less well served by the rapid transit (see example above), buses generally have a lower speed, are less reliable, have lower capacities, have higher operation costs than rapid transit (Vuchic, 1992), and involve relatively inconvenient transfers.
In Map 7: Commute Time to Work, the average commute time to work for residents in the CBD area in Boston and Cambridge is short, mainly because of the short distance between places of residence and places of work for residents in these two areas. However, for residents in the southern part of Boston, such as Roxbury, South Dorchester, Mattapan, Roslindale, and Hyde Park, the average commute time to work is much longer. This is probably because of two reasons. First, many commuters living in these areas are riding the transit to work, and their work places are not directly connected by the transit. Several transfers are often needed. Second, few job
opportunities exist in these areas, and most workers have to commute far to work. For commuters living further away in the suburbs, the average commute time to work is slightly shorter. This is probably because most of these commuters drive to work, and as long as there is no heavy traffic,
they should not experience horrendous traveling.
2.4 DOMINANT MODE OF TRANSPORTATION
Commuters in Boston are rather transit-dependent. From Map 8: Percentage of Public
Transportation Commuters, the proportion of commuters in Boston and other Urban Ring cities
(Brookline, Cambridge, Everett, and Somerville) riding the transit is higher than that in the suburbs further away from the CBD. Many blockgroups have at least 30 per cent of their commuters riding transit. Even in some places where commuters are not reached by the rapid transit system, such as Roxbury, Somerville, Mattapan, and Hyde Park, the percentage of
PAGE 14
commuters riding transit is still high. Table 2.4 also shows the distribution of different modes of transportation used by commuters in the neighborhoods.
T ABLE 2.4 DISTRIBUTION OF DIFFERENT MODES OF TRANSPORTATION USED
Note:
"Transit" includes "Bus of Trolley Bus", "Streetcar or Trolley Car", "Subway or Elevated", "Railroad", and "Ferryboat".
"Private" includes "Drive Alone" and "Carpooling".
"Others" includes "Taxicab", "Motorcycle", "Bicycle", "Walked", and "Other Means". The 16 Boston neighborhoods are listed on the top of the list, in the order according to the
neighborhood's proximity to the CBD. The rest of the Suffolk County cities are listed after the Boston neighborhoods, followed by the other "Urban Ring cities".
Source: Census Transportation Planning Package, 1990.
Several reasons can explain the transit dependency in Suffolk County. First, high population densities in most places in the County, in particular the neighborhoods near the CBD,
PAGE 15 CHAPTER 2 SPATIAL PATTERN
PERCENTAGE OF COMMUTERS USING EACH MODE OF TRANSPORTATION (%)
PRIVATE ALL
NEIGHBORHOOD / CITY TRANSIT VEHICLES OTHERS COMMUTERS
EAST BOSTON 40.0 51.1 8.9 100.0
CHARLESTOWN 31.9 50.8 17.3 100.0
OUTH BOSTON 32.6 53.6 13.8 100.0
CENTRAL 23.8 23.5 52.6 100.0
BACK BAY/BEACON HILL 25.0 26.0 49.0 100.0
SOUTH END 33.9 35.1 31.0 100.0 FENWAY/KENMORE 34.2 16.7 49.1 100.0 ALLSTON/BRIGHTON 40.1 49.1 10.8 100.0 JAMAICA PLAIN 36.5 50.0 13.5 100.0 ROXBURY 38.2 54.7 7.2 100.0 NORTH DORCHESTER 33.0 58.4 8.7 100.0 SOUTH DORCHESTER 30.0 64.8 5.2 100.0 MATTAPAN 32.4 64.4 3.2 100.0 ROSLINDALE 28.7 68.0 3.3 100.0 WEST ROXBURY 16.4 80.4 3.2 100.0 HYDE PARK 22.2 72.9 4.9 100.0 CHELSEA 23.3 65.1 11.6 100.0 REVERE 21.1 73.9 5.0 100.0 WINTHROP 24.9 68.7 6.4 100.0 BROOKLINE 29.1 56.3 14.5 100.0 CAMBRIDGE 24.5 46.4 29.2 100.0 EVERETT 17.6 76.0 6.4 100.0 OMERVILLE 28.1 58.3 13.7 100.0 verage 29.3 54.4 16.3 100.0
Roxbury, Jamaica Plain, and Cambridge, imply that demand, and hence prices, for land in those neighborhoods are high. Consequently, it is expensive and difficult to find a parking space. Second, as shown in Map 4: Median Household Income, the median household incomes in some neighborhoods, such as Roxbury and South Boston, are below average. Many of these low-income families find car-ownership unaffordable. The two effects have led to a high demand for transit, despite the fact that the public transportation services in the area receive much criticism.
2.5 LAND USE
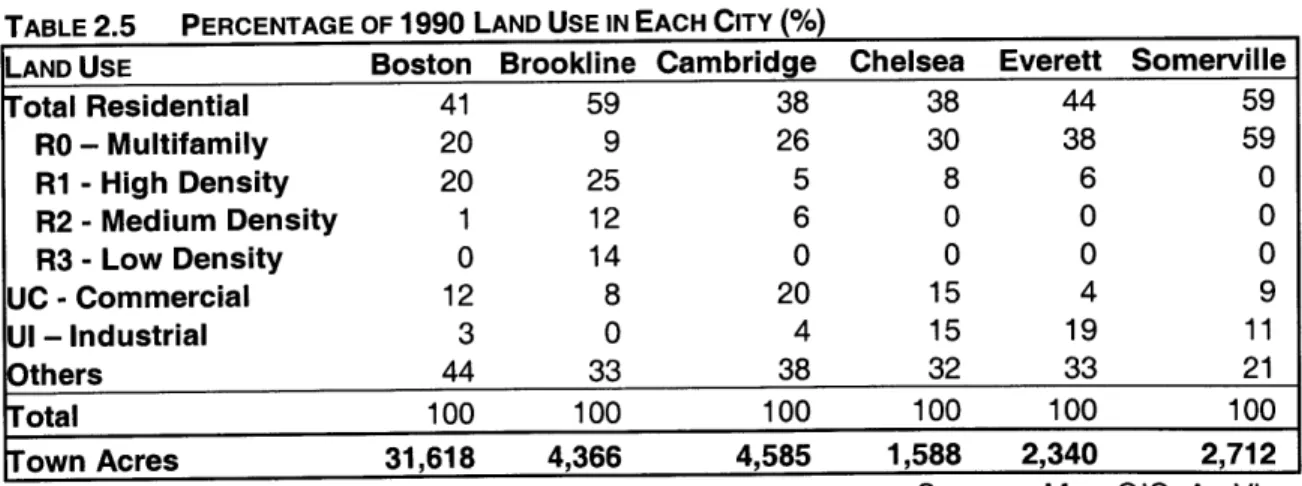
The last characteristic to study is land use. Through land use distribution, commuting pattern and development potential of land can be examined. In Map 9, a 1990 land use map of
Suffolk County and neighboring cities is shown. Although all cities dedicate most of their land areas to residential purposes, the proportions and distributions differ. In Boston, most of the multi-family residential land is found in South Dorchester, North Dorchester, Roxbury, Jamaica Plain, Mattapan, South End, and Allston / Brighton. High density residential areas are mostly found in Hyde Park, West Roxbury, Roslindale, and Allston / Brighton. Medium and low density residential lands can rarely be found in Boston. Both Brookline and Somerville are highly
residential -with close to 60 per cent of their total land areas as residential use. However, Somerville has a much higher residential density than Brookline. Almost all residential areas in Somerville are multi-family residential, while most of Brookline's residential land areas zoned for high density, medium density, and low density. Residential zones in Chelsea and Everett are dominated by multi-family residential type. High travel demand is expected to originate from these highly populated areas.
PAGE 16 CHAPTER 2 SPATIAL PATTERN
In Boston and Cambridge, commercial use is the next largest land use category after residential. Most of the commercial areas in Boston cluster in downtown, with the rest scattered along the major roads in the city; commercial areas in Cambridge are mainly found along Massachusetts Avenue, Harvard Square, Porter Square, and Kendall Square. High demand in
commuting to these commercial and residential areas are expected. Large pieces of industrial land can also be found in Everett and Chelsea. While Everett is highly industrial with 20 per cent of its land areas dedicated to the use, Chelsea has a very mix-used landscape with 15 per cent of land areas dedicate to both commercial and industrial uses. Therefore, it is also expected that many trips will have destinations in these two neighborhoods.
Large pieces of open land can be found in Roxbury, Jamaica Plain, Roslindale, Mattapan, Hyde Park, West Roxbury, Brookline, and Winthrop. Many of these open land patches are parks (for example, Franklin Park), hills (for example, Stony Brook), wetlands, and the like. They are generally not developable.
TABLE 2.5 PERCENTAGE OF 1990 LAND USE IN EACH CITY (%)
LAND USE Boston Brookline Cambridge Chelsea Everett Somerville
Total Residential 41 59 38 38 44 59 RO - Multifamily 20 9 26 30 38 59 R1 - High Density 20 25 5 8 6 0 R2 - Medium Density 1 12 6 0 0 0 R3 - Low Density 0 14 0 0 0 0 UC - Commercial 12 8 20 15 4 9 UI - Industrial 3 0 4 15 19 11 Others 44 33 38 32 33 21 Total 100 100 100 100 100 100 Town Acres 31,618 4,366 4,585 1,588 2,340 2,712
Sources: MassGIS, ArcView
PAGE 17 CHAPTER 2 SPATIAL PATTERN
2.6 DISADVANTAGEOUS NEIGHBORHOODS
After studying the population density, job location, commuting behavior, medium household income, land use pattern, and public transportation services provision in the region, several neighborhoods can be identified as being in a disadvantageous position. For example, Roxbury has a relatively high population density (Map 2 and Table 2.1), and medium household
income in the neighborhood is below average (Map 4). Residents in these neighborhoods are rather transit-dependent (Map 8) partly because low-income families find automobiles
unaffordable. Although job opportunities exist in the area, many residents still want to work outside the neighborhood because there are more opportunities in the CBD and other areas such as the Longwood Medical Area. However, Roxbury is not directly reached by the rapid transit. Therefore, transit riders can either ride the bus or transfer from a bus to the rapid transit in order to get to the CBD. If they go to areas other than the CBD, then they have to depend on the buses that provide direct services but are slower and less reliable, or make transfers with the rapid transit, which is extremely inconvenient and has travel time delayed by the transfers. However, many commuters experience the inconvenient traveling since they are transit-dependent. In fact, the average travel time for Roxbury residents is high (Map 7) compared with residents in nearby places. It is expected that traveling of Roxbury commuters can be improved by a better designed
and operated transportation system.
2.7 THE URBAN RING
The Urban Ring Project is designed to connect the radial transit lines and bus routes. It is intended to help make the entire regional transportation system more efficient and reduce trip times and the need to make transfers for transit riders. It is a 15-mile long circumferential corridor
PAGE 18 CHAPTER 2 SPATIAL PATTERN
that loops through Chelsea, Everett, Somerville, Cambridge, Brookline, and Boston. In the most recent Major Investment Study (MIS), the implementation of the Project consists of three phases. The first phase is characterized by a bus optimization (Transportation System Management, or TSM) element. It aims at optimizing existing conventional bus service in the Project corridor, and
is expected to last for 5 years. The second phase is characterized by the bus rapid transit (BRT)
system and supporting elements, which include the construction of grade-separated rights of way to reduce congestion, modification of surface streets, and purchase of equipments. It is expected to occur within 10 years of MIS completion. In the third phase of the Project, either light rail or
rail rapid transit will be added in the most heavily traveled section of the corridor between Assembly Square in Somerville and Dudley Square in Boston. It is expected to occur within 15 years of MIS completion (MBTA Newsletter, Winter 2000/2001).
Therefore, upon the completion of the Urban Ring Project, transit riders who must now travel to downtown and make transfers to get to their destinations would be able to travel in a more direct route and thus save travel time. It will be particularly welcomed by the poor and working-class city residents, who often must rely on the transit to work, shop, and get healthcare. Moreover, there is potential for new housing, jobs, and businesses to cluster along the new transit stations, thus triggering local economic development (Conservation Law Foundation, 2001).
One primary concern to planners and analysts is the spatial distribution of the various possible benefits brought by the Urban Ring. However, there has not been any quantitative study
on the analysis of such distribution. In this thesis, a model that forecasts the distribution of savings in travel time to residents at the neighborhood level is developed. Methodologies, results, and discussions are found in the next few chapters.
PAGE 19 CHAPTER 2 SPATIAL PATTERN
CHAPTER
3
METHODOLOGY
3.1 INTRODUCTION
In this chapter, I will explain the methodology I have developed to study the distribution of residence-work trip time savings as a result of the Urban Ring Project.
3.2 GEOGRAPHIC UNIT OF ANALYSIS
Geographical scale of analysis in Boston is the 16 neighborhoods.7 The harbor islands are
be excluded because (1) the Urban Ring can hardly affect residents in those islands; and (2) only a few people reside on those islands, and only a few jobs exist there. Any trip to / from the island will not yield significant effects on our analysis.
Geographical scale of analysis outside Boston will be the cities in Suffolk County
-Chelsea, Revere, and Winthrop. For simplicity, when I refer to the term "neighborhoods" in the rest of this paper, these three Suffolk County cities are also included.
I focus on analyzing the spatial distribution of travel time savings solely in Suffolk
County because the REMI version I use only generates forecasts for Suffolk County and the
neighboring four counties.8 As an exploratory study to forecast travel time savings distribution,
and to ingrate travel time savings distribution with economic impacts, I will focus on the forecasts for a smaller region in this thesis. However, because of the proximity of other "Urban
Ring Cities" (cities that the Urban Ring loops through: Brookline, Cambridge, Everett, and Somerville) to Suffolk County and heavy commuting made by Suffolk County residents to these cities, commuting to the Urban Ring Cities are also included in the calculation.
3.3 FACTORS CONTRIBUTING TO SPATIAL DISTRIBUTION OF SAVINGS IN TRAVEL TIME
Ideally, to assess the impacts of the Urban Ring in terms of reduction in travel time,
travel time savings for each origin - destination (O-D) pair should be analyzed. However, such
data is not readily available. It will be much easier to estimate travel time based on travel distance of each O-D pair. Since travel distance and travel time are positively and highly correlated, I will use decrease in travel distance to approximate savings in travel time.
There are two main factors that directly affect the savings in travel time to a neighborhood. These two factors are:
1. Effective Trip Distance Savings
a. Residence - work travel distance reduction (for base case)
b. Intensity of use (ridership) of each residence - work trip (for base case)
2. Percentage of public transportation commuters in each neighborhood (for scenarios)
Both components are essential. For instance, if no commuters are making use of a given trip, impacts generated will be negligible even though reduction in the corresponding residence-work trip is significant. Effective trip distance savings will be small in this case. Similarly, if a given trip is intensely used, the aggregated impacts can be huge in spite of its small savings in travel distance. Effective trip distance savings in this case will be large. Ridership data are
8 The neighboring four counties are: Essex, Middlesex, Norfolk, and Plymouth.
PAGE 21
available from the O-D trip distribution, or can be estimated from the number of employed residents and the number of jobs in each neighborhood. I will elaborate on this reasoning later.
Since it is believed that commuters using each transportation mode will benefit from the Project in different ways, two scenarios are developed to account for the differences. The percentage of public transportation commuters will be the primary difference between the two scenarios. In Scenario A, it is assumed that all commuters will benefit from the Project, regardless of their modes of transportation; in Scenario B, it is assumed that only transit riders will benefit from the Project.
3.3.1 GENERAL ASSUMPTIONS
I assume the Urban Ring Project will start being implemented in 2002, two years after the
scheduled release of the Major Investment Study (MIS) Report. If there is no delay in project implementation, it is scheduled that most capital costs should have been invested in 2016, fifteen years after it begins.
In this model, I assume that there is no major change in land use pattern between 1990 9 and 2016. By this assumption, it follows that there is no major population and business relocation and no major change in commuting pattern (in terms of trip origins and destinations, mode of transportation, and ridership).
9 Most of the data I use were collected in 1990.
PAGE 22 CHAPTER 3 MET HODOLOGY
3.3.2 RESIDENCE - WORK TRAVEL TIME SAVINGS
Ideally, I should use travel time savings to each area as the measure for the analysis. However, in the absence of such data, I use the change in travel distances weighted by road type as an approximation to change in travel time. In calculating the decrease in residence-work trip distances, I will only focus on those commuters who reside in Suffolk County.
3.3.2.1 ORIGIN AND DESTINATION
I will use the neighborhoods as defined by the Boston Redevelopment Authority (BRA) both as place of residence and place of work. However, in order to present the methodology more clearly, I will use "Neighborhood" and "Work Zone" respectively to represent places of residence and places of work, although they are in fact the same polygons. There are 19 residential
neighborhoods in Suffolk County. Neighborhoods 1 to 16 correspond to the 16 Boston
neighborhoods; neighborhoods 17 to 19 correspond to the non-Boston cities in Suffolk County
(Chelsea, Revere, and Winthrop). Only residence - work trips with origins in Suffolk County are
analyzed because I am interested in the Urban Ring's impacts on Suffolk County residents. However, a number of Suffolk County residents work in places outside the County. Therefore, the number of work zones analyzed is larger than the number of residential neighborhoods. There
are 24 work zones. Work zones 1 to 19 correspond to neighborhood 1 to 19, work zones 20 to 23 correspond to the non-Suffolk cities that intersect with the Urban Ring (Brookline, Cambridge, Everett, and Somerville); work zone 99 corresponds to "other" work zones. Travel distance with destinations in the "Urban Ring Cities" 10 calculated separately, because savings in travel distance to / from these "Urban Ring Cities" are expected to be large. Map 1 shows the locations of
PAGE 23 CHAPTER 3 METHODOLOGY
neighborhoods and work zones, and a list of neighborhoods and work zones can be found in Appendix B-2 for easier reference.
The underlying assumption in using neighborhoods as places of origin and destination is that all commuters of an O-D pair begin their trips at the same point in the origin neighborhood, and end their trips at the same points in the destination neighborhood. In this thesis, the label points, which are also known as the label points, are used to represent the location in the neighborhood where trips begin and end. However, the label points may not be the most representative points of the neighborhoods, and the non-representativeness of label points may affect the trip distances computed based on these points. More discussion on this issue can be found in Chapter 8.
3.3.2.2 TRIP DISTANCE ESTIMATION
I then calculate the road distance of each residence-work trip, both before and after the
Urban Ring Project. This is done by ArcView's Network Analyst Extension function on the road layer prepared by Environmental Systems Research Institute, Inc. (ESRI) in 1998. Avenue Programming is also used to repeat the calculations for all possible O-D combinations of
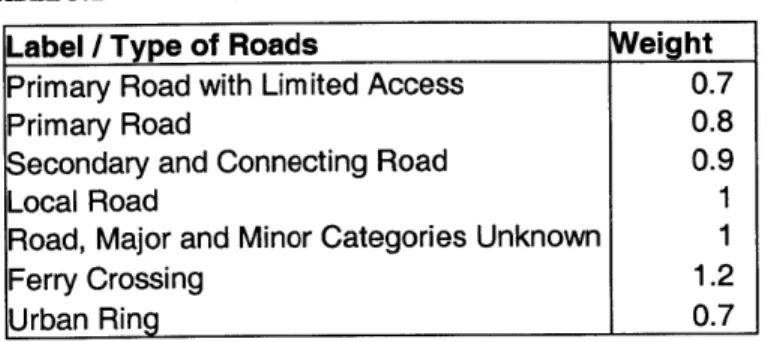
neighborhoods. Since ease of travel on each type of road differs, it is necessary to make the travel distance a better approximation to travel time by weighting distance by road type; by doing so, the weighted distance for major roads is shorter, and weighted distance for not-so-major roads will be longer. Since the best possible travel condition of the Urban Ring is equal to the "Primary Roads with Limited Access" (for example, highways), I assign the smallest weight (=0.7) to the
10 "Urban Ring Cities" is defined as the cities intersecting with the Urban Ring. The non-Suffolk County "Urban Ring Cities" include Brookline, Cambridge, Everett, and Somerville.
PAGE 24 CHAPTER 3 METHODOLOGY
Urban Ring segments. It is based on the assumption that the Urban Ring should facilitate transportation to the largest extent. Weights assigned for each type of roads are as follows:
TABLE 3.1 ASSIGNING WEIGHTS TO ROADS BY ROAD TYPE
(note: both labels and road types are assigned by ESRI)
For the rest of this paper, travel distance calculated are actually distance weighted by road type, which is a better estimate of travel time.
Because of the radial characteristics of Boston's transit system, I also assume that all O-D pairs before the Urban Ring Project will route through Downtown Crossing Station, and all O-D pairs will be impacted by the Urban Ring Project. However, there are exceptions, and these exceptions will be explained later in this section. I select Downtown Crossing Station to be the transfer station because it connects the Red and Orange Lines, and is within walking distance from Park Street Station where transfers from the Green and Red Lines can be made. With the Urban Ring Project, however, the trips will be the shortest distance from the place of residence to
the place of work via the Urban Ring.
Label / Type of Roads Weight
Primary Road with Limited Access 0.7
Primary Road 0.8
econdary and Connecting Road 0.9
LocalRoad 1
Road, Major and Minor Categories Unknown 1
Ferry Crossing 1.2
Urban Rin 0.7
PAGE 25 CHAPTER 3 MET HODOLOGY
PAGE 26
CHAPTER 3 METHODOLOGY
3.3.2.3 CHANGE IN TRAVEL DISTANCE
If two neighborhoods are not directly connected by the radial transit system, then the Urban Ring may save travel distance because there is no need to make a longer trip through Downtown. This is illustrated by the following diagram:
Suppose the Urban Ring is represented by the circle. X and Y are two neighborhoods respectively. C is the city's center where transfers are made; in the case of the Urban Ring, C is Downtown Crossing Station. A and B are the entry / exit points to the Urban Ring. Without the Urban Ring, all trips must be routed through C. Therefore, trip distance between X and Y without the Ring is the distance between neighborhood X and downtown C plus that between downtown
C and neighborhood Y (XC + CY). With the Urban Ring, there is no need to route through C.
Therefore, the new trip distance with the Urban Ring is the distance between neighborhood X and entry A, plus the segment distance along the Urban Ring between entry A and exit B, and
distance between exit B and neighborhood Y (XA + AB + BY). If the combined distance between entry A and downtown C plus that between downtown C and exit B is greater than the segment
distance between A and B ([AC + CB] > AB), then the difference ([AC + CB] - AB) is the travel
distance saved by the Urban Ring for trip X-Y.
Now, suppose travel distance for trip i-j before the Urban Ring is Dby and travel distance
for trip i-j after the Urban Ring is Day, change in travel distance will be [Dby - Da0]. If, with the
Urban Ring, travel distance becomes shorter for that O-D pair, then [Dbyj - Day] > 0. If there is an
increase in travel distance for that O-D pair, then [Dby - Day] < 0. Because commuters benefit
only when there is a decrease in residence-work trip distance, I will only consider the cases where
[Dby - Da] > 0 to calculate the total savings in residence-work trip distance. When i=j, d0 is zero since in this model, there is no travel between two points at the same location.
Savings in residence - work trip distances with destinations in places that are neither in
Suffolk County nor in the Urban Ring cities (that is, in "Work Zone 99") are assumed to be zero because it is assumed that impacts on these trips will be indirect and negligible.
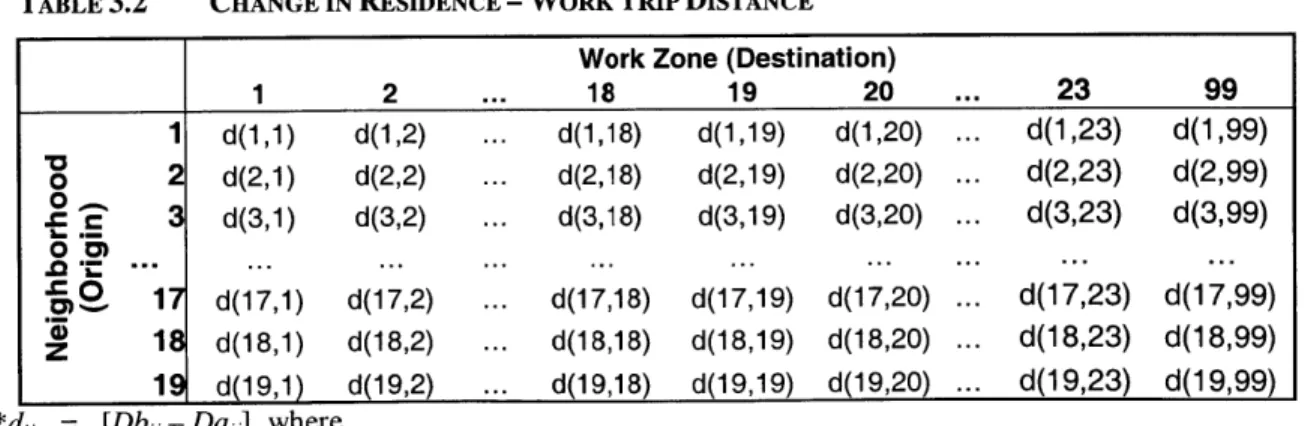
Since there are 19 origins (residential neighborhoods) and 24 destinations (work zones), a
19 x 24 matrix will be produced:
TABLE 3.2 CHANGE IN RESIDENCE - WORK TRIP DISTANCE
Work Zone (Destination)
1 2 ... 18 19 20 ... 23 99 1 d(1,1) d(1,2) ... d(1,18) d(1,19) d(1,20) ... d(1,23) d(1,99) 0 2 d(2,1) d(2,2) ... d(2,18) d(2,19) d(2,20) ... d(2,23) d(2,99) A [ 3 d(3,1) d(3,2) ... d(3,18) d(3,19) d(3,20) ... d(3,23) d(3,99) o M 00 17 d(17,1) d(17,2) ... d(17,18) d(17,19) d(17,20) ... d(17,23) d(17,99) 18 d(18,1) d(18,2) ... d(18,18) d(18,19) d(18,20) ... d(18,23) d(18,99) 19 d(19,1) d(19,2) ... d(19,18) d(19,19) d(19,20) ... d(19,23) d(19,99)
*dy = [Dbyj-Da 1], where
Dbyj is the residence-work distance between residential neighborhood i and work zonej before the
Urban Ring Project; and
PAGE 27 CHAPTER 3 METHODOLOGY