HAL Id: hal-01336316
https://hal.archives-ouvertes.fr/hal-01336316
Preprint submitted on 23 Jun 2016
HAL is a multi-disciplinary open access
archive for the deposit and dissemination of
sci-entific research documents, whether they are
pub-lished or not. The documents may come from
teaching and research institutions in France or
L’archive ouverte pluridisciplinaire HAL, est
destinée au dépôt et à la diffusion de documents
scientifiques de niveau recherche, publiés ou non,
émanant des établissements d’enseignement et de
recherche français ou étrangers, des laboratoires
Regression Trees and Random forest based feature
selection for malaria risk exposure prediction
Bienvenue Kouwaye
To cite this version:
Bienvenue Kouwaye. Regression Trees and Random forest based feature selection for malaria risk
exposure prediction. 2016. �hal-01336316�
Regression Trees and Random forest based
feature selection for malaria risk exposure
prediction.
Bienvenue Kouway`
e
1, 2, 3, ∗1- Universit´
e d’Abomey-Calavi, International Chair in
Mathmatical Physic and Applications (ICMP:UNESCO-Chair),
Abomey-Calavi, B´
enin
2- Universit´
e Paris 1 Panth´
eon Sorbonne, Laboratoire SAMM,
Paris, France.
3- Laboratoire SAMM Paris 1 France
* E-mail : [email protected]
Abstract
This paper deals with prediction of anopheles number, the main vector of malaria risk, using environmental and climate variables. The variables selection is based on an automatic machine learning method using regres-sion trees, and random forests combined with stratified two levels cross validation. The minimum threshold of variables importance is accessed using the quadratic distance of variables importance while the optimal subset of selected variables is used to perform predictions. Finally the results revealed to be qualitatively better, at the selection, the predic-tion, and the CPU time point of view than those obtained by GLM-Lasso method.
Keywords : Regression trees, random forest, cross-validation, variables selection, prediction.
1
Introduction
Generally, studies about disease like chikungunya, aids, and malaria provide data set containing a high number of variables and a small number of observa-tions. When it is important to perform prediction on the risk of these diseases, the goal is to provide a consistent heuristic to select the probable candidate predictor and perform prediction for the study and also where only explanatory data are available. Generally, experts in medicine, epidemiology, genetic, per-form treatment on variables before analysis, operations of selection, and forecast. Based on their knowledge, they decide to transform some variables in classes, to fix interactions between some variables, etc. In epidemiology context, the aim of this work is to provide an automatic algorithm for variables selection based on regression trees and random forest. This procedure must overcome the treat-ment done by experts, generate automatically a stable, and optimal subset of
predictors, and perform prediction for an other area where the target variable is not available. There are a lot of statistical modeling approach, such as linear model (LM), linear mixed model (LMM), generalized linear (GLM), generalized linear mixed (GLMM) for selection or prediction. However, these models fail when p > n, the number of variables (p) is more important than the number of observations (n). Experts also assume independence among explanatory vari-ables. A lot of methods of variables selection provide a subset for prediction but not stable, not consistent or more demanding in computation time like Wrap-per, embedded, filter, ranking, and their variant [1, 2, 3]. In recent works, we proposed one method of variables selection based on combination of Lasso and GLM through a double cross-validation (LOLO-DCV) named GLM-Lasso [4, 5]. The present work combines the stratified double cross validation (LOLO-DCV), and regression trees or random forest. This implies two methods : LOLO-DCV combined with regression trees, and LOLO-DCV combined with random forest. For malaria risk prediction, four strategies of variables selection LDRT, LDCT, LDRF, and LDCF are implemented. These strategies use some criteria such as : the mean, the quadratic risk, the absolute risk of the predictions, and the CPU time of algorithm computation. Each strategy is applied on four groups of variables (original, original with village, recoded, recoded with village). Most of the algorithms implemented in our work are based on [4, 5, 6, 7, 8]. We first pro-vided a threshold of variable importance measurement for each strategy. This threshold is very important because it puts out the importance or not of predic-tors. The second step is to make prediction through a double cross validation loop. The last step is to select predictors according to their frequency and make consistent prediction with the remain predictors. The results are compared to those obtained by reference method. The results obtained by such procedure are clearly better improved compared to those obtained by GLM-Lasso [4, 5] taken as the reference method. The improvement is about all properties such as the selection power, the selection accuracy, the sparsity of the best subset of variables, and the prediction. Moreover, the CPU time used to display our program is smaller than the one required by the reference method and only few climate and environmental variables are the main factors associated to the malaria risk exposure with an improved accuracy.
2
Materials
In this section, we briefly recall the description of the study area, the mosquito collection and identification as well as the data, and related variables. For more details, see [9].
2.1
Study area
The study was conducted in the district of Tori-Bossito (Republic of Benin), from July 2007 to July 2009. Tori-Bossito is on the coastal plain of Southern Benin, 40 kilometers north-east of Cotonou. This area has a subtropical climate and during the study, the rainy season lasted from May to October. Average monthly temperatures varied between 27◦C and 31◦C. The original equatorial forest has been cleared and the vegetation is characterized by bushes with sparse trees, a few oil palm plantations, and farms. The study area contained nine
villages (Avam´e centre, Gb´edjougo, Houngo, Anavi´e, Dohinoko, Gb´etaga, Tori Cada Centre, Z´eb`e, and Zoungoudo). Tori Bossito was recently classified as mesoendemic with a clinical malaria incidence of about 1.5 episodes per child per year [10]. Pyrethroid-resistant malaria vectors are present [11].
2.2
Mosquito collection and identification
Entomological surveys based on human landing catches (HLC) were performed in the nine villages every six weeks for two years (July 2007 to July 2009). Mosquitoes were collected at four catch houses in each village over three succes-sive nights (four indoors and four outdoors, i.e. a total of 216 nights every six weeks in the nine villages). Five catch sites had to be changed in the course of the study (2 in Gbedjougo, 1 in Avam`e, 1 in Cada, 1 in Dohinoko) and a total of 19 data collections were performed in the field from July 2007 to July 2009. In total, data from 41 catch sites are available. Each collector caught of predic-tional mosquitoes landing on the lower legs and feet between 10 pm and 6 am. All mosquitoes were held in bags labeled with the time of collection. The follow-ing mornfollow-ing, mosquitoes were identified on the basis of morphological criteria [12, 13]. All An. gambiae complex and An. funestus mosquitoes were stored in individual tube with silica gel and preserved at 220◦C. P. falciparum infection rates were then determined on the head and thorax of individual anopheline specimens by CSP-ELISA [14].
2.3
Environmental and behavioral data
Rainfall was recorded twice a day with a pluviometer in each village. In and around each catch site, the following information was systematically collected: (1) type of soil (dry lateritic or humid hydromorphic)assessed using a soil map of the area (map IGN Benin at 1/200 000 e , sheets XIV and NB-31-XV, 1968) that was georeferenced and input into a GIS; (2) presence of areas where building constructions are ongoing with tools or holes representing po-tential breeding habitats for anopheles; (3) presence of abandoned objects (or ustensils) susceptible to be used as oviposition sites for female mosquitoes; (4) a watercourse nearby; (5) number of windows and doors; (6) type of roof (straw or metal); (7) number of inhabitants; (8) ownership of a bed-net or (9) insect repellent; And (10) normalized difference vegetation index (NDVI) which was estimated for 100 meters around the catch site with a SPOT 5 High Resolution (10 m colors) satellite image (Image Spot5, CNES, 2003, distribution SpotImage S.A) with assessment of the chlorophyll density of each pixel of the image. Due to logistical problems, rainfall measurements are only available after the second entomological survey. Consequently, we excluded the first and second survey (performed in July and August 2007 respectively) from the statistical analyses.
2.4
Variables
The dependent variable was the number of Anopheles collected in a house over the three nights of each catch and the explanatory variables were the environ-mental factors, i.e. the mean rainfall between two catches (classified according to quartile), the number of rainy days in the ten days before the catch (3 classes [01], [24], >4 days), the season during which the catch was carried out (4 classes:
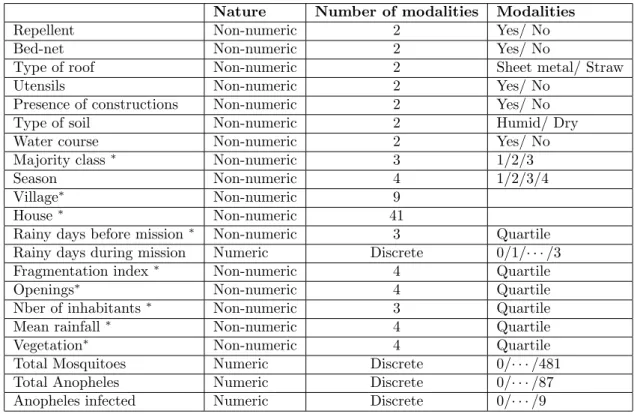
end of the dry season from February to April; beginning of the rainy season from May to July; end of the rainy season from August to October; beginning of the dry season from November to January), the type of soil 100 meters around the house (dry or humid), the presence of constructions within 100 meters of the house (yes/no), the presence of abandoned tools within 100 meters of the house (yes/no), the presence of a watercourse within 500 meters of the house (yes/no), NDVI 100 meters around the house (classified according to quartile), the type of roof (straw or Sheet metal), the number of windows (classified according to quartile), the ownership of bed nets (yes/no), the use of insect repellent (yes/no), and the number of inhabitants in the house (classified according to quartile). These pre-treatments based on the knowledge of experts in entomol-ogy, and medicine operated on some original variables generate a second type of variables called recoded variables. The original and recoded variables are described in Table 4. Two types of variables set are used : the first set, the original variables with all variables obtained by interactions; The second set, the recoded variables with all variables obtained by interactions. For knowing the effect of the village on the selection method and prediction, four groups of variables are considered : Group 1 (original variables), Group 2 (original vari-ables with village as fixed effect), Group 3 (recoded varivari-ables), and Group 4 (recoded variables with village as fixed effect)
3
Methodology
3.1
Variables importance
For individual tree, the variable importance is defined used the out-of-bag sam-pling like :
V IT(Xp) = (err^OOB
p
t− errOOBt) (1)
The naive importance measure in tree-based ensemble methods is to merely count the number of times each variable is selected by all individual tree in the group of trees. There also exist the ”Gini importance” measurement used in random forest for classification. The more advanced variable importance mea-surement in random forest is the ”permutation accuracy importance” defined as: V IRF(Xp) = 1 ntree ntree X t=1 (err^OOB p t− errOOBt) (2)
where V IT is variable importance of a tree, V IRF is variable importance of a random forest, Xpis the p-th variable, OOBtthe out-of-bag of tree t, ^OOB
p t the
sample obtained by randomly permuting the value of Xpin OOBtand errOOBt
the out-of-bag error for the tree t, ntree the number of regression trees in the random forest.
The Gini importance, and the permutation accuracy importance measures are employed as variable selection criteria in many recent study in various dis-ciplines. The effects induced by the differences in scale level of the predictors are more pronounced for the randomForest function, where variable selection in the individual tree is biased, than the one with cforest function where the individual trees are unbiased [15, 16]. It has been also shown that if cforest function is used with bootstrap sampling, the variables selection frequencies of
the categorical predictors still depend on their number of categories. Variable importance has a sensitivity to the number of observations and the number of variables. This sensitivity is reduced with increasing number of true variables. Variable importance has also sensitivity to mtry the minimum number of ob-servations at a node for splitting, and ntree the maximal number of trees in forest. It has been shown that for a fixed number of observations and variables, the effect of taking a larger value for mtry is evident. Indeed, the magnitude of variable importance is more double starting from mtry = 14 to mtry = 100, and it again increases with mtry = 200. The effect of ntree is less visible but taking ntree = 2000 leads to better stability [17] A lot of strategies have been developed for variable selection. The recursive elimination of feature based on variable importance developed by Avlarez de Andr´e runs like this. They first compute random forest variable importance. Then, at each step they eliminate the 20% of variables having the less importance and build a new forest with the remaining variables. They finally select the set of variables leading to the smallest OOB error rate of a forest defined by
errOOB = 1
nCard{i ∈ {1, . . . , n}|yi6= ˆyi} (3) where ˆyiis the most frequent label predict by trees t for which (xi, yi) is in the
OOBtsample [3]. But this proposition of variables elimination is arbitrary, and
the method does not depend on the data.
Robin Genuer proposed an other method of variable selection based on vari-able importance stratified in two steps [17]. The step 1 is a preliminary ranking which consisting in sorting the variables in decreasing order of Random forest scores of importance, and canceling the variables of small importance, m is the number of remaining at the second step, he selected the variables involved in the model leading to the smallest OOB error and at the end constructed an ascend-ing sequence of Random forest models by invokascend-ing, and testascend-ing the variables stepwise. The variables of the last model are selected. But this method lacks of precision because in the step 1 this strategy is sensible when it exist irrelevant variables, and at last step, variables invoking or testing can be sensitive to high correlation among variables. The method to access variable importance pro-posed by Daz-Uriarte [18] in scaled, unscaled, and Gini version is only available when the dependent variable is a factor.
3.2
Performance and accuracy in variables selection for
strategies
This part of the work is based on simulated data. It is necessary to show the power of each strategy to reduce effectively the number of variables and select the right variables in the optimal subset for prediction. Let VR and VW the
set of the real, and wrong variables respectively, SR, SW the set of the real, and
wrong selected variables respectively. Let V = VR∪ VW and S = SR∪ SW.
3.2.1 Selection power
It is defined as the ratio of the number of variables selected on the number of total variables (real and wrong). This quantity gives an idea of percentage of
elimination of variables. The selection power is noted SP and defined as :
SP = Card(S)
Card(V) (4)
3.2.2 Selection accuracy
It is defined as the ratio of the number of real variables selected on the number of total variables selected. This quantity gives the accuracy selection of variables. It is noted SA and defined as :
SA = Card(S
R)
Card(S) (5)
3.3
Strategy parameters construction
The parameters used in the strategies for variables selection are, the minimum threshold of variables importance, the minimum number of observations at each node before splitting in trees, and the maximum number of trees in forest build-ing.
3.3.1 Heuristic of variable importance measurement
The strategy of variable importance measurement proposed in this paper is based on a minimum threshold. For any model of regression trees and random forest, if any variable has importance greater than this threshold, it is considered as important variable in the model. One of the difficulties in this study is the decision of the minimum of importance of variable. We have a lot of techniques to check this number. The strategy proposed by Genuer et al [17] is sensible when it exist irrelevant variables. A classical alternative is to select the threshold according to some elbow finding strategy on the variable importance mean curve. In this paper we propose a new strategy running like this : we run the full model using the whole data frame nrtimes (default nr=100) with the default
parameters. The matrix of variables important noted MV I is a nr× q-matrix
defined as : MV I = V I11 V I12 . . . V I1nr V I21 V I22 . . . V I2nr .. . ... ... V Iq1 V Iq2 . . . V Iqnr
V Iijis the importance of ithvariable at jthrepetition, 1 ≤ i ≤ q and 1 ≤ j ≤ nr.
Let MV I = (V I.1, V I.2, . . . , V I.nr) if V I.i= (V I1i, V I2i, . . . , V Iqi) t then σi= min{V I.i, V I.i6= θ, 1 ≤ i ≤ nr} and σ = (σ1, σ2, . . . , σnr)
where At is the transposed of the matrix A, and θ is the null vector. The
minimum threshold of variables importance noted V Imin is defined as :
V Imin= min(σ) + sd(σ) (6)
3.3.2 Parameters mtry and ntree accessing
These parameters are accessed through a simple cross validation process. The data set is divided into two parts : EAthe learning set, and ET the test set. On
EA, it has been performed one kind of variable selection method varying one
specific parameter. For the regression tree, the parameter concerned mtry, the minimum number of observations that must exist at a node in order for a split to be attempted. For the forest, this parameter is ntree, the maximal number of trees in the forest. These parameters will be noted m for simplification of notations, 1 ≤ m ≤ nobs where nobs is the number of observations in EA. For
each value of m, the corresponding regression tree or the random forest provides a vector of importance V I. m. Let cV Imthe vector of mean of the vectors V I. m.
The quadratic distance is defined as :
d( cV Im, V I. m) = nvar X j=1 ( cV Im− V Ij m)2 1/2 , 1 ≤ m ≤ nobs (7)
where nvar is the number of variables
The parameter m is determined by optimizing the quadratic distance of importance. Let define :
H = Arg min
m d( cV Im, V I. m) (8)
If Card(H) = 1 then H = {h0} and
mtry = ntree = h0 (9)
If Card(H) ≥ 2 then
mtry = min{H} and ntree = max{H} (10) A regression tree with this value of mtry or a Random forest (RF) with this value of ntree will perform prediction on ET. All this process will be repeated
until prediction is computed for all observations.
3.3.3 Algorithm of variables selection and prediction This algorithm is similar to the one developed in a recent work [5, 4].
3.4
Variables selection strategies
Four strategies of variables selection are implemented and compared to the ref-erence method GLM-Lasso developped in [5, 4]. The first strategy, LDRT is a combination of LOLO-DCV (Leave-one-out-double-cross-validation), and re-gression tree (RT) [19, 20]; The second LDCT is a combination of LOLO-DCV and conditional tree (CT) [21]; The third LDRF, a combination of LOLO-DCV
Algorithme 3.1 LOLO-DCV-Tree-Forest 1. Determination of V Imin
2. The data are separated in N -folds 3. A each step of the first level
(a) The folds are regrouped in two part : EA and ET, EA: the learning
set which contained the observations of (N − 1)-folds, ET : the test set, contained the observations of the last fold.
(b) Holding-out ET
(c) The second level of cross-validation
i. A full cross validation is computed on EA for determination of
the first model construction parameter m (mtry or ntree). ii. Tree or forest model Mmis computed on EA using m
iii. The importance of variables V I. m. is accessed.
iv. Predictions are performed using a Mmmodel on ET
4. The step (3c) is repeated until predictions are performed for all observa-tions, and a matrix MV I of importance is recorded.
5. The vector mean cV I (representative) of MV I is determined.
and Random forest (RF) [16, 22, 23]; And the last LDCF is a combination of LOLO-DCV and conditional forest (CF) [21]. The selection power, the selec-tion accuracy of each strategy is determined on simulated data. The model construction parameter for each strategy is accessed based on the quadratic dis-tance between impordis-tance and the mean of impordis-tance. Each strategy based on the threshold of the minimum of variable importance selects an optimal subset of variables.
4
Results
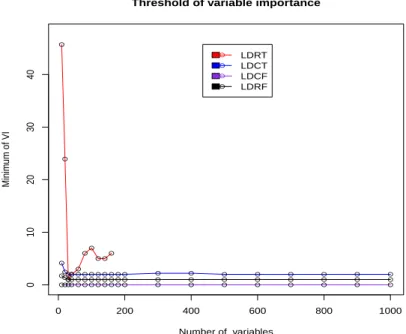
First of all, we show the numerical convergence of V Imin in Equation (6) for
each strategy on simulated data. The results are shown in table 1 and figure 2. We also show the power of each strategy to reduce the number of variables, and select the true variables in the optimal subset for prediction. The results are presented in table 1
4.1
Simulated study
We simulated a data base of n observations and p true variables. We generated p-explanatory variables X, and the target variable Y knowing that (Y |X) ∼ P(E(Xβ)) where β is the vector of coefficients of X, and P(E(Xβ)) is a Poisson distribution of parameter E(Xβ). We also generated another p-variables Z which don’t participate to the determination of Y . One of the strength of the algorithm is its capacity to avoid in selection the wrong variables at most possible. The final number of variable in learning is 2 × p the set X of generic explanatory variables contains : Gaussian variable, XNp ∼ N (µp, σp2); discrete
variable which values are in range (1, 10), categorical variables with at most 10 modalities, and variables following Poisson distribution of parameter λXP. For
illustration, β ∼ N (0, 1), µp∈ {−1, 0, 1}, σp = 1, and λXP = 1
4.2
Application to malaria data
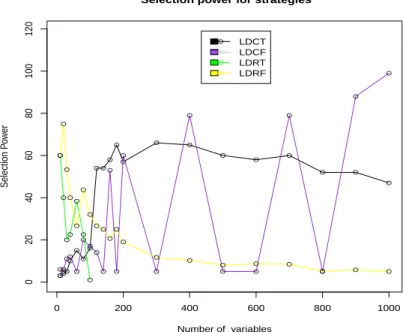
The results of application of strategies LDRT, LDCT, LDRF, and LDCF on malaria data are shown in tables 2, and 3. The strategy LDRT do not converge. The threshold of variable importance is null for LDCF. So any variable with non null importance will be importante. The threshold of variable importance is very high for LDCT, table 2. The strategies LDCT, LDCF, and LDRF have a mean in prediction which is equal to the mean of observations. LDRF has the low quadratic risk, abolute risk, the low computation time, and the most sparse subset of remained variables but its mean in prediction is greater than the one of observations, table 3.
5
Discussion
The table 1 shows that computation is not compiled for LDRT if the number of variables is greater than 40 approximatively. This is due to the non convergence of the rpart function in the package rpart for construction of regression tree. For Random forest, the convergence of the percentage of selected variables is not ensured. But the convergence is obtained when we combined LOLO-DCV
0 200 400 600 800 1000 0 20 40 60 80 100 120
Selection power for strategies
Number of variables Selection P ow er ●● ●●● ● ● ● ● ● ● ● ● ● ● ● ● ● ● ● ● ● ● ● ●● ● ● ● ● ● ● ● ● ● ● ● ● ● ● ● ● ● ● ● ● ● ● ● ● ● ● ● ● ● ● ●● ● ● ● ● ● ● ● ● ● ● ● ● ● ● ● LDCT LDCF LDRT LDRF
Figure 1: Selection power of strategies according to number of vari-ables. Each line shows the trajectory of the selection for each strategy on simulated data.
Table 1: Summary on results of selection power and selection accuracy for different strategies. MVI= Minimum variable importance, SP= selection power, SA= Selection accuracy
number of variables 250 300 350 400 500 80 600 800 LDRT SP - - - -SA - - - -MVI - - - -LDCT SP 38.00 45 46 47.00 38.0 44.0 46.00 36.00 SA 26.88 26.11 26.5 15.33 9.75 9 6.83 5.71 MVI 2.00 2 2.20 2.2 2.0 2.00 2.00 2 LDRF SP 20.62 21.67 17.00 15.00 11.75 9.00 9.33 8.57 SA 38.12 33.33 33 23 14.75 12 8.83 7.14 MVI 1.00 1.0 1 1.00 1 1.00 1.00 1.0 LDCF SP 48 62.00 5.0 67.00 88 5 5.00 5.00 SA 30 34.44 2.5 22.33 22 1 0.83 0.71 MVI 0 0 0 0 0 0 0 0
with Random Forest (LDRF). The percentage of remained variables is around 5%. The results are also shown in figure 1. It is evident that the convergence
0 200 400 600 800 1000 0 10 20 30 40
Threshold of variable importance
Number of variables Minim um of VI ● ● ● ●● ●● ● ● ● ● ●●● ● ● ● ● ● ● ● ● ● ● ● ● ● ● ● ● ●●●● ● ● ● ● ● ● ● ● ● ● ● ● ● ● ● ● ●●●● ● ● ● ● ● ● ● ● ● ● ● ● ● ● ● ● ● ● ● ● LDRT LDCT LDCF LDRF
Figure 2: Threshold of variable importance measurement. Each line shows the trajectory of the variable importance for each strategy on simulated data.
Table 2: Threshold of variable importance measurement on real data. LDRT LDCT LDRF LDCF
VImin - 5.12507 1.1 0
Table 3: Summary on results of selection power, selection accuracy, and minimum of variable importance on malaria data
Method Mean QR Absolute risk Remain variables Time CPU
Observations 3.74 - - - -GLM-Lasso 3.74 54.54 3.669 3 25786.87 LDRT - - - - -LDCT 3.74 50.56 3.217 4 24378.38 LDRF 3.75 49.56 2.876 3 6715.09 LDCF 3.74 49.987 3.001 4 24830.34
of LDCF is not stable because the alternative high and low percentage of re-mained variables. The figure 2 confirms the non convergence of LDRT over
approximatively 40 variables. Even if the algorithm did not converge for all number of variable, the minimum is attempted, and the trajectory is convex. For the strategies LDCT, LDRF, and LDCF, the minimum of variable impor-tance converges, and the results are shown in the line ”MVI” of table 1, and in figure 2 for each strategy. This denotes that the algorithm can compute cor-rectly the threshold of importance of variable for any number of variable but not for LDRT. The results of application about malaria data are shown in table 3. The minimum of variable importance that we got for each method are noted in table 2. Unfortunately this minimum for LDCF is null. It means that for any positive value, the variable is important but four variable are selected at the end. For LDCT, the threshold of importance is very high, table 2 nevertheless four variables are remained in the final model, tabe 3. It denotes that only few variables are important in the model. The methods which have the mean in prediction equals to the mean of observations are LDCT, and LDCF. LDCF is the best in selection accuracy. LDRF has the lowest quadratic risk, the lower absolute risk but it isn’t the best prediction. LDRF is the most sparse method with three variables. Unlike LDRF, LDCF, and LDCT which are more time consuming table 3.
6
Conclusion
In this work, we implemented an algorithm for the prediction of malaria risk using environmental and climate variables. We performed the variables selec-tion using an automatic machine learning by a method combining regression trees or random forest, and stratified two levels cross validation. The minimum threshold of variable importance is computed. variables selected by each strat-egy are used to perform prediction. The results obtained with this method is clearly improved by those obtained with the combination of Lasso, and LOLO-DCV (GLM-Lasso) taken as reference method. The improvement concerned all properties such as the quality of the selection, and prediction. Moreover, this method didn’t need interaction between variables, the pre-treatments of experts were overcome, and the CPU time used to display our program is smaller than the one required by the reference method. The optimal subset of variables for prediction contained season, mean rain fall, and vegetation index.
7
Apendix
Table of variables Description The authors have declared that no competing interests exist.
Table 4: Description of variables. Variables with star are recoded.
Nature Number of modalities Modalities
Repellent Non-numeric 2 Yes/ No
Bed-net Non-numeric 2 Yes/ No
Type of roof Non-numeric 2 Sheet metal/ Straw
Utensils Non-numeric 2 Yes/ No
Presence of constructions Non-numeric 2 Yes/ No Type of soil Non-numeric 2 Humid/ Dry Water course Non-numeric 2 Yes/ No Majority class ∗ Non-numeric 3 1/2/3
Season Non-numeric 4 1/2/3/4
Village∗ Non-numeric 9
House∗ Non-numeric 41
Rainy days before mission∗ Non-numeric 3 Quartile Rainy days during mission Numeric Discrete 0/1/· · · /3 Fragmentation index∗ Non-numeric 4 Quartile
Openings∗ Non-numeric 4 Quartile
Nber of inhabitants∗ Non-numeric 3 Quartile Mean rainfall∗ Non-numeric 4 Quartile Vegetation∗ Non-numeric 4 Quartile Total Mosquitoes Numeric Discrete 0/· · · /481 Total Anopheles Numeric Discrete 0/· · · /87 Anopheles infected Numeric Discrete 0/· · · /9
References
[1] I. Guyon, An introduction to variable and feature selection, Journal of Machine Learning Research 3 (2003) 1157–1182.
[2] G. Bontempi, Structural feature selection for wrapper methods, in: ESANN 2005, 13th European Symposium on Artificial Neural Networks, Bruges, Belgium, April 27-29, 2005, Proceedings, 2005, pp. 405–410.
[3] D.-U. Ramn, S. A. de Andrs, Gene selection and classification of microar-ray data using random forest, BMC Bioinformatics 7 (3) (2006) 1–13. doi:doi:10.1186/1471-2105-7-3.
URL http://www.biomedcentral.com/1471-2105/7/3
[4] B. Kouwaye, N. Fonton, F. Rossi, Lasso based feature selection for malaria risk exposure prediction, in: 11th International Conference, MLDM 2015 Hamburg, Germany, July 2015 Poster Proceedings, ibai publishing, Ma-chine Learning and Data Mining in Pattern Recognition, Petra Perner (Ed.), 2015.
[5] B. Kouwaye, N. Fonton, F. Rossi, S´election de variables par le glm-lasso pour la pr´ediction du risque palustre, in: 47`emes Journees de Statistique de la SFdS, Lille, France, Hal, hal-01196450, 2015.
[6] N. S. J. Friedman, T. Hastie, R. Tibshirani, Lasso and elastic-net regular-ized generalregular-ized linear models, http://www.jstatsoft.org/v33/i01/ R CRAN (2015).
[7] J. J. Goeman, L1 penalized estimation in the cox proportional hazards model, Biometrical Journal 52 (1) (2010) 70–84.
[8] H. Zou, T. Hastie, Regularization and variable selection via the elastic net, Journal of the Royal Statistical Society. Serie B 67 (2005) 301–320. [9] G. Cottrell, B. Kouway`e, C. Pierrat, A. le Port, A. Bourama, N. Fonton,
M. N. Hounkonnou, A. Massougbodji, V. Corbel, A. Garcia, Modeling the Influence of Local Environmental Factors on Malaria Transmission in Benin and Its Implications for Cohort Study, PlosOne 7 (2012) 8.
[10] G. B. Damien, A. Dj`enontin, C. Rogier, V. Corbel, S. B. Bangana, F. Chan-dre, M. Akogb´eto, D. Kind´e-Gazard, A. Massougbodji, M.-C. Henry, Malaria infection and disease in an area with pyrethroid-resistant vectors in southern benin, Malaria journal 9 (1) (2010) 380.
[11] . G. B. Damien, A. Djenontin, V. Corbel, C. Rogier, S. B. Bangana, et al, Malaria and infection disease in an erea with pyrethroid-resitant vectors in southern Benin, Malaria Journal 9:380.
[12] D. Gillies, B. D. Meillon, The Anophelinae of Africa south of the Sahara), Pub South Afr Inst Med Res Johannesburg.
[13] D. Gillies, B. D. Meillon, A supplement to the Anophelinae of Africa south of the Sahara (Afrotropical region), Pub South Afr Inst Med Res.
[14] R. A. Wirtz, F. Zavala, Y. Charoenvit, G. H. Campbell, T. R. Burkot, et al, Comparative testing of monoclonal antibodies against Plasmodium falciparum sporozoites for ELISA development, Bull World Health Organ 65 (1987) 39–45.
[15] C. Strobl, A.-L. Boulesteix, A. Zeileis, T. Hothorn, Bias in random forest variable importance measures: Illustrations, sources and a solution, BMC Bioinformatics 8 (25).
[16] K. J. Archer, R. V. Kimes, Empirical characterization of random forest variable importance measures, Comput. Stat. Data Anal. 52 (4) (2008) 2249–2260. doi:10.1016/j.csda.2007.08.015.
URL http://dx.doi.org/10.1016/j.csda.2007.08.015
[17] R. Genuer, J.-M. Poggi, C. Tuleau-Malot, Variable selection us-ing random forests, Pattern Recogn. Lett. 31 (14) (2010) 2225–2236. doi:10.1016/j.patrec.2010.03.014.
URL http://dx.doi.org/10.1016/j.patrec.2010.03.014 [18] R. Daz-uriarte, Variable selection using random forest (2014).
URL http://ligarto.org/rdiaz/Software/Software.html
[19] . Gey, S, E. Nedelec, Model selection for cart regression trees, Information Theory, IEEE Transactions 51 (2005) 658–670.
[20] B. Riple, Classification and regression trees. (2014).
[21] T. Hothorn, K. Hornik, C. Strobl, A. Zeileis., A laboratory for recursive partytioning (2015).
[22] G. Biau, Analysis of random forests model, universit paris 6 (2010). [23] A. Liaw, M. Wiener., Breiman and cutler’s random forests for classification