HAL Id: hal-02409227
https://hal.archives-ouvertes.fr/hal-02409227
Submitted on 22 Nov 2020
HAL is a multi-disciplinary open access
archive for the deposit and dissemination of
sci-entific research documents, whether they are
pub-lished or not. The documents may come from
teaching and research institutions in France or
abroad, or from public or private research centers.
L’archive ouverte pluridisciplinaire HAL, est
destinée au dépôt et à la diffusion de documents
scientifiques de niveau recherche, publiés ou non,
émanant des établissements d’enseignement et de
recherche français ou étrangers, des laboratoires
publics ou privés.
Stratification and prediction of remission in first-episode
psychosis patients: the OPTiMiSE cohort study
Emanuela Martinuzzi, Susana Barbosa, Douglas Daoudlarian, Wafa Bel Haj
Ali, Cyprien Gilet, Lionel Fillatre, Olfa Khalfallah, Réjane Troudet, Stéphane
Jamain, Guillaume Fond, et al.
To cite this version:
Emanuela Martinuzzi, Susana Barbosa, Douglas Daoudlarian, Wafa Bel Haj Ali, Cyprien Gilet, et al..
Stratification and prediction of remission in first-episode psychosis patients: the OPTiMiSE cohort
study. Translational Psychiatry, Nature Pub. Group, 2019, 9 (1), �10.1038/s41398-018-0366-5�.
�hal-02409227�
Martinuzzi et al.Translational Psychiatry (2019) 9:20
https://doi.org/10.1038/s41398-018-0366-5
Translational Psychiatry
A R T I C L E
O p e n A c c e s s
Strati
fication and prediction of remission in
first-episode psychosis patients: the
OPTiMiSE cohort study
Emanuela Martinuzzi
1, Susana Barbosa
1, Douglas Daoudlarian
1, Wafa Bel Haj Ali
2, Cyprien Gilet
3, Lionel Fillatre
3,
Olfa Khalfallah
1, Réjane Troudet
2, Stéphane Jamain
2, Guillaume Fond
4, Iris Sommer
5,6, Stefan Leucht
7,8,
Paola Dazzan
8, Philip McGuire
8, Celso Arango
9, Covadonga M. Diaz-Caneja
9, Wolfgang Fleischhacker
10, Dan Rujescu
11,
Birte Glenthøj
12, Inge Winter
13, René Sylvain Kahn
13, Robert Yolken
14, Shon Lewis
15, Richard Drake
15,
Laetitia Davidovic
1, Marion Leboyer
2,16,17and Nicolas Glaichenhaus
1,17, the OPTiMiSE Study Group
Abstract
Early response tofirst-line antipsychotic treatments is strongly associated with positive long-term symptomatic and functional outcome in psychosis. Unfortunately, attempts to identify reliable predictors of treatment response in first-episode psychosis (FEP) patients have not yet been successful. One reason for this could be that FEP patients are highly heterogeneous in terms of symptom expression and underlying disease biological mechanisms, thereby impeding the identification of one-size-fits-all predictors of treatment response. We have used a clustering approach to stratify 325 FEP patients into four clinical subtypes, termed C1A, C1B, C2A and C2B, based on their symptoms assessed using the Positive and Negative Syndrome Scale (PANSS) scale. Compared to C1B, C2A and C2B patients, those from the C1A subtype exhibited the most severe symptoms and were the most at risk of being non-remitters when treated with the second-generation antipsychotic drug amisulpride. Before treatment, C1A patients exhibited higher serum levels of several pro-inflammatory cytokines and inflammation-associated biomarkers therefore validating our stratification approach on external biological measures. Most importantly, in the C1A subtype, but not others, lower serum levels of interleukin (IL)-15, higher serum levels of C-X-C motif chemokine 12 (CXCL12), previous exposure to cytomegalovirus (CMV), use of recreational drugs and being younger were all associated with higher odds of being non-remitters 4 weeks after treatment. The predictive value of this model was good (mean area under the curve (AUC)= 0.73 ± 0.10), and its specificity and sensitivity were 45 ± 0.09% and 83 ± 0.03%, respectively. Further validation and replication of these results in clinical trials would pave the way for the development of a blood-based assisted clinical decision support system in psychosis.
Introduction
Psychotic symptomatology includes loss of contact with reality, thought disorder, delusions and hallucinations, unusual or bizarre behavior, impaired social interactions and difficulties to carry out daily activities1
. While psy-chosis could be caused by recreational drug use, physical illness or brain trauma, it is often symptomatic of the onset of severe psychiatric disorders such as schizo-phrenia, schizoaffective disorder or bipolar disorder.
© The Author(s) 2019
Open Access This article is licensed under a Creative Commons Attribution 4.0 International License, which permits use, sharing, adaptation, distribution and reproduction in any medium or format, as long as you give appropriate credit to the original author(s) and the source, provide a link to the Creative Commons license, and indicate if changes were made. The images or other third party material in this article are included in the article’s Creative Commons license, unless indicated otherwise in a credit line to the material. If material is not included in the article’s Creative Commons license and your intended use is not permitted by statutory regulation or exceeds the permitted use, you will need to obtain permission directly from the copyright holder. To view a copy of this license, visithttp://creativecommons.org/licenses/by/4.0/.
Correspondence: Marion Leboyer (marion.leboyer@inserm.fr) or Nicolas Glaichenhaus (nicolas.glaichenhaus@unice.fr)
1Université Côte d’Azur, Centre National de la Recherche Scientifique, Institut
de Pharmacologie Moléculaire et Cellulaire, Valbonne, France
2Université Paris Est Créteil, Faculté de Medicine Institut, National de la Santé et
de la Recherche Médicale, Créteil, France
Full list of author information is available at the end of the article. These authors contributed equally: Emanuela Martinuzzi, Susana Barbosa, Douglas Daoudlarian, Wafa Bel Haj Ali .
Co-senior authors: Marion Leboyer, Nicolas Glaichenhaus.
1234567890() :,; 1234567890( ):,; 1234567890() :,; 1234567890( ):,;
According to current guidelines,first-line treatments of psychosis involve the use of the minimum effective dose of second-generation antipsychotics whenever possible. Whatever criteria are used to assess response to treat-ment, responses are highly heterogeneous. While 25–30% of first-episode psychosis (FEP) patients fully respond, a majority respond partially or not at all, and are therefore switched to second-line treatments2. As early response to treatment is one of the main factors associated with improved long-term prognosis3–5, identifying predictors of treatment response in FEP patients is an important issue in the field6. Response to treatment could be assessed either using predefined cutoffs in the percentage of reduction of baseline scores on a psychopathology rating scale7, or by measuring the proportion of patients meeting remission criteria. According to the definition proposed by the Remission in Schizophrenia Working Group (RSWG), remission can be defined by an absolute threshold of severity of symptoms in three dimensions: reality distortion, disorganization and negative symp-toms8. Using this consensus definition, it was found that global functioning in the year before admission, the total score of the Strauss Carpenter Prognostic Scale and the Positive and Negative Syndrome Scale (PANSS) negative sub-score at admission were all predictive of symptom remission in cohorts of schizophrenia inpatients9,10. Despite these latter studies, clinicians still lack reliable predictors of remission in FEP patients.
Several environmental risk factors for psychosis have been identified11
including autoimmune disorders12 and infec-tion with Toxoplasma gondii13, cytomegalovirus (CMV)14 and herpes simplex virus (HSV) type 115. Meta-analyses have shown that drug-naive FEP patients exhibit altered serum levels of various cytokines compared to healthy individuals16–18. Since these data suggested a possible link between immune dysregulation and psychosis, it was pro-posed that serum levels of cytokines, chemokines and bio-markers of inflammation could predict early response to treatment6. However, antipsychotic treatments could impact cytokine levels including those of interleukin (IL)-1β, interferon (IFN)-γ, IL-12 and tumor necrosis factor (TNF)-α19–23. Therefore, the predictive value of serum biomarkers should be ideally assessed in minimally treated or untreated FEP patients, which is a challenge because of the difficulty to enroll these patients in clinical trials. This may be the reason for which only a few studies have investigated the association between baseline levels of per-ipheral biomarkers and remission in FEP patients. To identify biological predictors of remission in FEP patients, we have analyzed clinical data and biological samples from the multinational, multi-centered, randomized, double-blind “Optimization of Treatment and Management of Schizophrenia in Europe (OPTiMiSE)” study in which FEP patients were clinically assessed before and after 4 weeks of
treatment with the second-generation antipsychotic ami-sulpride24. Our results demonstrate that serum levels of immune-related proteins before treatment combined with a few clinical variables could predict remission in at least a subtype of FEP patients.
Materials and methods
Patients
The OPTiMiSE study was conducted in 27 general hospitals and clinics in 14 European countries, Israel and Australia (Clinicaltrials.gov identifier is NCT01248195). FEP patients based on the EUFEST (European First Epi-sode Schizophrenia Trial) study definition25
were recrui-ted between May 2011 and April 2016 at the participating centers from nearby healthcare facilities. Eligible patients were aged 18–40 years and met criteria of the Diagnostic and Statistical Manual of Mental Disorders (4th edition) for schizophrenia, schizophreniform disorder or schi-zoaffective disorder. A total of 479 patients signed informed consent. Diagnoses were confirmed by the Mini International Neuropsychiatric Interview plus. Patients were excluded if more than 2 years had passed since the start of the FEP; if any antipsychotic drug had been used for more than 2 weeks in the previous year and/or for a total of 6-week lifetime; if patients had a known intoler-ance to one of the study drugs; if patients met any of the contraindications for any of the study drugs; if patients were coercively treated and/or represented by a legal guardian or under legal custody; or if patients were pregnant or breast feeding. Patients were required to provide written informed consent.
Patient clinical assessment and primary outcome
A screening visit was conducted during which eligibility was assessed. Baseline data were obtained regarding demographics, diagnoses, current treatments and psy-chopathology: PANSS total score and sub-scores, overall severity of symptoms assessed using the Clinical Global Impression (CGI) scale26, depression assessed using the Calgary Depression Scale for Schizophrenia (CDSS)27and social functioning assessed using the Personal and Social Performance Scale (PSP)28. Recreational drug use was also assessed. Data were collected at baseline and 4–5 weeks later.
All patients were treated for 4 weeks with up to 800 mg/ day amisulpride in an open design. The primary outcome was symptomatic remission according to the criteria of Andreasen et al.8: a score of≤3 (on a scale ranging from 1 to 7) simultaneously on 8 PANSS items: P1, P2, P3, N1, N4, N6, G5 and G9.
Blood samples
Peripheral blood samples were obtained from fasting subjects between 7:00 am and 9:00 am. Five milliliters of
peripheral blood were drawn by venipuncture into serum Vacutainer tubes. For the serum collection, the blood was allowed to clot for 1 h before centrifugation (1500 × g, 10 min). The serum and plasma samples were stored in 0.5 ml aliquots at −80 °C. For measuring protein and antibody levels, serum samples were thawed on ice, and 50 µl aliquots were prepared and stored at−80 °C.
Immunoassay
Serum levels of IL-1α, IL-1β, IL-2, IL-4, IL-5, IL-6, IL-7, 8, 10, 12p40, 12p70, 13, 15, 16 IL-17, IL-18, IL-21, IL-23, IL-27, IFN-γ, chemokines (C-C motif chemokine ligand (CCL)-2, CCL3, CCL4, CCL11, CCL13, CCL17, CCL19, CCL20, CCL22, CCL26, CCL27, and C-X3-C motif chemokine ligand (CX3CL)-1, CXCL10, CXCL11, CXCL12), TNF-α, TNF-β, granulocyte macrophage-colony stimulating factor, vascular endothe-lial growth factor (VEGF), C reactive protein (CRP), serum amyloid A protein (SAA), soluble intercellular adhesion molecule 1 (sICAM-1) and soluble vascular adhesion molecule 1 (sVCAM-1) were measured using the Pro-inflammatory Panel 1, Cytokine Panel 1, Che-mokine Panel 1, Th17 Panel 1 and Vascular Injury Panel 2 v-PLEX® kits (MSD). All assays were performed according to the manufacturer’s instructions. The data were acquired on the V-PLEX® Sector Imager 2400 plate reader and analyzed using the Discovery Workbench 3.0 soft-ware (MSD). The standard curves for each cytokine were generated using the premixed lyophilized standards pro-vided in the kits. Serial twofold dilutions of the standards were run to generate a 13-standard concentration set, and the diluent alone was used as a blank. The cytokine concentrations were determined from the standard curve using a 4-parameter logistic curve fit to transform the mean light intensities into concentrations. The lower limit of detection (LLOD) was determined for each cytokine and for each plate as the signal recorded for the blank plus 2 standard deviations (SDs).
Serology
We measured plasma immunoglobulin G (IgG) anti-bodies reacting to HSV type 1, CMV and T. gondii using previously described immunoassay methods29. Diluted plasma was applied to antigens immobilized on the wells of microtiter plates and bound antibodies were quantified by means of reaction with enzyme-labeled anti-human IgG and the corresponding substrate. Reagents and assay kits for anti-HSV-1 were obtained from Focus Labora-tories (USA). Anti-CMV and anti-Toxoplasma antibodies were obtained from IBL Laboratories (Germany). Results were obtained as quantitative values determined by comparison of the level of reactivity to standards run with each assay, as well as qualitative results listed as“positive” or“negative”.
Statistical analysis
In univariate analysis, Mann–Whitney–Wilcoxon tests were performed to assess statistical significance of non-Gaussian distributed data. To develop a predictive model for remission we used the elastic net, which is a regular-ized regression model, i.e., general linear model with penalties to avoid extreme parameters that could cause overfitting30. Elastic net is also a method of selection of variables that addresses the issue of multicollinearity that arises in our dataset because cytokines and chemokines are not independent of each other. To minimize variation across testing datasets, we repeated fivefold cross-validation 100 times with independent random dataset partitions to optimize stability31. We tuned the hyper-parametersα and λ 10 times for each partition via fivefold cross-validation with the optimal tuning parameter values chosen to maximize the area under the receiver operating characteristics (ROC) curve (AUC)32. Weighted odds ratios (ORs) were calculated using the proportion of drawings in which the variable was selected as a weight. All statistical analyses were performed using the R soft-ware packages Stats33, Caret34, Glmnet35, pROC36 and eNetXplorer37.
Unsupervised statistical classification
To stratify m patients into k clusters based on their PANSS scores (d items per patient), we prepared a matrix X with one patient per line and one PANSS item per column (Supplementary Figure 1). Our objective was to find a matrix Y of labels. We thus tried to solve an opti-mization problem forfinding a space which discriminated clusters based on a limited number of weighted PANSS items. The output was a W (weight) matrix with k col-umns and d lines computing the weight of each PANSS item. We achieved this goal using an alternating mini-mization procedure on Y and W in which we tried to minimize the Frobenius norm38.
Results
Soluble serum biomarkers did not predict remission in non-stratified FEP patients
A total of 479 patients were included in the OPTiMiSE clinical trial. Out of the 446 patients in the intention-to-treat sample, 371 completed amisulpride intention-to-treatment. Among those, 325 had serum samples collected before the study treatment was initiated and were included in the present study (Table 1). Clinical assessment 3-4 weeks after treatment initiation revealed that 68.6% of the patients were in symptomatic remission39 according to the consensus definition8
. As a first attempt to identify biomarkers that could predict remission, we analyzed serum samples for 43 interleukins, chemokines and bio-markers of inflammation. Among these proteins, 8 were below the LLOD in more than 10% of the samples and
were not included in downstream analyses (Supplemen-tary Table 1). In an exploratory analysis, we compared the levels of the 35 remaining proteins in remitters and non-remitters using univariate analysis. After correction for multiple test, none of these 35 proteins was present at different levels in remitters and non-remitters (Supple-mentary Table 2).
In contrast to univariate methods that assess the dif-ferential expression of proteins on a single feature level, multivariate classification methods such as regularized logistic regression allows for establishing a prediction model based on samples with known class outcomes, e.g., remission versus non-remission40. A set of clinical and biological variables with the best joint discriminatory ability to differentiate between classes could be identified, and the resulting prediction model could then be used to predict the class outcomes of new patient samples. As a second attempt to predict remission, we investigated the association between serum protein levels and remission using regularized logistic regression after adjustment for age, gender, body mass index (BMI), waist circumference, use of recreational drugs and seropositivity to T. gondii, CMV and HSV-1. Applying this method to the dataset did
not allow for identifying proteins whose serum levels were associated with increased odds of being non-remitters (not shown).
One obvious explanation for this negative result could be that none of the studied serum proteins is relevant for discriminating remitters and non-remitters among FEP patients. Alternatively, the heterogeneity of psychotic disorders in terms of symptomatology and likely etiology and pathophysiology may impede the identification of underlying remission predictors in a general population of FEP patients. To overcome this issue, we sought to stratify FEP patients based on their individual symptomatology assessed using the PANSS instrument41.
Patient clustering
We sought to stratify patients in clusters in which patients within one cluster would be more similar (cohesion) than patients in the others (separation). We applied a two-step hierarchical unsupervised clustering method to a dataset consisting of the 30 individual PANSS scores of the 325 patients in the OPTiMiSE study sample, therefore resulting in four clusters: C1A and C1B, and C2A and C2B. We compared two methods for data
Table 1 Patient clinical characteristics
Study sample as a whole Patient subsets
All Non-remitters Remitters C1A C1B C2A C2B
Number of patients 325 102 223 97 62 95 71 Male (%) 70.2% 73.5% 68.6% 63.9% 83.9% 63.4% 75.3% Age (years) 26.2 ± 6.2 25.0 ± 5.6 28.8 ± 6.4 25.9 ± 5.9 25.6 ± 5.6 27.0 ± 7.0 26.2 ± 6.0 BMI (kg/m2) 23.3 ± 4.2 23.5 ± 4.5 23.2 ± 4.1 23.3 ± 4.0 23.8 ± 3.8 23.2 ± 4.5 23.0 ± 4.5 Waist circumference (cm) 83.2 ± 11.8 84.6 ± 11.6 82.6 ± 11.9 83.2 ± 11.8 85.2 ± 11.6 82.3 ± 12.2 82.8 ± 10.3 PPANSS 19.8 ± 5.7 21.4 ± 5.4 19.1 ± 7.7 24.6 ± 4.1 17.2 ± 4.3 21.3 ± 4.1 14.0 ± 3.3 NPANSS 19.6 ± 7.1 22.5 ± 7.2 18.3 ± 6.7 25.7 ± 5.0 24.9 ± 3.9 14.5 ± 4.0 13.5 ± 4.0 GPANSS 38.2 ± 9.8 40.6 ± 8.8 37.0 ± 10.0 47.8 ± 6.8 37.5 ± 7.0 36.9 ± 6.3 27.6 ± 5.9 PANSS total 77.6 ± 19.0 84.5 ± 16.7 74.4 ± 19.6 98.1 ± 12.6 79.7 ± 9.8 72.6 ± 9.8 55.0 ± 9.6 CDSS 13.2 ± 4.8 13.2 ± 5.0 13.2 ± 4.7 14.1 ± 5.5 13.0 ± 4.8 13.7 ± 4.7 11.6 ± 3.3 PSP 48.9 ± 15.2 45.5 ± 15.6 50.5 ± 14.8 45.0 ± 13.2 44.9 ± 15.3 47.6 ± 14.1 59.2 ± 14.4
Recreational drug use 48.9% 48.0% 49.3% 39.2% 38.7% 53.8% 64.4%
Seropositivity to T. gondii 23.7% 30.2% 20.8% 30.9% 23.7% 17.4% 22.4%
Seropositivity to CMV 56.1% 56.3% 56.0% 60.6% 45.8% 60.9% 52.2%
Seropositivity to HSV-1 58.0% 56.3% 58.8% 63.8% 44.1% 64.1% 53.7%
Remitters 68.60% 0.00% 100.00% 57.70% 54.80% 61.30% 90.40%
The total number of patients, proportion of males, age (mean ± SEM), BMI (mean ± SEM), waist circumference (mean ± SEM) and clinical scores (mean ± SEM) before treatment are indicated in the study sample as a whole (all patients, non-remitters and remitters), and in the indicated subtypes. The proportion (%) of patients reporting recreational drug use, test seropositive for the indicated pathogens, or identified as remitters after 4 weeks of treatment with amisulpride are also indicated BMI bone marrow index, PANSS Positive and Negative Syndrome Scale, PPANSS positive PANSS, NPANSS negative PANSS, GPANSS general psychopathology PANSS, CDSS Calgary Depression Scale for Schizophrenia, PSP Personal and Social Performance Scale, CMV cytomegalovirus, HSV-1 herpes simplex virus type 1
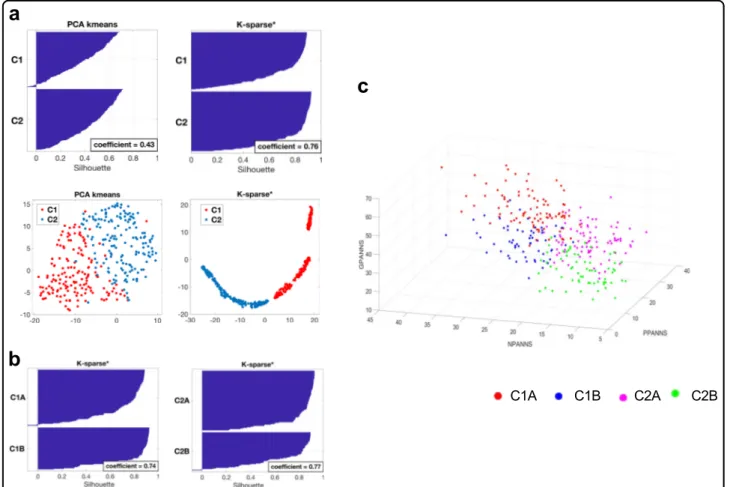
clustering: principal component analysis (PCA)-K-means42that is a popular method for cluster analysis, and K-sparse* that is a modified version of K-sparse38. While both methods were successful at stratifying the 325 patients of the OPTiMiSE study sample, K-sparse* out-performed PCA-K-means as demonstrated by both a higher mean silhouette value (0.76 compared to 0.43) and t-distributed stochastic neighbor embedding (t-SNE) graphical representations (Fig.1a). We therefore selected K-sparse* for data clustering. First-level classification using K-sparse* identified two subtypes: C1 (n = 159) and C2 (n= 166). K-sparse* selected nine items that dis-criminated C1 and C2 patients, among which five belonged to the negative PANSS sub-scale (NPANSS) and four to the general psychopathology PANSS sub-scale (GPANSS) (Supplementary Table 3). Second-level classi-fication identified four subtypes: C1A (n = 97) and C1B (n= 62) on one hand, and C2A (n = 95) and C2B (n = 71) on the other. K-sparse* selected eight PANSS items for
discriminating C1A from C1B patients, among which four belonged to the positive PANSS (PPANSS) sub-scale and four to the GPANSS sub-scale (Supplementary Table 3). K-sparse* selected seven PANSS items for discriminating C2A from C2B patients, among which three belonged to the PPANSS sub-scale and four to the GPANSS sub-scale (Supplementary Table 3). In agreement with the nature and the weight of the PANSS items selected by K-sparse*, C1A and C1B patients exhibited more severe negative and general psychopathology symptoms compared to C2A and C2B patients respectively (Table 1). C1A and C2A patients exhibited more prominent positive and general psychopathology symptoms compared to C1B and C2B patients respectively (Table 1). Compared to other patients from the study sample, those from the C1A subtype exhibited more severe symptoms in the positive, negative and general psychopathology dimensions (Table
2, Fig. 1c). C1A patients also exhibited higher clinical scores as measured by the CGI and the CDSS and showed
Fig. 1 Clinical characteristics of patient subtypes. a First-level stratification. Silhouettes and t-distributed stochastic neighbor embedding (t-SNE) representations of patient clustering using principal component analysis (PCA)-K-means (left panels) and K-sparse* (right panels). Silhouette values could range from−1 to +1, with high values reflecting higher similarity within cluster. Mean silhouette values (coefficient) are indicated. b Second-level stratification. Silhouettes of C1 (left) and C2 (right) patient clustering using K-sparse*. Mean silhouette values (coefficient) are indicated. c Three-dimensional (3D) scatter plot representation of positive PANSS (PPANSS), negative PANSS (NPANSS) and general psychopathology PANSS (GPANSS) sub-scores of C1A, C1B, C2A and C2B patients. PANSS Positive and Negative Syndrome Scale
the worst psychosocial performance/functioning as mea-sured by PSP scale (Table 2 ). In contrast, C2B patients exhibited less severe symptoms in the positive, negative and general psychopathology dimensions, exhibited lower CGI and CDSS scores and showed the best psychosocial performance/functioning as measured by the PSP scale (Table 2 , Fig. 1 c). In summary, applying a two-step hierarchical unsu-pervised classi fi cation method to FEP patients identi fi ed four patient subtypes characterized by different symptom pro fi les. C1A patients exhibited the most severe symp-toms in all dimensions, and 57.70% of them were remit-ters after 4-week treatment with amisulpride, compared to 68.6% in the study sample as a whole (Table 1 ). In contrast, C2B patients exhibited less severe symptoms, and 90.4% of them were remitters after 4 weeks of treat-ment (Table 1 ). Validation of the clustering solution The complexity of deriving clustering solutions makes validation crucial not only to ensure reproducibility but also to con fi rm that the derived clusters index clinically meaningful variations 43 , 44 .W e fi rst sought to validate our clustering solution using cross-validation, i.e., by fi rst splitting data in a training and a test sample, and then assigning each patient of the test sample to one of the clusters derived from the training sample. Results from 50 independent random drawings showed that our clustering solution was robust with 86.8% to 95.5% of the patients (depending of the cluster) in the test sample being cor-rectly classi fi ed (Supplementary Table 4). As an alternative and complementary approach, we sought to validate our clustering solution on external biological measures, i.e., to investigate whether reducing clinical heterogeneity also reduces biological hetero-geneity 45 – 47 . T o this aim, we searched for serum bio-markers that were present at different levels between clusters. Univariate analysis did not identify serum pro-teins that distinguished C1B or C2A patients from the others. In contrast, C1A patients exhibited statistically higher levels of IL-7, IL-15, IL-17, IFN-γ , TNF-α , sICAM-1 and sVCAM-1 after correction for multiple test (Table 3 ). The probability that seven biomarkers or more would have been expressed at statistically higher levels in 97 randomly selected patients (to match the number of C1A patients) compared to the others was 5.47 × 1 0 − 6 as esti-mated by 10,000 successive random drawings (Supple-mentary Table 5). We also found that C2B patients exhibited lower levels of CXCL12 and higher levels of IL-8. Effect sizes were small to medium (0.5 > Cohen ’s d coef fi cient > 0.2) for IFN-γ , IL-7, IL-17, TNF-α , sICAM-1, CXCL12 and sVCAM-1, and medium to high (1.0 > Cohen ’s d coef fi cient > 0.5) for both IL-15 and IL-8. Because the K-sparse* clustering approach that we have
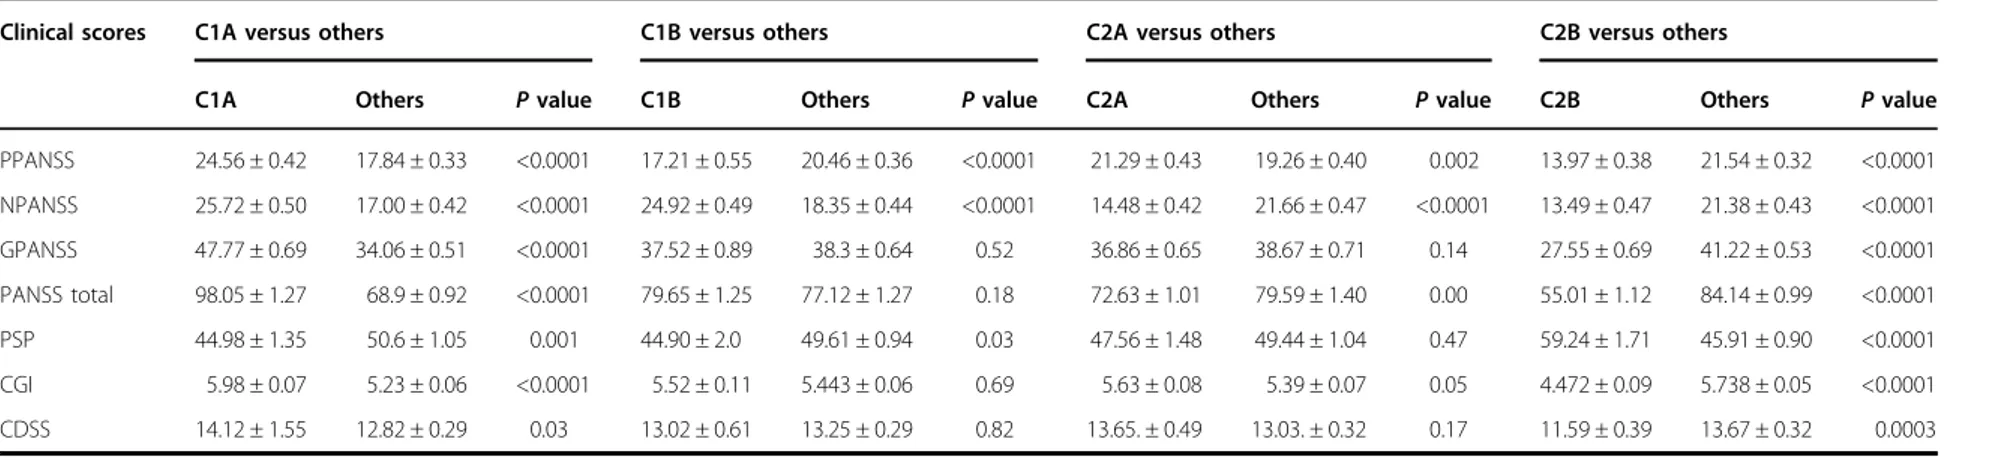
Table 2 Clinical score comparisons between individual patient subtypes
Clinical scores C1A versus others C1B versus others C2A versus others C2B versus others
C1A Others P value C1B Others P value C2A Others P value C2B Others P value
PPANSS 24.56 ± 0.42 17.84 ± 0.33 <0.0001 17.21 ± 0.55 20.46 ± 0.36 <0.0001 21.29 ± 0.43 19.26 ± 0.40 0.002 13.97 ± 0.38 21.54 ± 0.32 <0.0001 NPANSS 25.72 ± 0.50 17.00 ± 0.42 <0.0001 24.92 ± 0.49 18.35 ± 0.44 <0.0001 14.48 ± 0.42 21.66 ± 0.47 <0.0001 13.49 ± 0.47 21.38 ± 0.43 <0.0001 GPANSS 47.77 ± 0.69 34.06 ± 0.51 <0.0001 37.52 ± 0.89 38.3 ± 0.64 0.52 36.86 ± 0.65 38.67 ± 0.71 0.14 27.55 ± 0.69 41.22 ± 0.53 <0.0001 PANSS total 98.05 ± 1.27 68.9 ± 0.92 <0.0001 79.65 ± 1.25 77.12 ± 1.27 0.18 72.63 ± 1.01 79.59 ± 1.40 0.00 55.01 ± 1.12 84.14 ± 0.99 <0.0001 PSP 44.98 ± 1.35 50.6 ± 1.05 0.001 44.90 ± 2.0 49.61 ± 0.94 0.03 47.56 ± 1.48 49.44 ± 1.04 0.47 59.24 ± 1.71 45.91 ± 0.90 <0.0001 CGI 5.98 ± 0.07 5.23 ± 0.06 <0.0001 5.52 ± 0.11 5.443 ± 0.06 0.69 5.63 ± 0.08 5.39 ± 0.07 0.05 4.472 ± 0.09 5.738 ± 0.05 <0.0001 CDSS 14.12 ± 1.55 12.82 ± 0.29 0.03 13.02 ± 0.61 13.25 ± 0.29 0.82 13.65. ± 0.49 13.03. ± 0.32 0.17 11.59 ± 0.39 13.67 ± 0.32 0.0003
Data show clinical scores (mean ± SEM) of the indicated patients before treatment as well as the statistical significance of the observed differences measured by the p value
PANSS Positive and Negative Syndrome Scale, PPANSS positive PANSS, NPANSS negative PANSS, GPANSS general psychopathology PANSS, CDSS Calgary Depression Scale for Schizophrenia, PSP Personal and Social Performance Scale,CGI Clinical Global Impression
Martinuzzi et al. Translational Psychiatry (2019) 9:20 Page 6 o f 1 3
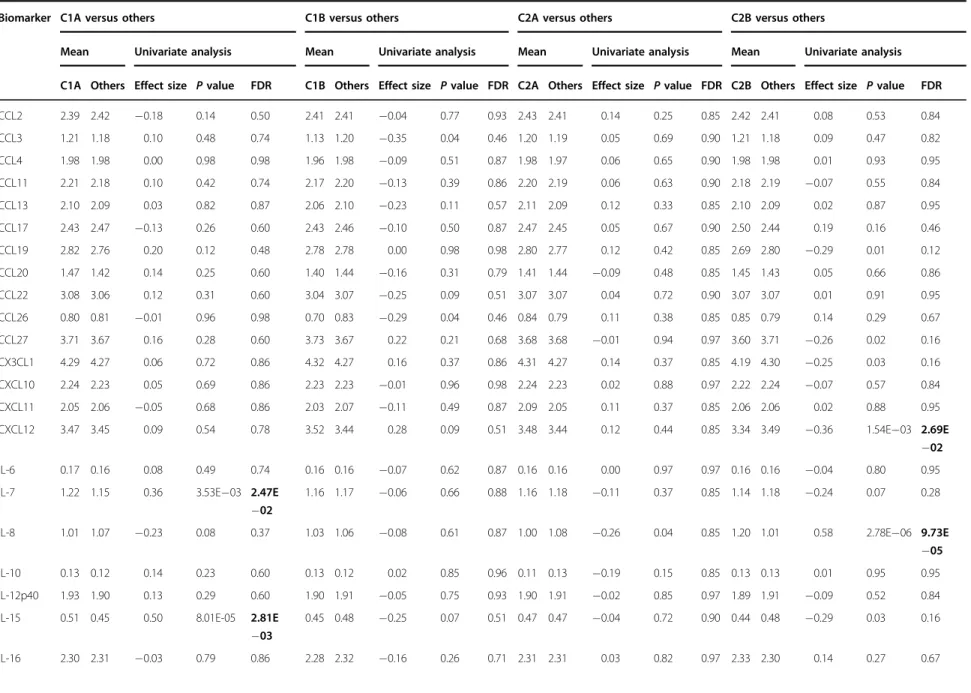
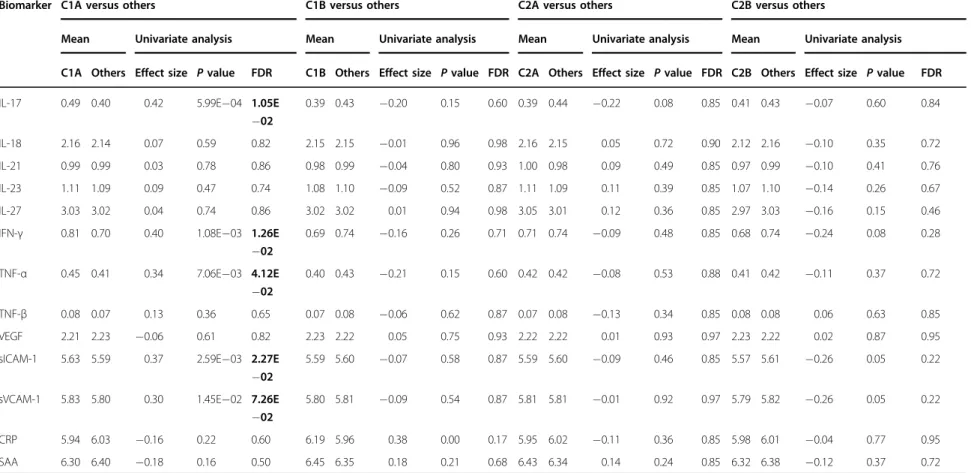
Table 3 Differences in serum biomarker levels between patient subtypes
Biomarker C1A versus others C1B versus others C2A versus others C2B versus others
Mean Univariate analysis Mean Univariate analysis Mean Univariate analysis Mean Univariate analysis
C1A Others Effect size P value FDR C1B Others Effect size P value FDR C2A Others Effect size P value FDR C2B Others Effect size P value FDR
CCL2 2.39 2.42 −0.18 0.14 0.50 2.41 2.41 −0.04 0.77 0.93 2.43 2.41 0.14 0.25 0.85 2.42 2.41 0.08 0.53 0.84 CCL3 1.21 1.18 0.10 0.48 0.74 1.13 1.20 −0.35 0.04 0.46 1.20 1.19 0.05 0.69 0.90 1.21 1.18 0.09 0.47 0.82 CCL4 1.98 1.98 0.00 0.98 0.98 1.96 1.98 −0.09 0.51 0.87 1.98 1.97 0.06 0.65 0.90 1.98 1.98 0.01 0.93 0.95 CCL11 2.21 2.18 0.10 0.42 0.74 2.17 2.20 −0.13 0.39 0.86 2.20 2.19 0.06 0.63 0.90 2.18 2.19 −0.07 0.55 0.84 CCL13 2.10 2.09 0.03 0.82 0.87 2.06 2.10 −0.23 0.11 0.57 2.11 2.09 0.12 0.33 0.85 2.10 2.09 0.02 0.87 0.95 CCL17 2.43 2.47 −0.13 0.26 0.60 2.43 2.46 −0.10 0.50 0.87 2.47 2.45 0.05 0.67 0.90 2.50 2.44 0.19 0.16 0.46 CCL19 2.82 2.76 0.20 0.12 0.48 2.78 2.78 0.00 0.98 0.98 2.80 2.77 0.12 0.42 0.85 2.69 2.80 −0.29 0.01 0.12 CCL20 1.47 1.42 0.14 0.25 0.60 1.40 1.44 −0.16 0.31 0.79 1.41 1.44 −0.09 0.48 0.85 1.45 1.43 0.05 0.66 0.86 CCL22 3.08 3.06 0.12 0.31 0.60 3.04 3.07 −0.25 0.09 0.51 3.07 3.07 0.04 0.72 0.90 3.07 3.07 0.01 0.91 0.95 CCL26 0.80 0.81 −0.01 0.96 0.98 0.70 0.83 −0.29 0.04 0.46 0.84 0.79 0.11 0.38 0.85 0.85 0.79 0.14 0.29 0.67 CCL27 3.71 3.67 0.16 0.28 0.60 3.73 3.67 0.22 0.21 0.68 3.68 3.68 −0.01 0.94 0.97 3.60 3.71 −0.26 0.02 0.16 CX3CL1 4.29 4.27 0.06 0.72 0.86 4.32 4.27 0.16 0.37 0.86 4.31 4.27 0.14 0.37 0.85 4.19 4.30 −0.25 0.03 0.16 CXCL10 2.24 2.23 0.05 0.69 0.86 2.23 2.23 −0.01 0.96 0.98 2.24 2.23 0.02 0.88 0.97 2.22 2.24 −0.07 0.57 0.84 CXCL11 2.05 2.06 −0.05 0.68 0.86 2.03 2.07 −0.11 0.49 0.87 2.09 2.05 0.11 0.37 0.85 2.06 2.06 0.02 0.88 0.95 CXCL12 3.47 3.45 0.09 0.54 0.78 3.52 3.44 0.28 0.09 0.51 3.48 3.44 0.12 0.44 0.85 3.34 3.49 −0.36 1.54E−03 2.69E −02 IL-6 0.17 0.16 0.08 0.49 0.74 0.16 0.16 −0.07 0.62 0.87 0.16 0.16 0.00 0.97 0.97 0.16 0.16 −0.04 0.80 0.95
IL-7 1.22 1.15 0.36 3.53E−03 2.47E
−02
1.16 1.17 −0.06 0.66 0.88 1.16 1.18 −0.11 0.37 0.85 1.14 1.18 −0.24 0.07 0.28
IL-8 1.01 1.07 −0.23 0.08 0.37 1.03 1.06 −0.08 0.61 0.87 1.00 1.08 −0.26 0.04 0.85 1.20 1.01 0.58 2.78E−06 9.73E
−05
IL-10 0.13 0.12 0.14 0.23 0.60 0.13 0.12 0.02 0.85 0.96 0.11 0.13 −0.19 0.15 0.85 0.13 0.13 0.01 0.95 0.95
IL-12p40 1.93 1.90 0.13 0.29 0.60 1.90 1.91 −0.05 0.75 0.93 1.90 1.91 −0.02 0.85 0.97 1.89 1.91 −0.09 0.52 0.84
IL-15 0.51 0.45 0.50 8.01E-05 2.81E
−03 0.45 0.48 −0.25 0.07 0.51 0.47 0.47 −0.04 0.72 0.90 0.44 0.48 −0.29 0.03 0.16 IL-16 2.30 2.31 −0.03 0.79 0.86 2.28 2.32 −0.16 0.26 0.71 2.31 2.31 0.03 0.82 0.97 2.33 2.30 0.14 0.27 0.67 Martinuzzi et al. Translational Psychiatry (2019) 9:20 Page 7 o f 1 3
Table 3 continued
Biomarker C1A versus others C1B versus others C2A versus others C2B versus others
Mean Univariate analysis Mean Univariate analysis Mean Univariate analysis Mean Univariate analysis
C1A Others Effect size P value FDR C1B Others Effect size P value FDR C2A Others Effect size P value FDR C2B Others Effect size P value FDR
IL-17 0.49 0.40 0.42 5.99E−04 1.05E
−02 0.39 0.43 −0.20 0.15 0.60 0.39 0.44 −0.22 0.08 0.85 0.41 0.43 −0.07 0.60 0.84 IL-18 2.16 2.14 0.07 0.59 0.82 2.15 2.15 −0.01 0.96 0.98 2.16 2.15 0.05 0.72 0.90 2.12 2.16 −0.10 0.35 0.72 IL-21 0.99 0.99 0.03 0.78 0.86 0.98 0.99 −0.04 0.80 0.93 1.00 0.98 0.09 0.49 0.85 0.97 0.99 −0.10 0.41 0.76 IL-23 1.11 1.09 0.09 0.47 0.74 1.08 1.10 −0.09 0.52 0.87 1.11 1.09 0.11 0.39 0.85 1.07 1.10 −0.14 0.26 0.67 IL-27 3.03 3.02 0.04 0.74 0.86 3.02 3.02 0.01 0.94 0.98 3.05 3.01 0.12 0.36 0.85 2.97 3.03 −0.16 0.15 0.46
IFN-γ 0.81 0.70 0.40 1.08E−03 1.26E
−02 0.69 0.74 −0.16 0.26 0.71 0.71 0.74 −0.09 0.48 0.85 0.68 0.74 −0.24 0.08 0.28 TNF-α 0.45 0.41 0.34 7.06E−03 4.12E −02 0.40 0.43 −0.21 0.15 0.60 0.42 0.42 −0.08 0.53 0.88 0.41 0.42 −0.11 0.37 0.72 TNF-β 0.08 0.07 0.13 0.36 0.65 0.07 0.08 −0.06 0.62 0.87 0.07 0.08 −0.13 0.34 0.85 0.08 0.08 0.06 0.63 0.85 VEGF 2.21 2.23 −0.06 0.61 0.82 2.23 2.22 0.05 0.75 0.93 2.22 2.22 0.01 0.93 0.97 2.23 2.22 0.02 0.87 0.95
sICAM-1 5.63 5.59 0.37 2.59E−03 2.27E
−02
5.59 5.60 −0.07 0.58 0.87 5.59 5.60 −0.09 0.46 0.85 5.57 5.61 −0.26 0.05 0.22
sVCAM-1 5.83 5.80 0.30 1.45E−02 7.26E
−02
5.80 5.81 −0.09 0.54 0.87 5.81 5.81 −0.01 0.92 0.97 5.79 5.82 −0.26 0.05 0.22
CRP 5.94 6.03 −0.16 0.22 0.60 6.19 5.96 0.38 0.00 0.17 5.95 6.02 −0.11 0.36 0.85 5.98 6.01 −0.04 0.77 0.95
SAA 6.30 6.40 −0.18 0.16 0.50 6.45 6.35 0.18 0.21 0.68 6.43 6.34 0.14 0.24 0.85 6.32 6.38 −0.12 0.37 0.72
Data show mean serum protein levels (log) in the indicated patient subtypes. Effect sizes,p values and FDRs are indicated for each comparison. FDR < 0.1 are given in bold values
FDR false discovery rate, IL interleukin, TNF tumor necrosis factor, VEGF vascular endothelial growth factor, CRP C reactive protein, SAA serum amyloid A protein, sICAM-1 soluble intercellular adhesion molecule 1, sVCAM-1 soluble vascular adhesion molecule 1
Martinuzzi et al. Translational Psychiatry (2019) 9:20 Page 8 o f 1 3
used to define C1A, C1B, C2A and C2B subtypes was based on clinical features only, the fact that several per-ipheral biomarkers distinguished at least two patient subtypes from the others validated our clustering approach on external biological measures48.
Predicting remission in individual patient subtypes
As an attempt to identify serum biomarkers associated with remission in individual patient subtypes, we applied regularized logistic regression to clinical and biological data from C1A, C1B, C2A and C2B patients. None of the analyzed variables was associated with remission in C1B, C2A and C2B patients (not shown). In striking contrast, lower serum levels of IL-15, higher serum levels of CXCL12, seropositivity to CMV, use of recreational drugs and being younger were all associated with increased odds of being non-remitters in C1A patients (Table4, model 1). Among thesefive variables, IL-15 was selected in 99.6% of the training/test runs and had a p value < 0.001. To esti-mate the predictive value of thesefive combined variables, we applied a regularized logistic regression to these five variables only (Table 4, model 2). All variables were selected more than 95% of the time and exhibited p values < 0.1. The predictive value of this model, assessed by the ROC curve was 73 ± 0.10%, and its specificity and selectivity were 45 ± 0.09% and 83 ± 0.03%, respectively.
Discussion
Heterogeneity of patients with mental disorders may impede identification of adequate predictors of remis-sion43. In keeping with this hypothesis, we have failed to identify serum biomarkers associated with remission in non-stratified FEP patients. To overcome this problem, we used a hierarchical clustering approach to identify subtypes of patients based on their clinical symptoms. Several unsupervised clustering methods have been used to stratify patients with mental disorders based on clinical symptoms and case history variables49–53 or social cog-nitive measures54. Given a set of data points, clustering methods aim to partition data into a specified number (k) of clusters, such that the samples in each cluster are more similar to one another than to those in the other clusters. This entails defining a measure of similarity or distance between data points. As recently pointed out43, the out-come of clustering is highly dependent on the input data with relatively little convergence towards a coherent and consistent set of subtypes. Unfortunately, the biological relevance of the few subtypes identified so far was gen-erally limited and did not clearly reflect underlying bio-logical mechanisms. Here, we have used a two-step hierarchical unsupervised clustering method to stratify FEP patients into four subtypes, termed C1A, C1B, C2A and C2B, based on their clinical symptoms. C1A patients were characterized by the most severe symptoms in the
positive, negative and general physiopathology dimen-sions. In contrast, C2B patients were the least severely affected. Most importantly, C1A and C2B patients did not only differ from other patients in terms of symptoms severity but also exhibited specific peripheral immune signatures suggesting that these subtypes reflected distinct pathophysiological entities45,55. Our study therefore pro-vides the proof of concept that clustering methods aimed at reducing clinical heterogeneity may also reduce biolo-gical heterogeneity.
Several authors in the field have tried to stratify psy-chosis spectrum patients on the basis of symptoms. In a pioneer study, Dollfus et al.51 have used the Ward’s method of hierarchical clustering to identify four subtypes of schizophrenia patients that they called “positive”, “negative”, “mixed” and “disorganized”. These four sub-types are very similar to the four subsets that we describe here, with our C1B, C2A, C1A and C2B subsets being very similar to Dollfus’ “positive”, “negative”, “mixed” and “disorganized” subtypes, respectively.
In contrast to the current”one size fits all” or ”trial and error” approach in healthcare, stratified medicine aims at sorting a population into biologically relevant subtypes. We found that the vast majority (90.4%) of C2B patients were remitters after treatment. This agrees with previous studies which have shown that patients with less severe negative symptoms are more likely to be remitters than others9. In contrast, the proportion of remitters among C1A, C1B and C2B patients ranged between 54.8% and 61.3%. Thus, the clustering solution that we describe here constitutes a first step towards stratified medicine for psychotic patients.
In support of a critical role of inflammation in psy-chiatric diseases, add-on treatments with anti-inflammatory drugs have been tested in severe and treatment-resistant psychiatric patients56–64. For example, acetyl salicylic acid (Aspirin) which interrupts the immuno-inflammatory cascade by inhibiting cycloox-ygenase (COX)-1 and COX-2 showed promising results as an add-on treatment of schizophrenia in comparison to treatment as usual60,63. In most cases however, add-on anti-inflammatory treatments in psychotic patients only provided modest improvements in clinical outcome. This could be explained if only a subtype of the treated patients exhibited a pro-inflammatory profile at baseline. In agreement with this latter hypothesis, an add-on trial in patients with psychotic disorders showed that those with increased CRP levels had the largest response to add-on Aspirin as compared to those with lower levels65. Com-pared to others, C1A patients exhibited higher levels of IL-7, IL-15, IL-1IL-7, IFN-γ, TNF-α, sICAM-1 and sVCAM-1. Therefore, a reasonable and testable hypothesis is that C1A patients would be those that could benefit the most from add-on anti-inflammatory treatment. On another
Table 4 Clinical and biological variables associated with non-remission in C1A patients
Variable Model 1 Model 2
Proportion of selection
Weighted mean odds
ratio ± SD P value
Proportion of selection
Weighted mean odds
ratio ± SD P value
Sex (being male) 0.315 1.156 ± 0.013 0.572
Age 0.677 0.817 ± 0.008 0.099 0.953 0.804 ± 0.006 0.095
BMI 0.312 1.077 ± 0.004 0.654
Waist circumference 0.341 1.068 ± 0.002 0.518
Recreational drug use 0.774 1.240 ± 0.019 0.070 0.967 1.393 ± 0.016 0.048
Seropositivity to HSV-1 0.225 1.130 ± 0.012 0.757 Seropositivity to CMV 0.702 1.283 ± 0.021 0.093 0.963 1.490 ± 0.028 0.012 Seropositivity to Toxoplasma 0.710 1.266 ± 0.025 0.119 CCL2 0.168 1.029 ± 0.001 0.693 CCL3 0.325 0.912 ± 0.004 0.690 CCL4 0.162 1.012 ± 0.001 0.764 CCL11 0.244 1.057 ± 0.003 0.643 CCL13 0.148 1.036 ± 0.004 0.684 CCL17 0.179 1.024 ± 0.009 0.517 CCL19 0.359 0.976 ± 0.006 0.640 CCL20 0.236 0.982 ± 0.001 0.763 CCL22 0.151 0.971 ± 0.004 0.668 CCL26 0.564 1.163 ± 0.010 0.291 CCL27 0.154 1.048 ± 0.002 0.626 CX3CL1 0.168 0.962 ± 0.002 0.784 CXCL10 0.155 1.031 ± 0.004 0.754 CXCL11 0.321 0.937 ± 0.002 0.634 CXCL12 0.715 1.240 ± 0.019 0.077 0.964 1.369 ± 0.012 0.020 IL-6 0.416 0.913 ± 0.002 0.656 IL-7 0.183 0.950 ± 0.002 0.803 IL-8 0.483 1.148 ± 0.010 0.528 IL-10 0.372 1.093 ± 0.004 0.743 IL-12p40 0.281 0.947 ± 0.002 0.591 IL-13 0.284 0.953 ± 0.001 0.717
IL-15 0.996 0.756 ± 0.009 5.00E−04 1.000 0.585 ± 0.005 4.00E
−04 IL-16 0.288 0.933 ± 0.002 0.711 IL-17 0.405 0.941 ± 0.002 0.520 IL-18 0.18 1.000 ± 0.003 0.640 IL-21 0.211 0.962 ± 0.002 0.812 IL-23 0.256 0.957 ± 0.002 0.709 IL-27 0.238 1.067 ± 0.004 0.796 IFN-γ 0.21 0.954 ± 0.002 0.689 TNF-α 0.553 1.226 ± 0.016 0.240 TNF-β 0.32 0.946 ± 0.001 0.664 VEGF 0.134 1.025 ± 0.002 0.596 sICAM-1 0.266 0.924 ± 0.003 0.669 sVCAM-1 0.474 0.897 ± 0.003 0.388 CRP 0.67 0.841 ± 0.005 0.186 SAA 0.088 0.973 ± 0.000 0.233
Data show the variables that were included in regularized regression logistic models. All variables listed in the left column were included in model 1. Recreational drug use, seropositivity to CMV, IL-15, CXCL12 and age were included in model 2. For each variable, the proportion of drawings (out of 2000) in which the variable was selected is indicated, as well as the weighted mean odds ratio (ORs) ± SD. Thep values were computed adjusting a single elastic net model with the mean α and mean λ as hyper-parameters. In model 1, mean α and mean λ hyper-parameters were 0.37 ± 0.29 and 0.26 ± 0.28 respectively. Mean area under the curve (AUC) was 0.62 ± 0.09 with minimal and maximal values of 0.42 and 0.82 respectively. In Model 2, meanα and mean λ hyper-parameters were 0.11 ± 0.07 and 0.13 ± 0.13 respectively. Mean AUC was 0.73 ± 0.1 with minimal and maximal values of 0.36 and 0.95 respectively. Thep values < 0.1 are given in bold values
BMI bone marrow index, CMV cytomegalovirus, HSV-1 herpes simplex virus type 1, IL interleukin, TNF tumor necrosis factor, VEGF vascular endothelial growth factor, CRP C reactive protein, SAA serum amyloid A protein, sICAM-1 soluble intercellular adhesion molecule 1, sVCAM-1 soluble vascular adhesion molecule 1
topic, several authors have proposed that inflammation was associated with poor clinical outcome in psychosis66–
69
. In agreement with these studies, C1A patients were both characterized by higher levels of several inflammatory biomarkers and a lower proportion of non-remitters (57.7% compared to 68.6% in the study sample as a whole, and 90.4 % in the C2B subtype).
Compared to stratified medicine, personalized medicine builds on a finer sub-classification of patients to enable individual tailoring of treatment to maximize response. Bearing this in mind, we have used regularized logistic regression to select variables that could predict remission in individual patient subtypes. In C1A patients but not in others, lower levels of IL-15, higher levels of CXCL12, recreational drug use, being seropositive to CMV and being younger were all associated with increased odds of being non-remitters after adjustment for covariates sus-pected to impact cytokine levels or response to treatment. While IL-15 is mainly known for its role in regulating natural killer and T cells70,71, it is also produced by
astrocytes and neural progenitors72,73, regulates neuro-genesis and exerts anti-depressive effects in mice74,75. Likewise, while CXCL12 was first described as a chemo-tactic factor for lymphocytes and macrophages, it is also secreted by glial cells and neurons and plays a role in brain plasticity and function76. One of the two CXCL12 receptors, CXCR4, acts at both the synaptic and post-synaptic levels by promoting the release of glutamate and γ-aminobutyric acid (GABA) and by activating the voltage-gated K channel Kv2.1, respectively. Whether and how IL-15 and CXCL12 impact response to anti-psychotics remains to be elucidated.
In addition to lower levels of IL-15 and higher levels of CXCL12, being seropositive to CMV and the use of recreational drugs were both associated with an increased risk of being non-remitters in C1A patients. Previous studies have identified CMV infection77 and use of recreational drugs78as risk factors for schizophrenia. Why these two variables are also associated with an increased risk of being non-remitters in C1A patients is unclear.
Our results, if replicated, could pave the way for the development of a blood-based assisted clinical decision support system for selecting the most appropriate treat-ment in psychotic patients.
Acknowledgements
We thank all the patients who participated in the OPTiMiSE study. The OPTiMiSE study was funded by the European Commission within the 7th Program (HEALTH-F2- 2010-242114). This work was also supported by the Investissements d’Avenir program managed by the Agence Nationale pour la Recherche (ANR) under reference ANR-11-IDEX-0004-02 (Labex BioPsy) (to W.B. H.A.). Additionalfinancial supports were obtained from the Fondation de France (to N.G.) and the Fondation FondaMental (to N.G.). Additional supports were obtained by the LABEX SIGNALIFE (#ANR-11-LABX-0028-01) and the FHU OncoAge. The Leboyer’s team is affiliated with the Paris School of Neuroscience (ENP) and the BioPsy Laboratory of Excellence. Members of the OPTiMiSE study group are R.S. Kahn, I. Winter van Rossum, S. Leucht, P.
McGuire, S.W. Lewis, M. Leboyer, C. Arango, P. Dazzan, R. Drake, S. Heres, C. M. Diaz- Caneja, D. Rujescu, M. Weiser, S. Galderisi, B. Glenthoj, M.J.C. Eijkemans, W. W. Fleischhacker, S. Kapur, and I.E. Sommer.
Code availability
The code for K-sparse* unsupervised classification will be made available upon request.
Author details
1
Université Côte d’Azur, Centre National de la Recherche Scientifique, Institut de Pharmacologie Moléculaire et Cellulaire, Valbonne, France.2Université Paris
Est Créteil, Faculté de Medicine Institut, National de la Santé et de la Recherche Médicale, Créteil, France.3Université Côte d’Azur, Centre National de la
Recherche Scientifique, Laboratoire Informatique Signaux et Systèmes de Sophia Antipolis, Sophia Antipolis, France.4Assistance Publique Hôpitaux de
Marseille, Marseille, France.5Department of Neuroscience and Department of
Psychiatry, University Medical Center Groningen, Rijks Universiteit Groningen, Groningen, The Netherlands.6Department of Medical and Biological
Psychology, University of Bergen, Bergen, Norway.7Department of Psychiatry and Psychotherapy, Technische Universität München, München, Germany.
8
Department of Psychosis Studies, Institute of Psychiatry, National Institute for Health Research, Mental Health Biomedical Research Centre, King’s College London, London, UK.9Child and Adolescent Psychiatry Department, Hospital General Universitario Gregorio Marañón, Universidad Complutense, Madrid, Spain.10Department of Psychiatry, Psychotherapy and Psychosomatic
Medicine, Medical University Innsbruck, Innsbruck, Austria.11Department of
Psychiatry, University of Halle, Halle, Germany.12Faculty of Health and Medical
Sciences, Center for Neuropsychiatric Schizophrenia Research and Center for Clinical Intervention and Neuropsychiatric Schizophrenia Research, Psychiatric Hospital Center Glostrup, University of Copenhagen, Copenhagen, Denmark.
13Department of Psychiatry, Brain Center Rudolf Magnus, UMC Utrecht,
Utrecht, The Netherlands.14John Hopkins School of Medicine, The John Hopkins Hospital, Baltimore, USA.15Division of Psychology and Mental Health,
School of Health Sciences, Faculty of Biology, Medicine and Health, Manchester Academic. Health Sciences Centre (MAHSC), University of Manchester, Manchester, UK.16Assistance Publique Hôpitaux de Paris, Pole de
Psychiatrie et Addictologie, Hopitaux Universitaires Henri Mondor, Créteil, France.17Fondation Fondamental, Hôpital Albert Chenevier Pôle de
Psychiatrie, Créteil, France Conflict of interest
The authors declare that they have no conflict of interest.
Publisher’s note
Springer Nature remains neutral with regard to jurisdictional claims in published maps and institutional affiliations.
Supplementary Information accompanies this paper at (https://doi.org/ 10.1038/s41398-018-0366-5).
Received: 27 November 2018 Accepted: 10 December 2018
References
1. American Psychiatric Association. Diagnostic and Statistical Manual of Mental Disorders (DSM-5®), 5th edn (American Psychiatric Publishing, Arlington, 2013). 2. Kane, J., Leucht, S., Carpenter, D. & Docherty, J., Disorders, E.C.P.f.O.P.T.o.P. The expert consensus guideline series. Optimizing pharmacologic treatment of psychotic disorders. Introduction: methods, commentary, and summary. J. Clin. Psychiatry 64 (Suppl 12), 5–19 (2003).
3. Leucht, S., Arbter, D., Engel, R. R., Kissling, W. & Davis, J. M. How effective are second-generation antipsychotic drugs? A meta-analysis of placebo-controlled trials. Mol. Psychiatry 14, 429–447 (2009).
4. Lieberman, J. A., Dixon, L. B. & Goldman, H. H. Early detection and intervention in schizophrenia: a new therapeutic model. JAMA 310, 689–690 (2013).
5. Dixon, L. B. & Stroup, T. S. Medications forfirst-episode psychosis: making a good start. Am. J. Psychiatry 172, 209–211 (2015).
6. Fond, G. et al. The promise of biological markers for treatment response in first- episode psychosis: a systematic review. Schizophr. Bull. 41, 559–573 (2015).
7. Leucht, S. & Kane, J. M. Measurement-based psychiatry: definitions of response, remission, stability, and relapse in schizophrenia. J. Clin. Psychiatry 67, 1813–1814 (2006).
8. Andreasen, N. C. et al. Remission in schizophrenia: proposed criteria and rationale for consensus. Am. J. Psychiatry 162, 441–449 (2005).
9. Jager, M. et al. Prediction of symptom remission in schizophrenia during inpatient treatment. World J. Biol. Psychiatry 10, 426–434 (2009).
10. Parellada, M. et al. Predictors of functional and clinical outcome in early-onset first-episode psychosis: the child and adolescent first episode of psychosis (CAFEPS) study. J. Clin. Psychiatry 76, e1441–e1448 (2015).
11. Dean, K. & Murray, R. M. Environmental risk factors for psychosis. Dialog. Clin. Neurosci. 7, 69–80 (2005).
12. Eaton, W. W. et al. Association of schizophrenia and autoimmune diseases: linkage of Danish national registers. Am. J. Psychiatry 163, 521–528 (2006). 13. Yolken, R. H. & Torrey, E. F. Are some cases of psychosis caused by microbial
agents? A review of the evidence. Mol. Psychiatry 13, 470–479 (2008). 14. Leweke, F. M. et al. Antibodies to infectious agents in individuals with recent
onset schizophrenia. Eur. Arch. Psychiatry Clin. Neurosci. 254, 4–8 (2004). 15. Niebuhr, D. W., Millikan, A. M., Yolken, R., Li, Y. & Weber, N. S. Results from a
hypothesis generating case-control study: herpes family viruses and schizo-phrenia among military personnel. Schizophr. Bull. 34, 1182–1188 (2008). 16. Potvin, S. et al. Inflammatory cytokine alterations in schizophrenia: a systematic
quantitative review. Biol. Psychiatry 63, 801–808 (2008).
17. Miller, B. J., Buckley, P., Seabolt, W., Mellor, A. & Kirkpatrick, B. Meta-analysis of cytokine alterations in schizophrenia: clinical status and antipsychotic effects. Biol. Psychiatry 70, 663–671 (2011).
18. Upthegrove, R., Manzanares-Teson, N. & Barnes, N. M. Cytokine function in medication-naive first episode psychosis: a systematic review and meta-analysis. Schizophr. Res. 155, 101–108 (2014).
19. Crespo-Facorro, B. et al. Long-term (3-year) effectiveness of haloperidol, ris-peridone and olanzapine: results of a randomized,flexible-dose, open-label comparison infirst-episode nonaffective psychosis. Psychopharmacology (Berl.) 219, 225–233 (2012).
20. Kubistova, A., Horacek, J. & Novak, T. Increased interleukin-6 and tumor necrosis factor alpha infirst episode schizophrenia patients versus healthy controls. Psychiatr. Danub. 24 (Suppl. 1), S153–S156 (2012).
21. MacDowell, K. S. et al. Risperidone normalizes increased inflammatory para-meters and restores anti-inflammatory pathways in a model of neuroin-flammation. Int. J. Neuropsychopharmacol. 16, 121–135 (2013).
22. de Witte, L. et al. Cytokine alterations infirst-episode schizophrenia patients before and after antipsychotic treatment. Schizophr. Res. 154, 23–29 (2014). 23. Ding, M. et al. Activation of Th17 cells in drug naive,first episode
schizo-phrenia. Prog. Neuropsychopharmacol. Biol. Psychiatry 51, 78–82 (2014). 24. Leucht, S. et al. The optimization of treatment and management of
schizo-phrenia in Europe (OPTiMiSE) trial: rationale for its methodology and a review of the effectiveness of switching antipsychotics. Schizophr. Bull. 41, 549–558 (2015).
25. Kahn, R. S. et al. Effectiveness of antipsychotic drugs infirst-episode schizo-phrenia and schizophreniform disorder: an open randomised clinical trial. Lancet 371, 1085–1097 (2008).
26. Guy, W. Clinical Global Impression, ECDEU Assessment Manual for Psycho-pharmacology (National Institute of Mental Health, Rockville, 1976). 27. Addington, D., Addington, J. & Schissel, B. A depression rating scale for
schi-zophrenics. Schizophr. Res. 3, 247–251 (1990).
28. Morosini, P. L., Magliano, L., Brambilla, L., Ugolini, S. & Pioli, R. Development, reliability and acceptability of a new version of the DSM-IV Social and Occupational Functioning Assessment Scale (SOFAS) to assess routine social functioning. Acta Psychiatr. Scand. 101, 323–329 (2000).
29. Buka, S. L. et al. Maternal infections and subsequent psychosis among off-spring. Arch. Gen. Psychiatry 58, 1032–1037 (2001).
30. Zou, H. & Hastie, T. Regularization and variable selection via the elastic net. J. R. Stat. Soc. B 67, 301–320 (2005).
31. Iniesta, R. et al. Combining clinical variables to optimize prediction of anti-depressant treatment outcomes. J. Psychiatr. Res. 78, 94–102 (2016). 32. Fawcett, T. An introduction to ROC analysis. Pattern Recognit. Lett. 27, 861–874
(2006).
33. R Core Team. A Language and Environment for Statistical Computing. (R Foundation for Statistical Computing:, Vienna, 2016).
34. Kuhn, M. Caret package. J. Stat. Softw. 28, 1–26 (2008).
35. Friedman, J., Hastie, T. & Tibshirani, R. Regularization paths for generalized linear models via coordinate descent. J. Stat. Softw. 33, 1–22 (2010). 36. Robin, X. et al. pROC: an open-source package for R and S+ to analyze and
compare ROC curves. BMC Bioinforma. 12, 77 (2011).
37. Candia, J. & Tsang, J. S. eNetXplorer: an R package for the quantitative exploration of elastic net families for generalized linear models (April 30, 2018). 38. Gilet, C., Deprez, M., Caillau, J.-B. & Barlaud, M. Clustering with feature selection using alternating minimization. Application to computational biology. Pub-lished 2017 in ArXiv.
39. Kahn, R. S. et al. Amisulpride and olanzapine followed by open-label treatment with clozapine infirst-episode schizophrenia and schizophreniform disorder (OPTiMiSE): a three-phase switching study. Lancet Psychiatry 5, 797–807 (2018). 40. Preece R. L., Han, S. Y. S. & Bahn, S. Proteomic approaches to identify blood-based biomarkers for depression and bipolar disorders. Expert Rev. Proteomics 15, 325–340 (2018).
41. Kay, S. R., Fiszbein, A. & Opler, L. A. The positive and negative syndrome scale (PANSS) for schizophrenia. Schizophr. Bull. 13, 261–276 (1987).
42. Iniesta, R., Stahl, D. & McGuffin, P. Machine learning, statistical learning and the future of biological research in psychiatry. Psychol. Med. 46, 2455–2465 (2016).
43. Marquand, A. F., Wolfers, T., Mennes, M., Buitelaar, J. & Beckmann, C. F. Beyond lumping and splitting: a review of computational approaches for stratifying psychiatric disorders. Biol. Psychiatry Cogn. Neurosci. Neuroimaging 1, 433–447 (2016).
44. Bzdok, D. & Meyer-Lindenberg, A. Machine learning for precision psychiatry: opportunities and challenges. Biol. Psychiatry Cogn. Neurosci. Neuroimaging 3, 223–230 (2018).
45. Schumann, G. et al. Stratified medicine for mental disorders. Eur. Neu-ropsychopharmacol. 24, 5–50 (2014).
46. Chaste, P. et al. A genome-wide association study of autism using the Simons Simplex Collection: does reducing phenotypic heterogeneity in autism increase genetic homogeneity? Biol. Psychiatry 77, 775–784 (2015). 47. Insel, T. R. & Cuthbert, B. N. Medicine. Brain disorders? Precisely. Science 348,
499–500 (2015).
48. Steckler, A. & McLeroy, K. R. The importance of external validity. Am. J. Public Health 98, 9–10 (2008).
49. Farmer, A. E., McGuffin, P. & Spitznagel, E. L. Heterogeneity in schizophrenia: a cluster-analytic approach. Psychiatry Res. 8, 1–12 (1983).
50. Castle, D. J., Sham, P. C., Wessely, S. & Murray, R. M. The subtyping of schi-zophrenia in men and women: a latent class analysis. Psychol. Med. 24, 41–51 (1994).
51. Dollfus, S. et al. Identifying subtypes of schizophrenia by cluster analyses. Schizophr. Bull. 22, 545–555 (1996).
52. Kendler, K. S., Karkowski, L. M. & Walsh, D. The structure of psychosis: latent class analysis of probands from the Roscommon Family Study. Arch. Gen. Psychiatry 55, 492–499 (1998).
53. Murray, V. et al. Dimensions and classes of psychosis in a population cohort: a four-class, four-dimension model of schizophrenia and affective psychoses. Psychol. Med. 35, 499–510 (2005).
54. Bell, M. D., Corbera, S., Johannesen, J. K., Fiszdon, J. M. & Wexler, B. E. Social cognitive impairments and negative symptoms in schizophrenia: are there subtypes with distinct functional correlates? Schizophr. Bull. 39, 186–196 (2013). 55. Insel, T. et al. Research domain criteria (RDoC): toward a new classification framework for research on mental disorders. Am. J. Psychiatry 167, 748–751 (2010).
56. Laan, W. et al. Adjuvant aspirin therapy reduces symptoms of schizophrenia spectrum disorders: results from a randomized, double-blind, placebo- con-trolled trial. J. Clin. Psychiatry 71, 520–527 (2010).
57. Berk, M. et al. Aspirin: a review of its neurobiological properties and ther-apeutic potential for mental illness. BMC Med. 11, 74 (2013).
58. Berthold-Losleben, M., Heitmann, S. & Himmerich, H. Anti-inflammatory drugs in psychiatry. Inflamm. Allergy Drug. Targets 8, 266–276 (2009).
59. Sommer, I. E., de Witte, L., Begemann, M. & Kahn, R. S. Nonsteroidal anti-inflammatory drugs in schizophrenia: ready for practice or a good start? A meta- analysis. J. Clin. Psychiatry 73, 414–419 (2012).
60. Sommer, I. E. et al. Efficacy of anti-inflammatory agents to improve symptoms in patients with schizophrenia: an update. Schizophr. Bull. 40, 181–191 (2014).
61. Fond, G. et al. Effectiveness and tolerance of anti-inflammatory drugs’ add-on therapy in major mental disorders: a systematic qualitative review. Acta Psy-chiatr. Scand. 129, 163–179 (2014).
62. Andrade, C. Nonsteroidal anti-inflammatory drugs and 5-HT(3) serotonin receptor antagonists as innovative antipsychotic augmentation treatments for schizophrenia. J. Clin. Psychiatry 75, e707–e709 (2014).
63. Nitta, M. et al. Adjunctive use of nonsteroidal anti-inflammatory drugs for schizophrenia: a meta-analytic investigation of randomized controlled trials. Schizophr. Bull. 39, 1230–1241 (2013).
64. Muller, N., Myint, A. M., Krause, D., Weidinger, E. & Schwarz, M. J. Anti-inflammatory treatment in schizophrenia. Prog. Neuropsychopharmacol. Biol. Psychiatry 42, 146–153 (2013).
65. Weiser, M., Burshtein, S. & L, F. A randomized trial administering aspirin, minocycline or pramipexole vs placebo as add-on to antipsychotics in patients with schizophrenia or schizoaffective disorder. Neuropsychopharma-cology 38, abstr S314–S446 (2012).
66. McAllister, C. G. et al. Increases in CSF levels of interleukin-2 in schizophrenia: effects of recurrence of psychosis and medication status. Am. J. Psychiatry 152, 1291–1297 (1995).
67. Lin, A. et al. The inflammatory response system in treatment-resistant schi-zophrenia: increased serum interleukin-6. Schizophr. Res. 32, 9–15 (1998). 68. Zhang, X. Y., Zhou, D. F., Cao, L. Y., Wu, G. Y. & Shen, Y. C. Cortisol and cytokines
in chronic and treatment-resistant patients with schizophrenia: association with psychopathology and response to antipsychotics. Neuropsychopharma-cology 30, 1532–1538 (2005).
69. Mondelli, V. et al. Cortisol and inflammatory biomarkers predict poor treat-ment response infirst episode psychosis. Schizophr. Bull. 41, 1162–1170 (2015). 70. Lodolce, J. P. et al. IL-15 receptor maintains lymphoid homeostasis by sup-porting lymphocyte homing and proliferation. Immunity 9, 669–676 (1998). 71. Mortier, E. et al. Macrophage- and dendritic-cell-derived interleukin-15
receptor alpha supports homeostasis of distinct CD8+ T cell subsets. Immu-nity 31, 811–822 (2009).
72. Gomez-Nicola, D., Valle-Argos, B., Pita-Thomas, D. W. & Nieto-Sampedro, M. Interleukin 15 expression in the CNS: blockade of its activity prevents glial activation after an inflammatory injury. Glia 56, 494–505 (2008).
73. Gomez-Nicola, D., Valle-Argos, B., Pallas-Bazarra, N. & Nieto-Sampedro, M. Interleukin-15 regulates proliferation and self-renewal of adult neural stem cells. Mol. Biol. Cell. 22, 1960–1970 (2011).
74. Wu, X. et al. Interleukin-15 affects serotonin system and exerts antidepressive effects through IL15Ralpha receptor. Psychoneuroendocrinology 36, 266–278 (2011).
75. Pan, W. et al. Brain interleukin-15 in neuroinflammation and behavior. Neurosci. Biobehav. Rev. 37, 184–192 (2013).
76. Guyon, A. CXCL12 chemokine and GABA neurotransmitter systems crosstalk and their putative roles. Front. Cell. Neurosci. 5, 115 (2014).
77. Torrey, E. F. et al. Cytomegalovirus and schizophrenia. CNS Drugs 20, 879–885 (2006).
78. Regier, D. A. et al. Comorbidity of mental disorders with alcohol and other drug abuse. Results from the Epidemiologic Catchment Area (ECA) Study. JAMA 264, 2511–2518 (1990).