HAL Id: tel-01496246
https://tel.archives-ouvertes.fr/tel-01496246
Submitted on 27 Mar 2017
HAL is a multi-disciplinary open access archive for the deposit and dissemination of sci-entific research documents, whether they are pub-lished or not. The documents may come from teaching and research institutions in France or abroad, or from public or private research centers.
L’archive ouverte pluridisciplinaire HAL, est destinée au dépôt et à la diffusion de documents scientifiques de niveau recherche, publiés ou non, émanant des établissements d’enseignement et de recherche français ou étrangers, des laboratoires publics ou privés.
Investigation et caracterisation de différents homologues
de transporteurs ADP/ATP
Aleksandra Woznicka-Misăilă
To cite this version:
Aleksandra Woznicka-Misăilă. Investigation et caracterisation de différents homologues de trans-porteurs ADP/ATP. Biomolecules [q-bio.BM]. Université Grenoble Alpes, 2016. English. �NNT : 2016GREAV011�. �tel-01496246�
THÈSE
Pour obtenir le grade de
DOCTEUR DE LA COMMUNAUTE UNIVERSITE
GRENOBLE ALPES
Spécialité : BIOLOGIE STRUCTURALE ET NANOBIOLOGIE Arrêté ministériel : 7 août 2006
Présentée par
Aleksandra Woźnicka-Misăilă
Thèse dirigée par Dr. Stéphanie Ravaud
préparée au sein du Laboratoire : Institut de Biologie Structurale (Grenoble)
dans l'École Doctorale : Chimie et Science du Vivant
An investigation and
characterization of different
ADP/ATP Carrier homologs
Thèse soutenue publiquement le 19 Septembre 2016 devant le jury composé de :
Dr. Bruno Miroux
Directeur de Recherche, IBPC, Paris Rapporteur
Dr. Gergely Katona
Professeur associé, Université de Gothenburg, Göteborg Rapporteur
Dr. Cécile Breyton
Directeur de Recherche, IBS, Grenoble Examinateur
Dr. Jean-Michel Jault
Directeur de Recherche, IBCP, Lyon Examinateur
Dr. Stéphanie Ravaud
Dedication
To my son, Jacob
Acknowledgments
I would like to express my special thanks of gratitude to my supervisor Stéphanie Ravaud for great support, patience, encouragement, all precious advices and for guiding me during my all PhD. I would like to thank her additionally for great understanding and being a good friend in all performed work.
I would like to thank Eva Pebay-‐Peroula for giving me this golden opportunity to develop my skills in this field, for help and giving each time good ideas how to improve (always can be better!).
I would like to also express my best regards to all the members of NanoMem network thanks to whom I could have developed my skills and knowledge.
I would like to express my big thanks to Delphine Baud for great help in functional activity experiments, work would not go so well without her.
I would like to thank Manfred Burghammer, and Anastasya Shilova from ESRF for great collaboration in one of the projects. I would like to acknowledge Hugues Nury, for helping me to understand many new things in crystallography and data analysis.
I would like to thank Isabel de Moraes, Jacques-‐Philippe Colletier and François Dehez for encouragement and help in understanding the main point.
I would like to thank people from my team for their valuable advices and willingness of help, collegues from Cell-‐Free platform, especially Céline Juillan-‐ Binard and Lionel Imbert.
I would like to also acknowledge Christine Ebel, Aline le Roy and Caroline Mas for helping in SEC-‐MALLS, AUC and CD data analysis.
Finally I would like to express my great thanks to my Family, my husband Andrei, my son Jacob and of course my parents. Without all of them this thesis would not arise.
Additionally, I would like to emphasize that the time during my PhD was special and unforgettable and fulfilled me with a lot of new experiences and friendships.
Abbreviations
AA – Amino Acid mix AAC – ADP/ATP Carrier
ABC – an Adenosine triphosphate-‐Binding Cassette transporters AcrB – the Bacterial Multidrug Efflux Transporter
ADP – Adenosine DiPhosphate
adPEO – autosomal dominant Progressive Ophtalmoplegia AGC – mitochondrial Aspartate/Glutamate Carrier
AMP – Adenosine MonoPhosphate
ANT – an Adenosine Nucleotide Transporter APC – mitochondrial ATP-‐Mg2+/Pi Carrier
ATP – Adenosine TriPhosphate AUC – Analytical UltraCentrifugation BA – Bongkrekic Acid
bAAC – bovine ADP/ATP Carrier BCA -‐ BiCinchoninic Acid assay
BtuCD – E. coli vitamin B12 transporter (ABC transporter, Type II) BtuF – E. coli periplasmic binding protein
bR -‐ bacterioRhodopsin BSA – Bovine Serum Albumine
CAC – mitochondrial Carnitine/Acylcarnitine Carrier (C)ATR – (Carboxy)ATRactyloside
CD – Circular Dichroism
CIC – mitochondrial Citrate/malate Carrier CPA1 – Cation Proton Antiporter
c-‐state – cytosolic conformational state DARP – Designed Ankyrin-‐Repeat Protein DC – Desalting Column
DIC – mitochondrial DIcarboxylate Carrier E1 – high affinity state for Na+
E2 – high affinity state for K+
EB – Elution Buffer
ECF – Energy-‐Coupling Factor transporters
EcfT – Energy-‐coupling factor transporter Transmembrane domain E1P/E2P – phosphorylated intermediate states
EQB – EQuilibration Buffer ER – Endoplasmic Reticulum
FSEC – Fluorescence Size Exclusion Chromatography GC – mitochondrial Glutamate Carrier
GLIC – pentameric Ligand-‐Gated Ion Channel GLUT1 – GLUcose Transporter 1
GltPh – Na+-‐coupled aspartate transporter
GPCRs – G-‐Protein Coupled Receptors H – transmembrane Helix
h – amphipathic, cytosolic helix hAAC – human ADP/ATP Carrier Hsc70 – Heat-‐shock cognate 70 Hsp90 – Heat-‐shock protein 90 IM – InterMembrane space LacY – Lactose transporter Y LB – Lysogeny Broth
LeuT – Na+-‐coupled amino acid transporter
MAM – Mitochondrial Associated ER Membrane MBP – Maltose Binding Protein
MCF – Mitochondrial Carrier Family MCs – Mitochondrial Carriers MDR – MultiDrug Resistance
MjNCX – sodium/calcium (Na+/Ca2+) eXchanger from Methanococcus jannaschii
MMP – Matrix MetalloProteinase
MOMP – Mitochondrial Outer Membrane Permabilization MsbA – E. coli lipid transporter (ABC transporters, Type III) mRNA – messenger RNA
mtDNA – mitochondrial DNA
mtERs – mitochondrial Estrogen Receptors NBDs – Nucleotide Binding Domains NhaA – E. coli Na+/H+ Antiporter
NiNTA – Nickiel Resin
NKCC – Na+-‐K+-‐Cl-‐ Co-‐transporter
ODC – mitochondrial OxoDicarboxylate Carrier OGC – mitochondrial OxoGlutarate Carrier ORC – mitochondrial ORnitine/citruline Carrier Oxa1 – mitochondrial Oxidase assembly 1 PCR – Polymerase Chain Reaction
PiC – mitochondrial Phosphate/H+ Carrier
PM_AAC – Plasma Membrane ADP/ATP Carrier
PM-‐ANT1 – Plasma Membrane Adenosine Nucleotide Transporter 1 PMP – Plasma Membrane Protein
PyC – mitochondrial Pyruvate/H+ Carrier
RB – Resolubilization Buffer Rf – Restriction free cloning RT – Room Temperature
SAMC – cytosolic S-‐AdenosylMethionine Carrier SANS – Small-‐Angle Neutron Scattering
SB – Solubilization Buffer
Sav1866 – ABC transporter (Type III) from S. aureus SDS-‐PAGE – SDS-‐PolyAcrylamid Gel Electrophoresis SEC – Size Exclusion Chromatography
SSS – Solute Sodium Symporters TAE – Tris-‐Acetate-‐EDTA buffer TB – Terrific Broth medium
TIM – Translocase of the Inner Membrane TM – TransMembrane
TMD – TransMembrane Domain
TOM – Translocase of the Outer Membrane TPC – Thiamine Pyrophosphate Carrier UCP – UnCoupling Protein
VDAC – Voltage Dependent Ion Channel protein WB – Wash Buffer
WR – Working Reagent
vSGLT – Sodium-‐GaLactose Transporter from Vibrio parahaemolyticus X-‐Fel – X-‐ray Free electron laser
yAac2 or 3 – yeast Adp/atp carrier 2 or 3
List of Figures
Figure 1 Model of the animal cell and some of its contents Figure 2 The mosaic model of the cell membrane
Figure 3 Illustration of the simple diffusion transport
Figure 4 Illustration of passive transport pathways by channel or carrier proteins
Figure 5 Representation of different passive transport mechanism conducted by channels and carrier proteins
Figure 6 Transport of the glucose across the cell membrane by glucose transporter is an example of facilitated diffusion
Figure 7 Representation of three different models of membrane transport: uniport, symport and antiport
Figure 8 Symporters and antiporters are secondary active transporters Figure 9 Symport of Na+ and galactose via vSGLT transporter
Figure 10 The outward-‐inward conformational change of MjNCX
Figure 11 Cartoon representation of Na+ and Ca2+ exchange of NCX in the classical 3 Na+:1 Ca2+ mode
Figure 12 Model of the Na+/H+ (NhaA) transporter presented with the substrate passage and the
periplasmic barrier
Figure 13 Models of the primary active transport Figure 14 Na+/K+ ATPase
Figure 15 The crystal structure of the Na+ bound Na+/K+ ATPase
Figure 16 The crystal structure of the Na+ bound Na+/K+ ATPase in E1-‐P.ADP.3Na+ state
Figure 17 Classification of ABC transporters according to the TMD organization Figure 18 Nucleotide-‐binding domains (NBDs) of ABC transporters
Figure 19 Representation of crystal structure of BtuCD-‐F complex from E.coli Figure 20 Different models of transport mechanisms of ABC transporters Figure 21 Structure of mitochondria
Figure 22 The β-‐stranded structure of the murine VDAC1 protein solved at 2.3 Å resolution Figure 23 The main processes in the mitochondria
Figure 24 Examples of substrates carried by mitochondrial transporters
Figure 25 The mitochondria carrier translocation into the inner mitochondrial membrane Figure 26 The topology of MCF and characteristic motifs of the bovine ADP/ATP carrier Figure 27 The structure of the bovine ADP/ATP carrier in ribbon diagram
Figure 28 Structure of the yeast ADP/ATP carriers
Figure 29 The AAC inhibitors – (Carboxy)atractyloside ((C)ATR) and bongkrekic acid (BA) Figure 30 Surface representation of bovine mitochondrial AAC1 cavity
Figure 31 The 3D electrostatic isopotential map of apo-‐AAC showing a funnel that guides the ADP3-‐
towards the bottom of the protein cavity (closed conformation) Figure 32 Proposed transport mechanism of AAC
Figure 33 Sequence alignments of bovine and four human AAC isoforms
Figure 34 Representation of the predominant features of the four AAC isoforms promoters with apoptosis linked-‐functions
Figure 35 Human AAC gene isoforms organization scheme with indicated regulatory elements, transcription factor binding sites for various promoter regions of the four AAC isoforms Figure 36 Summary of available prokaryotic and eukaryotic membrane protein structures Figure 37 Femtosecond nanocrystallography
Figure 38 Cell-‐Free expression system
Figure 39 Scheme of the Fluorescence Size Exclusion Chromatography (FSEC) technique
Figure 40 General scheme of the 32P radiolabeled ATP uptake by E. coli cells expressing the human
ADP/ATP Carriers
Figure 41 Cartoon representation of the crystallography process in the lipidic cubic phase (LCP) Figure 42 Protein crystallization techniques
Figure 43 Screening of new crystallization conditions for the 5-‐HT3 serotonin receptor Figure 44 Crystal Direct (CD) plate technique
Figure 45 Crystal set up on silicone nitride membranes Figure 46 LCP-‐syringe set up for SFX presented in several steps Figure 47 Sequence analysis of bovine and four human AAC isoforms Figure 48 Expression levels of human AAC isoforms in E. coli
Figure 49 All human AACs are functionally expressed in E. coli membranes
Figure 50 Substrate saturation curves of [α-‐32P]-‐ATP uptake by cells expressing hAAC1, hAAC2,
hAAC3 and hAAC4
Figure 51 Functional properties of human AAC1 mutants Figure 52 Functional properties of human AAC4 mutants
Figure 53 Comparison of [α-‐32P]-‐ATP uptake of E. coli cells expressing MBP-‐hAAC1_wild-‐type (WT)
and MBP-‐hAAC4_wild-‐type (WT) and their mutants
Figure 54 Cell-‐free expression of hAAC3 cloned in the pIVEX 2.3d vector or pIVEX 2.4d vector in presence of four different detergents
Figure 55 Purification of fullength human AAC1 and AAC3 in 0.005% MNG-‐3 and 0.04% DDM by affinity chromatography and size exclusion chromatography
Figure 56 Molecular weight calibration curve of the size exclusion chromatography column established using protein standards
Figure 57 Far UV circular dichroism (CD) spectrum of hAAC1 and hAAC3 after purification by size exclusion chromatography in 0.005% MNG-‐3 and 0.04% DDM detergents
Figure 58 Thermo-‐denaturation assays using far UV circular dichroism (CD) spectrum of hAAC1 in 0.04% DDM and hAAC3 in 0.005% MNG-‐3 with or without CATR inhibitor
Figure 59 Thermo-‐denaturation assays performed using Fluorescence Size Exclusion
Chromatography (FSEC) method of hAAC1 and hAAC3 in 0.04% DDM or 0.005% MNG-‐3 with or without CATR inhibitor
Figure 60 Thermo-‐denaturation assays performed using CPM dye of hAAC3 in 0.04% DDM or 0.005% MNG-‐3 with or without CATR inhibitor
Figure 61 SEC-‐MALLS data analysis of molecular mass estimation for hAAC1 and hAAC3 in 0.04% DDM
Figure 62 SEC-‐MALLS data analysis of molecular mass estimation for hAAC1 and hAAC3 in 0.005% MNG-‐3
Figure 63 Sedimentation velocity (AUC) data analysis of hAAC1 and hAAC3 in 0.04% DDM Figure 64 LCP crystallization of hAAC3 in DDM detergent
Figure 65 Crystal of hAAC3 in 0.01% MNG3 detergent obtained from crystallization plate PACT_qiagen
Figure 66 Investigation of PM_AAC expression levels in different E. coli cells – BL21 (DE3), Rosetta 2 (DE3), C41 and C43
Figure 67 Solubilization tests
Figure 68 SDS-‐PAGE analysis of the NiNTA affinity chromatography of PM_AAC in 0.1% LAPAO Figure 69 Size Exclusion Chromatography of PM_AAC in 0.1% LAPAO
Figure 70 PM_AAC functional studies
Figure 71 Thermo-‐denaturation assays performed using CPM dye of PM_AAC purified in 0.1% LAPAO Figure 72 Example of crystallization drop with PM_AAC in 0.1% LAPAO
Figure 73 Crystal structure of mouse 5-‐HT3 serotonin receptor
Figure 74 Examples of mouse 5-‐HT3 serotonin receptor crystals obtained on silicone nitride membranes
Figure 75 An example of the diffraction pattern of mouse 5-‐HT3 serotonin receptor crystal Figure 76 GLIC protein
Figure 77 Electron density maps derived from serial microcrystallography diffraction of GLIC with top and side view
Figure 78 AcrB protein
List of Tables
Table 1 Intracellular and extracellular concentrations of different ions in the human cell environment
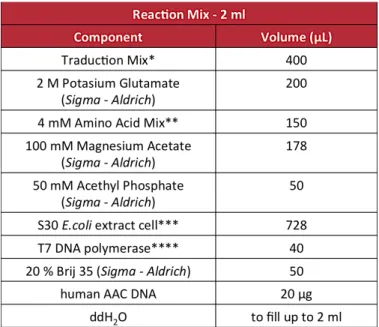
Table 2 Disorders associated with different mutations in the genes encoding mitochondrial carriers Table 3 Components of the Reaction Mix used for Cell-‐Free expression of human ADP/ATP Carriers Table 4 Components of the Feeding Mix used for Cell-‐Free expression of human ADP/ATP Carriers Table 5 Components of the buffers used in purification of human ADP/ATP Carriers
Table 6 Components of all of the buffers used for membrane extraction and PMP purification Table 7 Kinetic properties of the wild-‐types human AAC isoforms
Table 8 Summary of the hAAC1 and hAAC4 mutants generated
Table 9 Kinetic properties of the wild-‐type (hAAC1) and of hAAC1 mutants Table 10 Kinetic properties of the wild-‐type (hAAC4) and of hAAC4 mutants
Table 11 Summary of thermal stability data of hAAC1 and hAAC3 in 0.005% MNG-‐3 and 0.04% DDM with or without CATR inhibitor and measured using: CD, FSEC and CPM dye
Table 12 Summary of the results obtained from lysozyme, thaumatine, 5-‐HT3 serotonin receptor, GLIC and AcrB crystals
Table of Contents
1 Introduction ... 13
1.1 Membrane transport ... 13
1.1.1 Simple and Facilitated diffusion ... 15
1.1.2 The secondary active transport – symport and antiport ... 18
1.1.2.1 Symporters ... 19
1.1.2.2 Antiporters ... 20
1.1.3 The primary active transport ... 22
1.1.3.1 P – type ATPases ... 23
1.1.3.2 The ABC Transporters Family ... 25
1.1.3.3 Different mechanisms of membrane transport ... 28
1.2 Mitochondrial carriers ... 30
1.2.1 Mitochondrial transport ... 30
1.2.2 Mitochondrial Carriers ... 33
1.2.2.1 Biogenesis of MCF proteins ... 34
1.2.2.2 Distribution ... 35
1.2.2.3 Characteristic features of mitochondrial carriers ... 36
1.2.2.4 The mitochondrial ADP/ATP Carrier (AAC) – protein topology and structures ... 36
1.2.2.4.1 Inhibitors and conformational states ... 40
1.2.2.4.2 Substrate specificity and transport hypothesis ... 41
1.2.2.4.3 Protein oligomeric state ... 44
1.2.2.4.4 Diseases associated with Mitochondrial Carrier Family ... 46
1.2.2.4.5 Human ADP/ATP Carriers ... 48
1.2.2.4.6 Role of human ADP/ATP Carriers in apoptosis and cancer ... 50
1.3 Structural Biology of Membrane Proteins ... 53
2 Project objectives ... 56
3 Materials and methods ... 58
3.1 Molecular biology -‐ recombinant DNA techniques ... 58
3.1.1 Transformation of DNA plasmid in competent cells ... 58
3.1.2 Small scale plasmid DNA preparation (MiniPrep) ... 58
3.1.3 Large scale plasmid DNA preparation (MidiPrep) ... 59
3.1.4 Agarose gel electrophoresis ... 59
3.1.5 Spectrophotometric analysis of DNA concentrations ... 59
3.1.6 Cloning methods ... 59
3.1.7 Constructs ... 60
3.2 Biochemical methods for protein investigation ... 60
3.2.1 SDS-‐polyacrylamide gel electrophoresis (SDS-‐PAGE) ... 60
3.2.2 Western blotting ... 60
3.2.3 Protein quantification using BCA Assay (Thermo Fisher Scientific) ... 61
3.3 Production of human mitochondrial ADP/ATP Carriers ... 61
3.3.1 Protein expression using Cell-‐Free System ... 61
3.3.2 Protein purification using NiNTA Chromatography ... 64
3.3.3 Protein Purification using Size Exclusion Chromatography (SEC) ... 65
3.4 Production of non–mitochondrial ADP/ATP Carrier – Plasma Membrane Protein (PMP) -‐ from plants ... 66
3.4.1 Protein expression trials in E.coli system ... 66
3.4.2 Large scale protein expression in E.coli ... 67
3.4.3 Membrane extraction ... 67
3.4.4 Solubilization trials ... 68
3.4.5 Protein purification using NiNTA chromatography ... 68
3.4.6 Protein Purification using Size Exclusion Chromatography (SEC) ... 69
3.5 Biophysical Methods ... 70
3.5.1 Spectrophotometric analysis of protein concentration ... 70
3.5.2 Circular dichroism (CD) measurements ... 70
3.5.3 Thermal stability assays ... 72
3.5.3.2 Determination of protein stability using tryptophan fluorescence – FSEC ... 72
3.5.4 Determination of protein oligomerization state ... 74
3.5.4.1 Size Exclusion Chromatography combined with Multi Angle Laser Light Scattering: SEC -‐ MALLS ... 74
3.5.4.2 Analytical Ultracentrifugation – AUC ... 75
3.5.5 N-‐terminal sequencing analysis ... 75
3.6 Functional assays ... 76
3.6.1 Radioactivity assays ... 76
3.6.2 Experiments performed in liposomes ... 78
3.7 Crystallization trials ... 78
3.7.1 Lipidic Cubic Phase (LCP) crystallization ... 79
3.7.2 LCP-‐FRAP: LCP–Fluorescence Recovery After Photo-‐bleaching ... 80
3.7.3 Vapour diffusion crystallization ... 81
3.8 Different crystallization set ups for serial nano-‐ and micro development techniques ... 82
3.8.1 Protein samples ... 82
3.8.1.1 Lysozyme ... 83
3.8.1.2 Thaumatine ... 83
3.8.1.3 Bacterial multidrug efflux transporter – AcrB ... 83
3.8.1.4 Pentameric Ligand-‐Gated Ion Channel GLIC ... 84
3.8.1.5 Mouse serotonin 5-‐HT3 receptor ... 84
3.8.2 Crystallogenesis ... 85
3.8.2.1 Vapour diffusion ... 85
3.8.2.1.1 Crystal Direct (CD) Plates ... 86
3.8.2.1.2 Silicone nitride membranes ... 86
3.8.2.2 Lipidic Cubic Phase (LCP) ... 88
4 Results ... 91
4.1 Part I – Human Mitochondrial ADP/ATP Carrier ... 91
4.1.1 Functional characterization of the four human AAC isoforms ... 91
4.1.1.1 3D models of the four human ADP/ATP carriers ... 91
4.1.1.2 Transport properties of the wild-‐type proteins ... 93
4.1.1.3 Transport properties of hAACs mutants ... 97
4.1.1.3.1 Functional properties of human AAC1 mutants ... 98
4.1.1.3.2 Functional properties of hAAC4 mutants ... 101
4.1.2 Discussion and conclusions ... 104
4.2 Part II -‐ Human ADP/ATP carriers production, characterization and crystallization ... 111
4.2.1 Human AACs are efficiently produced using E. coli extract (ECE) in cell-‐free expression system ... 111
4.2.2 hAAC1 and hAAC3 were obtained in a pure and homogenous form in DDM and MNG-‐3 detergents ... 112
4.2.3 hAAC1 and hAAC3 folding determination ... 115
4.2.4 Thermal stability properties of hAAC1 and hAAC3 ... 116
4.2.4.1 Thermal stability measurements performed by CD ... 116
4.2.4.2 Thermal stability measurements performed by FSEC ... 117
4.2.4.3 Thermal stability measurements performed using CPM dye ... 119
4.2.5 hAAC1 and hAAC3 oligomerization state ... 120
4.2.5.1 SEC-‐MALLS analysis ... 121
4.2.5.2 AUC analysis ... 122
4.2.6 Crystallisation trials on human AACs ... 123
4.2.6.1 LCP crystallization ... 124
4.2.6.2 Vapour diffusion (sitting drop) crystallization ... 125
4.2.7 Discussion and conclusions ... 126
4.3 Part III -‐ Non-‐mitochondrial ADP/ATP transporters: plant plasma membrane ADP/ATP Carrier (PM_AAC) ... 130
4.3.1 PM_AAC is successfully expressed in bacterial system ... 130
4.3.2 PM_AAC solubilisation and purification in detergent ... 131
4.3.3.1 Functional studies ... 133
4.3.3.2 Thermal stability assays ... 134
4.3.3.3 Crystallization trials ... 134
4.3.4 Discussion and conclusions ... 135
4.4 Part IV -‐ Different protein crystallization methods for developing serial nano-‐ and micro-‐crystallography techniques ... 137
4.4.1 Crystallization of lysozyme and thaumatine ... 138
4.4.2 Crystallization of 5-‐HT3 serotonin receptor ... 138
4.4.3 Crystallization of the bacterial GLIC ion channel ... 141
4.4.4 Crystallization of the bacterial Multidrug Efflux Transporter -‐ AcrB ... 142
4.4.5 Discussion and conclusions ... 143
5 General Conclusions ... 146 6 ANNEXES ... 150 7 REFERENCES ... 170
Résumé
L'objectif principal de ce projet de thèse était d'obtenir de nouvelles données structurales sur les transporteurs ADP/ATP mitochondriaux et de développer des outils pour les approches de micro-‐ et nano-‐cristallographie appliquées à la biologie structurale des protéines membranaires.
Le rôle principal du transporteur ADP/ATP (AAC) est d'importer et d'exporter respectivement de l’ADP3-‐ et l’ATP4-‐ à travers la membrane
mitochondriale interne, entre l'espace intermembranaire et la matrice. AAC est le transporteur mitochondrial le mieux caractérisé de toute cette famille de protéines. De nombreuses études ont été menées pour caractériser sa fonction et sa structure. Toutefois, les données structurales n’étant disponibles que pour une conformation de la protéine, de nombreuses questions fondamentales notamment sur les différents états conformationnels adoptés par la protéine au cours du processus de transport restent encore posées. Dans cette thèse, nous avons étudié les 4 isoformes humaines d’AAC. Elles sont impliquées dans diverses maladies génétiques, mais jouent également un rôle dans la cancérogenèse. Cette thèse décrit ainsi en détail la caractérisation structurale et fonctionnelle de ces protéines et leur comparaison. C’est est une étape essentielle pour définir leurs propriétés, et constitue un point de départ précieux dans le développement de nouvelles thérapies.
Le domaine de la biologie structurale ne cesse de connaître de nouveaux développements, comme c’est le cas par exemple avec l’avènement de la cristallographie sérielle. Il y a donc un besoin constant de nouvelles approches notamment pour la préparation des échantillons, leur montage sur les lignes de lumière et les collectes de données afin de continuer à améliorer la qualité des données collectées au synchrotron. Ainsi, notre objectif était d'utiliser différents échantillons de protéines membranaires pour développer de nouvelles techniques de cristallisation et de montage d’échantillons sur les lignes de lumière afin de préserver au mieux la qualité des échantillons tout en permettant des collectes de données plus rapides, plus efficaces et plus simples.
Summary
The main objective of this PhD project was to gain new structural data on the mitochondrial ADP/ATP carriers and develop tools for micro-‐ and nano-‐ crystallography approaches applied to membrane protein structural biology.
The main role of the ADP/ATP carrier (AAC) is to import and export ADP3-‐
and ATP4-‐ respectively between the intermembrane space and the matrix
through the inner mitochondrial membrane. AAC is the best characterized among all mitochondrial carriers. Much has been done to investigate its function and structure. However, since structural data are only available for one conformation of the protein some fundamental questions about the different conformational states adopted during the transport process still need to be answered.
In this thesis we considered 4 human AAC homologs as a main target. They are involved in different genetic diseases but play also a role in cancerogenesis. This thesis describes and compares in detail the functional and structural characterization of the human AAC isoforms. It was an essential step to give insight into their native properties and is a precious starting point for the drug development field.
Since the structural biology field is rapidly developing especially in serial crystallography techniques, there are more and more new applications for samples preparation, mounting and measurements in order to improve the quality of the data collected at the synchrotrons. Hence, our second objective was to use different membrane protein samples to develop new crystal-‐friendly crystallization set up combined with different sample environment on the beamline toward faster, more efficient and simpler data collection.
CHAPTER I
1 Introduction
1.1 Membrane transport
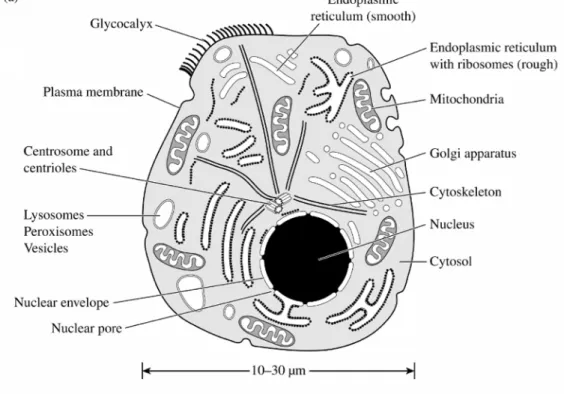
The cell is the smallest unit that exhibits all the molecular activity that underlies the transport processes. At the same time the cell is the largest unit that is common to all of the tissues and organs that perform all of the transport processes necessary to life. Considering that fact in the hierarchy of scale, cells are the bridge between molecular biology and physiology1 ( see Fig. 1).
Figure 1 Model of the animal cell and some of its contents1.
Cellular transport is a movement of compounds across the outlying cell membrane. It is an essential process since 1) it allows the cell to uptake and release many different molecules involved in its biological functions, for instance the uptake and release of the oxygen by red blood cells 2) it regulates the concentration of molecules and ions according to the metabolic needs i.e. by increasing the transport of glucose in the muscles during muscle contraction. Cell membranes are a perfect example of an organized interface with the outside world that establishes different mechanisms and behaviors to adapt to the
environmental circumstances. The differences in ionic composition across the membranes (see Table 1) influence the electrical behavior of the cells that underlies the function of nerves and muscles. Moreover, the whole family of the receptor proteins sense the chemical and physical environmental changes and initiate the cell response to it1.
Table 1 Intracelluar and extracellular concentrations of different ions in the human cell environment1.
The structure of the cell membranes in the higher organisms share a common organization, to which specific components are added to meet the particular requirements of specific cell type and function of a tissue1.
The main components of the cell membranes are proteins and lipids. The ratio between proteins/lipids varies considerably between different species but also within a single specie. Similarly the contribution of different lipids, for instance the cholesterol/phospholipid ratio can vary as well. The types of phospholipids (lipids with a phosphate group as a polar head and two long nonpolar hydrocarbon tails (see Fig. 2) that are usually the primary lipid component of each membrane can also be different from one cell to the other1.
In terms of proteins, their amount far exceeds the number of lipids. Most of them are ion and water channels, carriers, receptors and gap junction proteins. Many of them are also associated to the cell membranes via amphipathic interactions (molecules have both polar (hydrophilic) and nonpolar (hydrophobic) elements) or lipid anchoring for example.
Figure 2 The mosaic model of the cell membrane. The proteins embedded in the bilayer can extend to a considerable distance into the aqueous phases adjacent to the membrane (picture adapted from: http://www.macroevolution.net/fluid-‐mosaic-‐model.html).
The cell membranes are crossed by various solutes whose polarities range significantly from strongly hydrophobic to strongly hydrophilic. These compounds differ also in terms of size. Therefore each cell membrane must provide a variety of transport pathways to accommodate the different kinds of substrates. The cell membranes (in prokaryotes and eukaryotes) are defining and controlling these transport pathways and thus the amount of the exchanged substrates1. In the eukaryotic cells the transport processes occur also between
organelles and the cytoplasm. Substrate exchange between the organelles in the cell is essential in order to maintain cell well-‐being vitality. Hence, each organelle membrane possesses variety of membrane proteins and different composition of lipids to meet all of the cell-‐needs requirements.
1.1.1 Simple and Facilitated diffusion
In order to carry different components throughout the cells-‐ and organelles-‐membranes different models of cell transport have been developed.
Simple diffusion refers to the transport of small and non-‐charged molecules or lipid soluble molecules that freely pass through the membrane and squeeze between the phospholipids to enter or to leave the cell. Compounds which are transported by simple diffusion (for instance oxygen or carbon dioxide) move from the areas of high concentration to the areas of low concentration (termed as a concentration gradient) (see Fig. 3)2.
Figure 3 Illustration of the simple diffusion transport.
Osmosis names the simple diffusion of water molecules along their concentration gradient.
Facilitated diffusion refers to a passive–mediated transport of molecules or ions across a membrane via specific transmembrane integral proteins2.
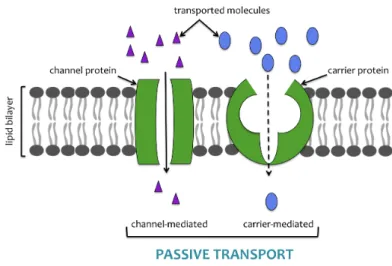
Passive transport does not require any energy such as ATP hydrolysis. Molecules and ions move along their concentration gradient. Facilitated diffusion varies from free diffusion process in three main principles: 1) the transport relies on molecular binding between the cargo and the membrane-‐embedded proteins, channels or carriers (see Fig. 4); 2) facilitated diffusion process can be saturated at a certain substrate concentration; 3) the temperature dependence in facilitated diffusion is significant since it is associated with activated binding event.
Figure 4 Illustration of passive transport pathways by channel or carrier proteins
associated with the type and the size of the carried substrates. Channel proteins in most of the cases open and close and thus deregulate the flow of ions (Na+,
Ca2+, K+, and Cl-‐) and small molecules (H2O, D-‐glucides, polypeptides and
nucleotides) across the membrane while carriers in order to transport the cargo, change their conformational state (see Fig 5).
Figure 5 Representation of different passive transport mechanisms conducted by channels and carrier proteins.
The nature of the substrates transported by channels depends on two parameters: the diameter of the channel pore and the electrostatic forces within the channel. Different types of channel proteins can be distinguished: non-‐gated (transport of K+ and Cl-‐ ions); gated (transport of Na+ and Ca2+ ions); voltage-‐
gated (opening and closing depend on the membrane potential, for instance voltage-‐gated Na+, Ca2+, K+, and Cl-‐ ion channels which provide split second
regulation in the nervous system and in muscles); ligand-‐gated (opening in response to the binding of an extracellular or intracellular regulatory molecule, for instance acetylcholine receptor); mechanically-‐gated (opening in response to the mechanical movement of an adjacent structure, for instance touch sensors in the skin); temperature-‐gated (opening in response either to an increase or a decrease in temperature, for instance in sensory neurons)3.
Larger molecules such as glucose or amino-‐acids are transported by transmembrane carrier proteins such as permeases that change their conformational state depending if they carry a cargo or not. One of the most important examples in this class of proteins is the glucose transporter. Its membrane expression is controlled by the insulin concentration in some cells.
When the amount of insulin increases, the number of active glucose transporters is increasing as well and more glucose molecules enter the cells (see Fig. 6)3.
Figure 6 Transport of the glucose across the cell membrane by glucose transporter is an example of facilitated diffusion (picture adapted from: http://www.zoology.ubc.ca.htm).
GLUT1 is the glucose transporter, which enables the transport of glucose inside the erythrocytes and is the main supplier of this substrate to the brain and other organs. The crystal structure of the full-‐length human GLUT1 uniporter was solved at 3.2 Å resolution in an inward-‐open conformation4.
1.1.2 The secondary active transport – symport and antiport
Three types of transporters are defined: uniporters (see glucose transporter), symporters and antiporters (see Fig. 7).
Figure 7 Representation of three different models of membrane transport: uniport, symport and antiport.
Symporters and antiporters are co-‐transporters which carry at least two different types of molecules across the cell membrane at the same time, in the same or in opposite directions respectively. Co-‐transporters belong to the secondary active transport membrane proteins group. Here, one of the molecules
is transported against its concentration gradient and the energy required for its transport across the cell membrane is brought by the co-‐transport of the other molecule along its concentration gradient (see Fig. 8).
Figure 8 Symporters and antiporters are secondary active transporters.
1.1.2.1 Symporters
One example of symporter protein is the Na+-‐K+-‐Cl-‐ co-‐transporter
(NKCC)5,6. The protein operates in conjunction with the Na+ pump, a K+ channel
and a Cl-‐ channel to carry out the epithelial salt movement. They maintain
electro-‐neutrality by moving two positively charged ions (Na+ and K+) alongside
two molecules of a negatively charged solute, Cl-‐ in the following ratio: 1 Na+ : 1
K+ : 2 Cl-‐.
Another known example of symporter is the sodium/galactose symporter that transport galactose while Na+ electrochemical gradient is the main driven
force for the symport. The structure of the Vibrio parahaemolyticus protein (vSGLT) was solved in an inward-‐open conformation first at 3 Å resolution7 and
later at 2.7 Å8. vSGLT possesses 14 transmembrane (TM) helices and a galactose
molecule is bound in the center of the cavity (see Fig. 9A and B). Na+/substrate
stoichiometry is 1:1 for vSGLT protein but this ratio varies amongst solute sodium symporters (SSS). The precise binding position of Na+ was not easy to
establish since Na+ and water molecule electron densities look similar.
Nevertheless based on the comparison with the LeuT structure9, the sequence
position was identified at the intersection of TM2 and TM9 approximately 10 Å away from the substrate–binding site (see Fig. 9C and D)7.
C D
Figure 9 Symport of Na+ and galactose via vSGLT transporter A) model of the vSGLT structure in the
outward-‐facing position and viewed from the membrane plane showing the extracellular cavity (blue mesh), B) structure of vSGLT protein in the inward-‐facing position viewed from the membrane and showing intracellular cavity (blue mesh). Helices depicted in orange (TM3), green (TM7), and blue (TM11) present structural rearrangement, helices depicted in white are showing little movement. Surface is presented in beige. Galactose is shown as red and black spheres (O and C atoms respectively). Sodium ion is depicted in blue, C) Proposed Na+ -‐binding site. Residues involved
in the Na+ binding are depicted as sticks colored by atom type, red helix is representing TM2, cyan –
TM9, D) Superposition of Na+ -‐ binding site from LeuT structure9 (green) and proposed Na+-‐ binding
site of vSGLT protein7.
1.1.2.2 Antiporters
One well–known and interesting example of an antiporter is the sodium/calcium (Na+/Ca2+) exchanger (NCX). The crystal structure of NCX from
Methanococcus jannaschii (Mj) was solved at 1.9 Å resolution (crystals were grown in lipidic cubic phase – LCP) in an outward–facing conformation. The protein contains 10 transmembrane helices and the two halves of MjNCX share a similar structure with opposite orientation. Four ion–binding site clusters are placed in the center of the protein structure. One site is specific for one Ca2+ ion
allow Na+ and Ca2+ to access the central ion–binding sites (see Fig. 10 A, B, C and D)10.
Figure 10 The outward–inward conformational change of MjNCX (A) The surface of MjNCX structure presents two independent external passages (yellow) for both ions to access the central ion–binding sites (green spheres – Na+ and red – Ca2+). (B) Side view of structural comparison of the outward–
facing conformation (orange) and inward–acing protein conformation (green). Gray color represents the core part of the protein that remains the same in both conformations. The light blue color represents the residues that create the central hydrophobic patch. (C) The central hydrophobic patch (light blue) with transmembrane domains – 1, 2A, 6 and 7A removed for clarity. (D) The inward–facing protein conformation showing two independent ways (yellow) for intracellular ion access to the central ion–binding sites10.
The structural mechanism of Na+/Ca2+ exchange highly depends on NCX
conformational state and on the alternating accessibility of the four central ion– binding sites (that have different specifity). Under physiological conditions the Ca2+ site is only specific to Ca2+ binding, whereas the other three are designed for
Na+ binding. While the Ca2+ site is alternatively accessible from each side of the
protein, the three Na+ sites are aligned in a winding single file with only one
being accessible at the external site when outward-‐facing and at the internal site when inward-‐facing. The position of those two Na+-‐specific sites on both
extremities ensures the selective and bidirectional Na+/Ca2+-‐exchange function
Figure 11 Cartoon representation of Na+ and Ca2+ exchange of NCX in the classical 3 Na+:1 Ca2+
mode10.
Another good example of antiport is the Na+/H+ antiporter (NhaA
transporter) for pH and Na+ homeostasis at alkaline pH in Escherichia coli and
many other enterobacteria. NhaA is a member of a very large family of secondary transporters, the monovalent cation-‐proton antiporter superfamily (CPA). NhaA exchanges 2 H+ for 1 Na+ (or 1 Li+) ion. The crystal structure of NhaA was solved
at 3.45 Å resolution and consists in 12 transmembrane helices with the amino-‐ and carboxy-‐terminal sites facing the cytoplasm. NhaA protein shares a very strong dependence on pH with many other prokaryotic and eukaryotic antiporters (see Fig. 12)11,12.
Figure 12 Model of the Na+/H+ (NhaA) transporter
presented with the substrate passage and the periplasmic barrier. The transmembrane helices lining the cytoplasmic and the periplasmic cation passage are highlighted by colors in the cylinder representation. Fully hydrated Na+/Li+ can diffuse into the upper zone of the
cytoplasmic funnel (light purple) but they can also enter from the lower part of it (red) or the periplasmic funnel (red). The barrier between the passages is colored in cream11.
1.1.3 The primary active transport
The primary or direct active transport is a transport that requires external energy to allow a molecule to cross a membrane against its concentration gradient. The source of energy can be of different type: chemical