ANALYSIS OF AIRCRAFT SURFACE MOTION
AT
BOSTON LOGAN INTERNATIONAL AIRPORT
by
Robert Elias Alhanatis
B.S. Aerospace Engineering Boston University, 1992
Submitted to the Department of Aeronautics and Astronautics in Partial Fulfillment of the Requirements for the
Degree of
MASTER OF SCIENCE
at the
Massachusetts Institute of Technology
September 1994© 1994 Robert Elias Alhanatis All Rights Reserved
The author hereby grants to MIT permission to reproduce and to distribute publicly paper and electronic copies of this thesis
document in whole or in part.
Signature of the Author ...
. -x. ...
Department of Aeronautics and AstronauticsJuly 13, 1994
Certified by ... ...
...
Professor Robert W. Simpson Director, Flight Transportation Laboratory \ Thesis Supervisor
Accepted by ...
...
...
...
f
Professor Harold Y. Wachman MASChairman, Department Graduate CommitteeS ISES- INSTITUrTE
SEP 2 11994
Aero
ANALYSIS OF AIRCRAFT SURFACE MOTION
AT
BOSTON LOGAN INTERNATIONAL AIRPORT
by
ROBERT ELIAS ALHANATIS
Submitted to the Department of Aeronautics and Astronautics
in Partial Fulfillment of the Requirements for the Degree of Master of Science in Aeronautics and Astronautics
ABSTRACT
The purpose of this thesis is to examine the nature of aircraft surface motion on the airport surface during normal operations. Twelve hours of radar data, gathered by MIT Lincoln Laboratories from Logan airport in Boston, were made available for this study. Specifically, the data included target position reports from the ASDE-3 surface surveillance radar and the ASR-9 radar from the near terminal airspace information. This data covers a variety of runway configurations, weather conditions, traffic levels and high or low visibility conditions.
The study is divided into three sections. The first one focuses on the runway, and examines occupancy times, exit velocities, exit usage and velocity profiles of the final approach and landing phase. The second section, analyzes fourteen runway-taxiway intersections. Results are presented for the crossing times and usage of these intersections. The analysis also focuses on relating crossing times and usage to crossing direction, runway configuration and aircraft size. Finally, average taxiway velocities and the overall taxiway usage is measured. Additionally, the role that the location of the taxiway segment as well as its length, plays in the variation of these velocities are examined. Where possible, this study includes means, standard deviations and sample sizes of the variables in question.
Thesis Supervisor : Dr. Robert W. Simpson
Acknowledgments
I would like to thank several people for their time and support throughout the process of writing this thesis. First of all, I would like to extend my sincere gratitude to Professor Robert Simpson, my thesis supervisor, for his constant support and guidance. I am truly grateful for the opportunity to have worked with him.
I would also like to thank MIT Lincoln Labs for providing the data for this thesis and in particular Jerry Welch, Ted Morin and Jim Eggert for assisting me in getting the data, answering my questions and providing me with many useful suggestions. Additionally, I would like to thank John Pararas, Dennis Mathaisel and Husni Idris for their help in developing the data processing software and the GMS interface.
I would also like to thank Professor Amadeo Odoni for his insightful remarks and Professor Peter Belobaba for teaching the Airline Management and Airline Econimics courses during my studies. I would also like to express my thanks to all my fellow classmates. My stay at the Flight Transportation Lab has been a rewarding experience thanks to them.
Finally, and most importantly, I would like to express my deepest gratitude to my parents for their continues love and support.
R. A. Cambridge, Massachusetts July, 1994
Table of Contents
A bstract ... 3 Acknowledgments ... 5 Table of Contents... 7 List of Tables... 9 L ist of Figures... 10 Chapter 1: Introduction... 14 1.1 Background... 14 1.2 Motivation... ... 16 1.3 Scope... 16Chapter 2: The Measurement Task... 18
2.1 Introduction ... 18
2.2 The Runway and Taxiway System... 19
2.3 Data Collection... 24
2.4 Available Data... ... ... 25
C hapter 3: Data Analysis... 29
3.1 Introduction... 29
3.2 Preliminary Data Processing... ... 30
3.3 Data Irregularities ... 35
3.4 Runway Analysis ... ... 36
3.4.1 Runway Occupancy Time During Landing... 36
3.4.2 Exit Use... ... ... 50
3.4.3 Exit Velocities... .. ... 58
3.4.4 Velocity Profiles... 70
3.4.4.1 Landing Velocity Profiles... 70
3.4.4.2 Final Approach Velocity Profiles... 83
3.5 Intersection Analysis ... ... 90
3.5.1 Intersection Crossing Times... 90
3.5.2 Intersection Use... 103
3.6 Taxiway Analysis... 106
3.6.1 Taxiway Average Velocity... 106
3.6.2 Taxiway Use... 110 Chapter 4: Conclusions ... 121 4.1 Introduction... 121 4.2 Runways... 122 4.3 Intersections ... 123 4.4 Taxiways ... 124
4.5 Directions for Future Research... 124
List of Tables
Chapter 2
2.2 The Runway and Taxiway System
Table 2.2 Runway Configurations at Logan Airport... 21
2.4 Available Data Table 2.4.1 Table 2.4.2 Table 2.4.3 Table 2.4.4 Table 2.4.5 Table 2.4.6 Table 2.4.7 Table 2.4.8 Table 2.4.9 Table 2.4.10 Table 2.4.11 Table 2.4.12 Table 2.4.13 Table 2.4.14 Table 2.4.15 Table 2.4.16 Table 2.4.17 Table 2.4.18 Table 2.4.19 Table 2.4.20 Runway Configuration for Data Block-1... Weather information for Data Block- ... Runway Configuration for Data Block-2... Weather information for Data Block-2... Runway Configuration for Data Block-3... Weather information for Data Block-3... Runway Configuration for Data Block-4... Weather information for Data Block-4... Configuration for Data Block-5... information for Data Block-5... Configuration for Data Block-6... information for Data Block-6... Configuration for Data Block-7... information for Data Block-7... Configuration for Data Block-8... information for Data Block-8... Configuration for Data Block-9... information for Data Block-9... Configuration for Data Block-10... information for Data Block-10... Runway Weather Runway Weather Runway Weather Runway Weather Runway Weather Runway Weather Chapter 3 3.2 Preliminary Data Processing Table 3.2.1 Typical Sample Information about a Target... 30
Table 3.2.2 Series of Nodes that Define the Airport Run. & Tax... 32
3.4.1 Runway Occupancy Time During Landing Table 3.4.1.1 : Average Occupancy Time During Landing... 36
Table 3.4.1.2 : Exits Links Runways 27, 9... 37
Table 3.4.1.3 : Exits Links Runways 33L, 15 R... . 37
Table 3.4.1.4 : Exits Links Runways 4L, 22R... . 40
Table 3.4.1.5 : Exits Links Runways 4R, 22L... . 40
3.4.2 Exit Use Table 3.4.2 Classification of Aircraft... ... 50
3.5.1 Intersection Crossing Times Table 3.5.1 Series of Links that Corresponds to Each Intersection... 92
3.5.2 Intersection Use Table 3.5.2 Number of Aircraft Using Each Intersection... 103
List of Figures
Chapter 2
The Runway 2.2.1 2.2.2 2.2.3and Taxiway System
Boston Logan International Airport -Location Map... 19
Runway and Taxiway Configuration -Logan Airport... 20
Taxiway System Around the Terminal Area... 23
Preliminary Data Processing
3.2.1 Logan Airport -GMS Format... 3.2.2 Node-Link Network... ...
Runway Analysis
3.4.1 Runway Occupancy Time During Landing
3.4.1.1 : Runway 33L/15R... 3.4.1.2 : Runway 27/9...
3.4.1.3 : Runways 4R/22L, 4L/22R and 15L/33R... 3.4.1.4 : Aver. Occup. Time During Landing Run 4R Block 1... 3.4.1.5 : 3.4.1.6: 3.4.1.7 : 3.4.1.8: 3.4.1.9: 3.4.1.10: 3.4.1.11: 3.4.1.12: 3.4.1.13: 3.4.1.14: 3.4.1.15: 3.4.1.16: 3.4.2 Exit Use 3.4.2.1 : Exit 3.4.2.2 : Exit 3.4.2.3 : Exit 3.4.2.4 : Exit 3.4.2.5 : Exit 3.4.2.6 : Exit 3.4.2.7 : Exit 2.4.2.8 : Exit 3.4.2.9 : Exit 3.4.2.10: Exit 3.4.2.11: Exit 3.4.2.12: Exit 3.4.2.13: Exit 3.2 Figure Figure 3.4 Figure Figure Figure Figure Figure Figure Figure Figure Figure Figure Figure Figure Figure Figure Figure Figure Figure Figure Figure Figure Figure Figure Figure Figure Figure Figure Figure Figure Figure Run Run Run Run Run Run Run Run Run Run Run Run Run Run Run Run Run Run Run Run Run Run Run Run Run 4R Block 6... 4R Block 9... 22L Block 8... 22L Block 10.... 27 Block 2... 27 Block 3... 27 Block 8... 27 Block 10... 33L Block 2... 33L Block 5... 15R Block 4... 15R Block 7... 4R Block 1... 4R Block 6... 4R Block 9... 22L Block 8... 22L Block 10.... 27 Block 2... 27 Block 3... 27 Block 8... 27 Block 10... 33L Block 2... 33L Block 5... 15R Block 4... 15R Block 7... 33 34 38 39 41 43 43 44 45 45 46 46 47 47 48 48 49 49 51 51 52 53 53 54 54 55 55 56 56 57 57 2.2 Figure Figure Figure
Chapter 3
Use per Aircraft Class Use per Aircraft Class
Use All Classes Use All Classes Use per Aircraft Class Use per Aircraft Class
Use All Classes Use All Classes Use per Aircraft Class
Use per Aircraft Class Use per Aircraft Class Use per Aircraft Class Use per Aircraft Class
3.4.3 Exit Velocities
Figure 3.4.3.1 : Average Exit Vel All Classes Figure 3.4.3.2 : Figure 3.4.3.3 : Figure 3.4.3.4 : Figure 3.4.3.5 : Figure 3.4.3.6 : Figure 3.4.3.7 : Figure 3.4.3.8 : Figure 3.4.3.9 : Figure 3.4.3. 10: Figure 3.4.3.11: Figure 3.4.3.12: Figure 3.4.3.13:
Figure 3.4.3.14: Average Exit Vel per Aircraft Clas Figure 3.4.3.15: Figure 3.4.3.16: Figure 3.4.3.17: Figure 3.4.3.18: Figure 3.4.3.19: Figure 3.4.3.20: Figure 3.4.3.21: Figure 3.4.3.22: 3.4.4 Velocity Profiles
3.4.4.1 Landing Velocity Profiles
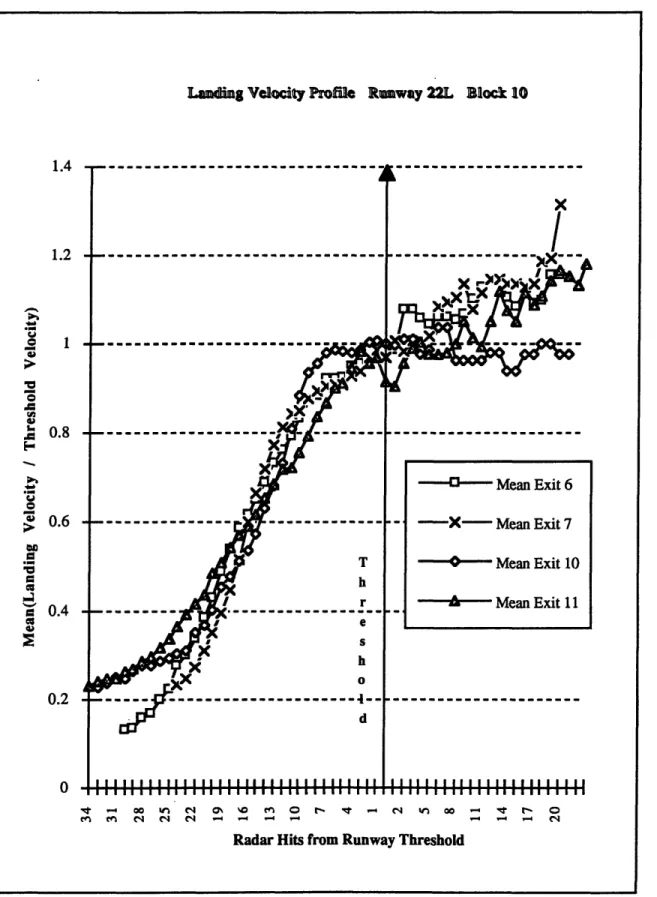
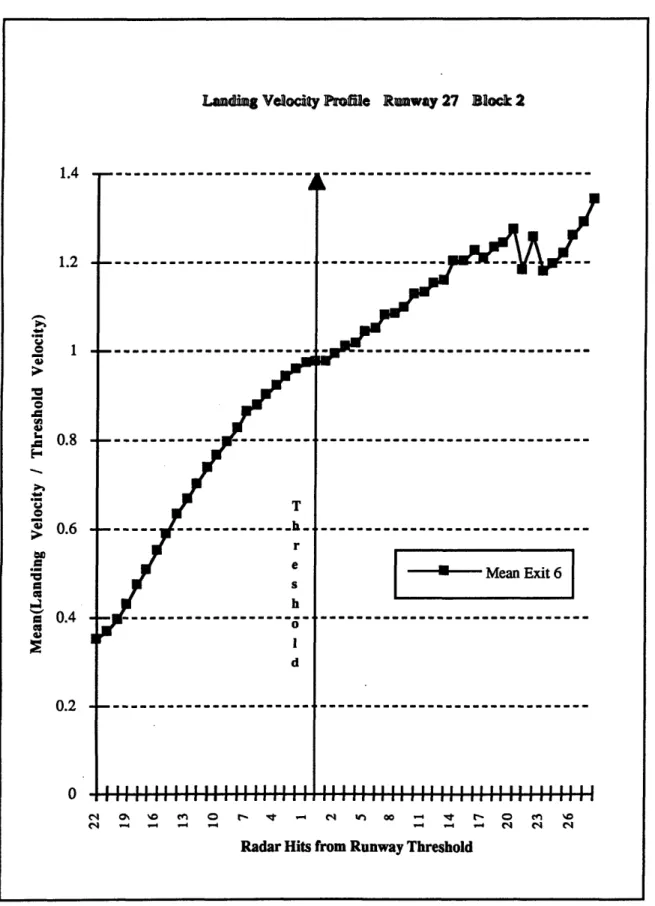
Figure 3.4.4.1.1: Landing Velocity Profiles Figure 3.4.4.1.2: Figure 3.4.4.1.3: Figure 3.4.4.1.4: Figure 3.4.4.1.5: Figure 3.4.4.1.6: Figure 3.4.4.1.7: Figure 3.4.4.1.8: Figure 3.4.4.1.9: Figure 3.4.4.1.10: Figure 3.4.4.1.11: Figure 3.4.4.1.12: Figure 3.4.4.1.13: Figure Figure Figure Figure Figure Figure Figure Figure Figure Figure Figure Figure Figure 3.4.4.2 3.4.4.2.1: 3.4.4.2.2: 3.4.4.2.3: 3.4.4.2.4: 3.4.4.2.5: 3.4.4.2.6: 3.4.4.2.7: 3.4.4.2.8: 3.4.4.2.9: 3.4.4.2.10: 3.4.4.2.11: 3.4.4.2.12: 3.4.4.2.13:
Final Approach Velocity
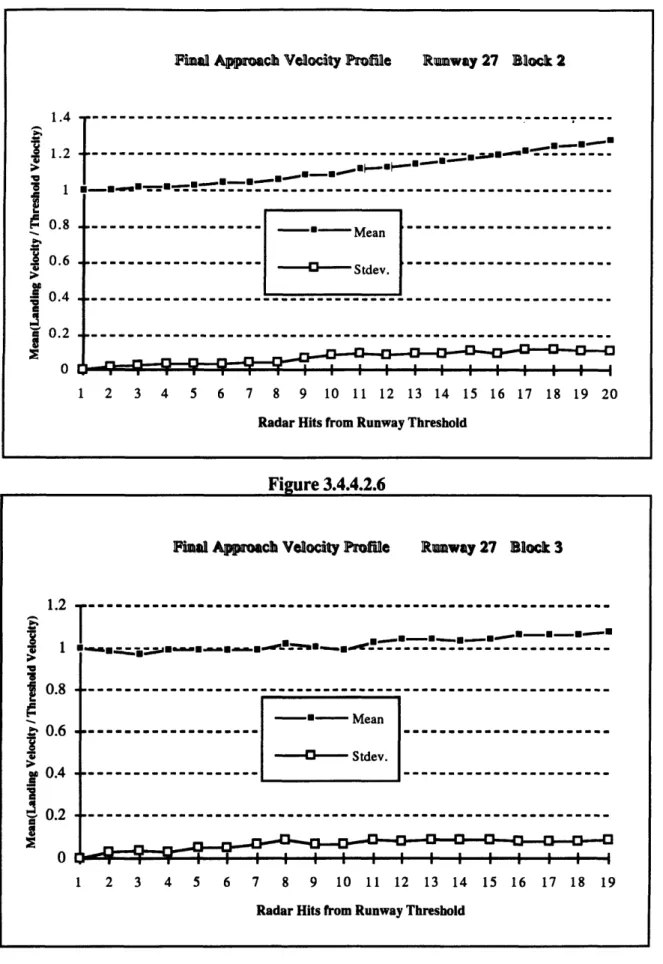
Final Approach Velocity Profiles
I Run 4R Block 1... Run 4R Block 6... Run 4R Block 9... Run 22L Block 8... Run 22L Block 10.... Run 27 Block 2... Run 27 Block 3... Run 27 Block 8... Run 27 Block 10... Run 33L Block 2... Run 33L Block 5... Run 15R Block 4... Run 15R Block 7... s Run 4R Block 1... Run 4R Block 6... Run 22L Block 10.... Run 27 Block 2 ... Run 27 Block 10... Run 33L Block 2... Run 33L Block 5... Run 15R Block 4... Run-15R Block 7 ... Run 4R Block 1... Run 4R Block 6... Run 4R Block 9... Run 22L Block 8... Run 22L Block 10.... Run 27 Block 2... Run 27 Block 3... Run 27 Block 8... Run 27 Block 10... Run 33L Block 2... Run 33L Block 5... Run 15R Block 4... Run 15R Block 7... profiles Run 4R Block 1... Run 4R Block 6... Run 4R Block 9... Run 22L Block 8... Run 22L Block 10.... Run 27 Block 2 ... Run 27 Block 3... Run 27 Block 8... Run 27 Block 10... Run 33L Block 2... Run 33L Block 5... Run 15R Block 4... Run 15R Block 7... 3.5 Intersection Analysis 58 59 59 60 60 61 61 62 62 63 63 64 64 65 66 66 67 67 68 68 69 69 70 71 72 73 74 75 76 77 78 79 80 81 82 83 84 84 85 85 86 86 87 87 88 88 89 89
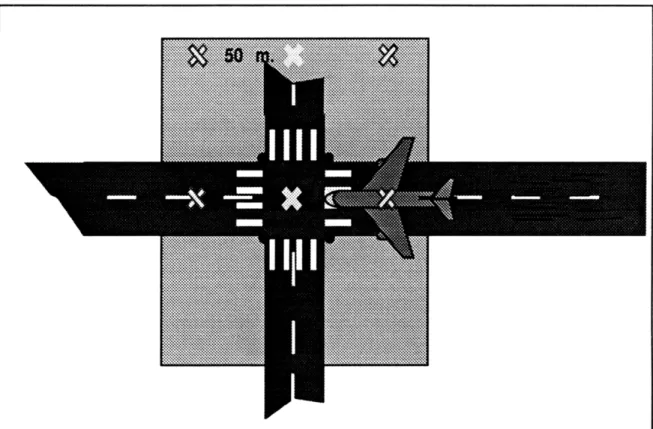
3.5.1 Intersection Crossing Times
3.5.1.1 : Typical Intersection... ...
3.5.1.2 : Logan's Intersections...
3.5.1.3 : Average Intersection Crossing Times Block 1...
3.5.1.4 : Block 2... 3.5.1.5 : Block 3... 3.5.1.6 : Block 4... 3.5.1.7 : Block 5... 3.5.1.8 : Block 6... 3.5.1.9 : Block 7... 3.5.1.10: Block 8... 3.5.1.11: Block 9... 3.5.1.12: Block 10...
3.5.1.13: Avg. Inters. Cros. T. In Dir Int. : 10, 11, 12, 13, 14...
3.5.1.14: Avg. Inters. Cros. T. Out Dir Int. : 10, 11, 12, 13, 14...
Figure Figure Figure Figure Figure Figure Figure Figure Figure Figure Figure Figure Figure Figure. Figure Figure. Figure Figure Figure. Figure
Int.
Int.
Class Class Class Class 3.5.2 Intersection UseNumber of Aircraft Using Each Intersection 3.5.2.1 : Configuration : Arr: 4R, 4L 3.5.2.2 : Configuration : Arr : 33L 3.5.2.3 : Configuration : Arr : 27, 22L 3.5.2.4 : Configuration : Arr: 15R Average vel Average Vel Average Vel Taxiway Use Taxiway use I: Taxiway use Z: 3: 4: 5: 5: 7: 3: ocity in ocity in ocity in 6... 6... Block 1 ... ... Block 2... Block 4... Block 5... Dep Dep Dep Dep :9, 4L... :33L, 22R... : 22R, 22L... :9, 15R... Taxiw ays...
Taxiways Various Lengths...
Taxiways Various Locations ...
Taxiways Various Loc.&Leng..
Inner and Outer Taxilane
Supporting Taxiways Block 1... Block 2... Block 3... Block 4... Block 5 ... Block 6... Block 7... Block 8... Block 9... Block 10... Block 1... Block 2... Block 3... Block 4... Block 5... Block 6... Block 7... Block 8... Block 9... Block 10... 90 91 94 94 95 95 96 96 97 97 98 98 99 99 100 100 101 101 102 102 104 104 105 105 107 108 109 109 111 111 112 112 113 113 114 114 115 115 116 116 117 117 118 118 119 119 120 120 3.5.1.15: 3.5.1.16: 3.5.1.17: 3.5.1.18: 3.5.1.19: 3.5.1.20: Avg. Avg. Avg. Avg. Avg. Avg.
Inters. Cros. T. Int Dir Inters. Cros. T. Out Dir Int.. Cros. T. per Aircraft Int.. Cros. T. per Aircraft Int.. Cros. T. per Aircraft Int.. Cros. T. per Aircraft Figure Figure Figure Figure 3.6 Figure Figure Figure Figure Figure Figure Figure Figure Figure Figure Figure Figure Figure Figure Figure Figure Figure Figure Figure Figure Figure Figure Figure Figure Taxiwa3 1 Analysis
'axiway Average Velocity
Average Velocity in 3.6.1 3.6.1.1 3.6.1.2 3.6.1.3 3.6.1.4 3.6.2 3.6.2.1 3.6.2.2 3.6.2.3 3.6.2.4 3.6.2.5 3.6.2.6 3.6.2.7 3.6.2.8 3.6.2.9 3.6.2.1( 3.6.2.11 3.6.2.1 3.6.2.1 3.6.2.1 3.6.2.1 3.6.2.1( 3.6.2.1' 3.6.2.1 3.6.2.15 3.6.2.2(
Chapter 1
Introduction
1.1
Background
After forty years of regulation by the Civil Aeronautics Board, in 1978 Congress enacted the Airline Deregulation Act, which phased out economic regulation of the industry. In the years following deregulation many new carriers entered the airline industry. The old and the new airlines soon started servicing new city-pair markets, offering expanded services and competitive fares. These developments resulted in a significant increase in the overall traffic levels. In order to provide higher schedule frequencies and more efficient use of their fleet, the airlines soon abandoned the point-to-point route networks and adopted hub and spoke network systems that concentrated traffic around hub airports.
The increased passenger traffic coupled with the concentration of this traffic around, led to congestion within the available airspace and subsequent delays in these hub airports.
Due to the aforementioned reasons, the need to develop means for greater efficiencies in aircraft operations became apparent. Major efforts are undertaken today, focusing on the use of advanced technologies for airborne and ground traffic control systems in a concentrated effort to decrease the unused airspace and increase airport capacity while simultaneously maintaining or even increasing safety levels. One such area of focus is the airport surface, where especially in periods of low visibility, aircraft experience significant delays on their way to the gate or departing runway. During the last decade, various systems have been conceptualized and are currently under development which deal with problems controllers and pilots face every day on the airport surface.
The major objective of these surface traffic systems is to enhance the safety, capacity, and productivity of these airports, while at the same time reducing delays and the workload of both controller and pilot. This is accomplished via the development of advanced communications, surveillance and automation techniques for use in the control towers of major airports. Various subsystems address isolated problems such as runway incursions, taxiway guidance and surface traffic surveillance.
Airport safety is intrinsically linked to capacity. The spacing between aircraft necessarily reduces with increasing capacity, and safety suffers unless the reduction in spacing is done carefully. The suggested long term solution is a surface traffic management system that will address all these subsets of problems in an integrated manner and safely control the airport surface area. Such a system must address the capacity issues of ground congestion and effective departure sequencing through the
implementation of efficient routing and sequencing of aircraft on the surface, thereby the system would decrease delays and increase airport safety. In order for such a system to be successfully developed and implemented, information about the nature of aircraft motion on the airport surface must be detailed.
1.2
Motivation
Few studies have been conducted to date on aircraft motion on the airport surface during normal operations. In 1960 the Airborne Instruments Laboratory at Cornell University published a series of reports about velocities and accelerations of aircraft at Kennedy Airport in New York. Later, in 1972 the Flight Transportation Laboratory at MIT studied the air-side activity of Boston Logan and Atlanta airports. Measurements were taken for runway occupancy times, velocity profiles along the runways, taxiway speeds and intersection delays. Unfortunately, most of the aircraft that operated during those years are not in service today. Additionally, the data was gathered solely in periods of good visibility and therefore the data of these reports is of little value today. It is therefore of vital interest to measure the surface movements of today's aircraft as completely and effectively as possible.
1.3
Scope
An aircraft engages in a series of non-uniform and complex maneuvers on its way to the gate or the departing runway. A departing aircraft for example, after getting the clearance to push back from the gate, has to follow a taxi route that will lead it to the takeoff runway. This path varies depending on the layout of the taxiway system, the
current runway configuration, and the location of the gate. It might be short or long and might involve a considerable number of turns, stops, taxiway and runway crossings, and varying length segments of straight taxing. Along this route, the pilot must be constantly be aware of the position, not only of his own aircraft, but also of nearby aircraft, ground vehicles (or even terminal buildings) in order to taxi safely and avoid any collisions. The ability of the pilot to successfully taxi along the path depends on various factors. These include the type (size) of aircraft that the pilot operates, the amount of traffic at that particular instant at the airport, the surface visibility, the weather and surface conditions, and the familiarity that the pilot might have with the specific taxiway system. We must remember also, that the pilot during his taxi, is usually assisted by the ground controller who directs him along his taxi route and provides him with information about surrounding obstacles. It is important to note though, that the pilot is the one who makes the final decisions and may override the controllers directions. For example, a controller's request for a landing aircraft to use the first available exit can be ignored, or the pilot may insist on taxiing to the starting end of a runway rather than start from an intermediate point.
Such factors as the human element cannot easily be quantified and often introduce variance into the events that we want to measure, and therefore must be taken in to account in the final analysis. Among many surface motion variables that can be measured, those of interest are: the approach speed of a landing aircraft, its landing speed profile during roll-out, the runway occupancy time, the exit used, the exit velocity, the time required to cross runway intersections, and the taxiing velocities on different segments of the taxiway system. The analysis of these variables in conjunction with the major factors that affect them will be the focus of this thesis.
Chapter 2
The Measurement Task
2.1
Introduction
The first section of this chapter describes the existing runway and taxiway system at Logan airport in Boston so the reader can get a better understanding of the airport layout and better relate the measured variables. The second section, discusses the main elements of the data collection method that was employed. Finally, the last section provides information about the different days that the data was collected. Included in this information, is a description of the weather and surface conditions as well as any particular events that occurred during the collection period and which might be of interest in the later stages of the analysis.
2.2
The Runway and Taxiway System
Boston Logan International Airport lies at the edge of Boston harbor, surrounded by water in the majority of its perimeter. The commercial and residential area of East Boston is adjacent to it while the Winthrop area lies across the harbor (Figure 2.2.1).
Figure 2.2.1
Logan is the dominant airport ( 70 % of the passenger traffic 1 ) in a regional airport system that also includes airports serving Hartford, Manchester, Worcester, Hyannis, Portland, and Providence. It has five runways with four of them (4L, 4R, 33R and 27)
1 Boston Logan International Airport Capacity Enhancement Plan, October 1992 published by the FAA.
capable of handling large transport aircraft. Three of these runways (4R, 33R and 27) have instrument landing capability. The configuration of the runways is rather complex (Figure 2.2.2), as they intersect six times with each other.
t
I,--I
Typically, peak hour demand is 100 operations per hour. The serving capability depends on the runway operating configuration, and can vary from 46 operations per hour during the most restrictive IFR conditions to 120 operations per hour during good VFR weather2 . This fluctuation is primarily due to the lack of parallel runways within adequate spacing between them for simultaneous IFR approaches under certain weather conditions. Consequently, at certain times all landings must be sequenced into a single arrival stream, thus lowering the airport serving capability. The high proportion of commuter aircraft operations at Logan further deteriorates the airport effective capacity, as larger separations maybe needed under certain runway configurations to safely accommodate these smaller sized aircraft due to the wake turbulence considerations during mixed (in terms of size) operations. In addition, in order to keep the noise levels that the nearby communities experience within reasonable levels, the Massachusetts Port Authority has imposed certain regulations that further complicate aircraft operations. Specifically, only certain runway configurations can be used at night and airlines are required to conduct a specific portion of their Logan operations in Stage 3 equipment3 .
The configurations4 that are used most often at Logan are:
Table 2.2
Configuration VFR IFR
Arrivals Departures Arrivals Departures
1 4L & 4R 4L, 4R & 9 4R 4L, 4R & 9
2 22L & 27* 22R & 22L 22L 22R & 22L
3 33L & 33R 27 & 33L 33L 33L
4 9, 15R & 15L* 15R & 9 15R 15R & 9
* These configurations employ hold-short procedures.
2,4 Boston Logan International Airport Capacity Enhancement Plan, October 1992 published by the FAA. 3 Summary of Logan's Noise Abatement Rules and Regulations published by Massport.
Due to the complexity of the runway system, various procedures for intersection departures and hold-short arrival are often used.
The taxiway system (Figure 2.2.3) consists of two main circumferential taxi lanes (inner & outer) around the perimeter of the terminal building area with smaller taxiway segments supporting the traffic towards the gate area. Longer taxiways also exist to feed the outbound traffic to the departure runways, and the incoming traffic to the terminal area. Runways 4R, 33L/15R and 27 have additional high speed exits conveniently located so that the landing aircraft can vacate the runway as soon as possible, and then there are various common taxi paths from these exits to the gate areas. For example, the high speed exit most commonly used for runway 4R is exit 12 (link A29-A56) , and crosses runway 4L (used only for turboprop landings and takeoffs in this case) before joining taxiway N (link A74-A75) to return to the terminal area.
Rotate) Zom n Zoom Ou Full View) Redraw) Display Edit Quit Zooming to full airport view...
819 ]A A ,IC= 80 ~9 8 1 85 A97 A9 AGO C'LL 9 e D APR f**
Developed by the Fliht Tran ation Laboratory, IT, Cambridge, assachusett. Dfeveloped by the Flight Transportation Laboratory, MIT, Cambridge, Massachusetts.
2.3
Data Collection
In the past, the techniques used to study the aircraft motion on the surface of airports fell into two major categories : those that involved direct observation of the traffic through a number of observers out in the airfield (the MIT study) and those involving indirect observation through the use of radar or other types of monitoring equipment.
Each one of the two methods has its own advantages and disadvantages. The indirect radar method is more complex and requires expensive equipment but is fairly accurate, imposes no interference in the traffic, and once operational can be employed for long time periods. On the other hand, the other method (direct observation) is less complex but requires a large number of observers, often in coordination with each other, which involves intense manual effort and as one might suspect, and provides changing levels of accuracy. Nevertheless, both methods require the authorization and cooperation of the local FAA and airport authorities.
Luckily, in our case the MIT Lincoln Laboratories had installed an experimental ground surveillance system that gathered data from Logan airport in Boston. Specifically, the data included target position reports from the ASDE-3 surface surveillance radar and the ASR-9 radar from the near terminal airspace traffic information. These two outputs of the surveillance sensors were integrated by a combined tracking system that also provided derived information about the velocity, heading and acceleration of the targets1. A simultaneous interface with the ARTS computer was often used and then information about the aircraft type and flight number was made available.
2.4
Available Data
As mentioned earlier, Lincoln Laboratory had installed a surface traffic data gathering system at Logan airport in Boston in 1993 for the development and testing of a runway status lights network (ASTA-1) to help prevent runway incursions. As much as ninety hours of traffic data were collected for this purpose. Approximately twelve of these ninety hours were preprocessed by Lincoln Labs, and made available to this study for further processing and analysis of the aircraft surface movements. These twelve hours came in the form of 10 separate blocks of data, each corresponding to an individual data gathering session. These blocks cover a variety of runway configurations, weather conditions, traffic levels, and high or low visibility conditions. A brief description of the available blocks of data follows :
Block-i
Day: Thursday, April 1, 1993 Time: 16:00-17:15 Local
Runway Configuration Table 2.4.1
Arrivals Departures Switched to Arrivals Departures
4R 9, 4L 4R 4R
Weather / ATIS Table 2.4.2
Temp Ceiling Visibility Wind Comments
n/a 500ft ovc 2 miles 50*@ 15knots Rain & Fog
n/a 1800ft ovc 2 miles 40*@24knots Rain & Fog --> Thunderstorms n/a 1100ft ovc 2 miles 400@ 20knots Rain & Fog --> Thunderstorms
Block-2
Day: Friday, March 26, 1993
Time: 10:35-11:35 Local
Runway Configuration Table 2.4.3
Arrivals Departures Switched to Arrivals Departures
4 9 33L, 27 33L, 22R
Weather / ATIS Table 2.4.4
Temp Ceiling Visibility Wind Comments
55 * F 800ft. scat 7 miles 160"@7knots Heavy Traffic, All Taxiways OK.
Block-3
Day: Wednesday, April 21, Time: 17:35-18:35 Local
Runway Configuration
Weather / ATIS
Temp Ceiling Visit
65 * F 2500ft ovc 15mi
Table 2.4.5
Arrivals Departures
27 22R
Table 2.4.6
iility Wind Con
les 180"@ l7knots Heal iments
vy Traffic.
Block-4
Day: Tuesday, March 26, 1993 Time: 13:15-14:15 Local
Runway Configuration Table 2.4.7
Arrivals Departures
15R 9
Weather / ATIS Table 2.4.8
Temp Ceiling Visibility Wind Comments
50 * F Sunny 12 miles 140*@7knots Busy Traffic, later quieting down
j
Blc~-5
Day: Thursday, March 11, 1993
Time: 14:50-16:10 Local
Runway Configuration Table 2.4.9
Arrivals Departures
33L 22R, 33L
Weather / ATIS Table 2.4.10
Temp Ceiling Visibility Wind Comments
40 * F 5500ft 15 miles 3000@ 15knots Snow in the morning
Block-6
Day: Wednesday, March 31, 1993 Time: 19:15-20:15 Local Runway Configuration Weather / ATIS Table 2.4.11 Arrivals Departures 4R; 4L 9, 4L Table 2.4.12
Temp Ceiling Visibility Wind Comments
42 "F 6500ft 15 miles 110"@ 8knots Snow in the morning
Block-7
Day: Saturday, March 13, 1993 Time: 09:45-10:45 Local
Runway Configuration Table 2.4.13
Arrivals Departures
15R 9, 15R
Weather / ATIS Table 2.4.14
Temp Ceiling Visibility Wind Comments
31 * F 5000 ft 5 miles 127" @ 8knots ILS approaches 15R
33 * F 3800 ft 12 miles 110"@ l7knots ILS approaches 15R, light snow 32 * F 1500ftovc 1 mile 110"@ 15knots ILS approaches 4R, light snow
Day: Wednesday, April 21, 1993 Time: 19:50-20:50 Local
Runway Configuration Table 2.4.15
Arrivals Departures
22L, 27 22R, 22L
Weather / ATIS Table 2.4.16
Temp Ceiling Visibility Wind Comments
59 F 2500ft scat 15 miles 225@11llknots n/a
Day: Tuesday, March 30, 1993 Time: 07:45-08:45 Local
Runway Configuration Table 2.4.17
Arrivals
4
Departures
9
Weather / ATIS Table 2.4.18
Temp Ceiling Visibility Wind Comments
43 * F 700 ft 2 miles 40*@ 12knots Light drizzle & Fog
Block-10
Day: Wednesday, April 21, 1993 Time: 09:00-10:02 Local
Runway Configuration Table 2.4.19
IArrivals Departures
22L, 27 22R, 27
Weather / ATIS Table 2.4.20
Temp Ceiling Visibility Wind Comments 60 * F 2500ftovc 15 miles 225"@ l6knots n/a
Chapter 3
Data Analysis
3.1
Introduction
The first section of this chapter describes the preliminary data processing that was undertaken along with various problems that were encountered due to several data irregularities. The second section, provides a detailed runway analysis that includes information about occupancy times, exit velocities, exit use, and landing velocities profiles. The next section analyzes the intersection crossing times and the particular level of use of each intersection. Finally, an analysis of the taxiway system is presented.
3.2
Preliminary Data Processing
As soon as the ten blocks of collected data were received, all the possible ways to process and analyze the available information were considered. Each block of data consisted of information about all the targets that were picked up by the ASDE-3 and ASR-9 radar during each gathering session. Every target had its own ASDE and target ID and contained among other things, position information in terms of x and y coordinates with respect to the radar location, its derived velocity, acceleration, and heading, and the corresponding time stamp for specific data items, measured in seconds from 0:00 GMT. In addition, some targets included information about the aircraft type and airline flight number (Table 3.2.1).
Tt:11584 Length: 27 Start time: 57995.3 End time: 58588.6 States: DEP TAX STP
- -. (deg) (knots) (g's)
Target ASDE Time Stamp State ASF Position Heading Speed Accel. Flight Type
ID ID ID Num
11584 5575 57995.375 1 TAX 993 North: -82.7.07 East: 242.13 10.7 13.9 0.0874 SR188 B747
11584 5575 57997.126 2 TAX g93 North: -827.22 East: 249.34 31.3 10.1 -0.0552 SR188 B747
11584 5575 57998.878 3 TAX 3 North: -802.69 East: 252.97 14.8 17.9 0.113 SR188 B747
11584 5575 58000.629 4 TAX ,93 North: -793.17 East: 256.41 14.9 15.1 0.0166 SR188 B747
11584 5575 58002.382 5 TAX 76 North: -783.10 East: 258.79 12.3 12.5 -0.042 SR188 B747 11584 5575 58004.134 6 TAX 76 North: -769.83 East: 263.59 17.1 14 0.0116 SR188 B747 11584 5575 58005.885 7 TAX g76 North: -756.49 East: 267.36 16.9 15.2 0.0215 SR188 B747 11584 5575 58007.637 8 TAX g76 North: -742.40 East: 271.39 16.4 16.4 0.0215 SR188 B747
11584 5575 58009.388 9 TAX g76 North: -732.36 East: 276.04 22 13.9 -0.0348 SR188 B747
Table 3.2.1 : Typical sample information about a target inside a block of data.
The individual position reports for every target, constituted a very large amount of information, and in order to be useful, had to be related again to the surface layout of the airport. A graphical replay of the information of the available data was needed since it would enable us to visualize the actual aircraft motion, check the analysis output, and explain any possible counterintuitive findings.
Recently, the Flight Transportation Laboratory at MIT had designed and developed an aircraft Ground Motion Simulator (GMS) to realistically simulate airport ground activity. The GMS simulates the environment at any arbitrary airport and provides high quality graphic views, in color on UNIX workstations. This system has an internal aircraft position generator that provides the simulation with motion updates. It was decided to use the GMS system for visualization purposes, after bypassing its position generator function and writing the necessary code to provide it with the actual aircraft motion information from the Lincoln Laboratory data.
As a second step, the Logan airport geometrical layout along with its features (terminal buildings, hangars, etc.) had to be inputted in the GMS system (Figure 3.2.1). Next, the underlying network of nodes and links had to be inserted in GMS format data files in order to define the runways and taxiways of the airport (Figure 3.2.2). Table 3.2.2 lists the series of nodes that define every taxiway. The next step was to write the computer code that will associate every aircraft position with an airport link in order to be able to automate the data reduction process. Various computer subroutines were also written to perform other preliminary analyses of the recorded data. As a result, computed values were obtained for approach speeds, exit velocities, intersections crossing times, and various taxiway velocities. A more complete discussion of these values, and their significance will start in the next chapter. During the analysis process various routines had to be modified in order to overcome some irregularities in the collected data.
Taxiway
Series
of
Nodes
U B08 A92
V B09 A93
Y A55 A56 A29
INNER A97 A98 A80 A99 BOO B01 B02 B03 B04 B05 B06
B07 B08 B09 A95 A96
OUTER A97 A79 A81 B10 A82 A83 A84 A85 A86 A70 A60
AOO A10 A20 A50 A91 A92 A93 A94 A95 A96
A80 B10 B11
2 A71 A72
A20 A40 N2 A39 A37 A31 A25
1 A37 B14 A38
B04 A60 A46 A24 A18 A17 A16 A12
2 A33 A32 A31
A18 A19 A01 A02 A04 A07 A90 A06
A A73 A59
B06 A10 A43 A44 A09 A08
NB A63 A64
2A A32 A26
B03 A70 A47 A48 A23 A22 A21 A18
01 B14 B13
A49 A48 A48 A14
A98 A81 A78
A79 A77
BOO A83 A75 A74 A73 A71 A69 A66 A63 A62
A A02 A03
A44 A45
B A04 A05
B02 A86 A51 A52
A66 A65
00 A99 A82
B05 AOO A43 A35 B13 A34 A33 A27
01 B06 A50
B02 A86 A85 A53
Runway
4R 22L A61 A62 A64 A65 A57 A29 A14 A23 A49 A24
A45 A09 A28 A27 A26 A25 A87 4R
4L 22R A68 A67 A72 A59 A54 A53 A51 A47 A46 A43
A42 A88 Nl A39 4L
15R 33L All A12 A13 A01 A21 A22 A14 A52 A53 A75
B11 A78 A77 A76 15R
15L 33R A58 A57 A55 A54 A74 A89 15L
27 A15 A06 A05 A03 A13 A17 A08 A28 A36 A34
A38 B14 N1 N2 9
*
Q co
Rotate) Zoom In) Zoom Out) Full View) Redraw Display ) Qut)
Starting simulation...
JI.._LJ,J J
3.3
Data Irregularities
Due to the performance of the radar tracking system on the surface of the airport, frequently during the gathering session, an aircraft target was dropped and then picked up later on by the radar. The result was that in the data file, two different targets with separate IDs (identification numbers) could in fact have been the same aircraft, and the intermediate information about the aircraft movement between the time that the aircraft was dropped from the radar and then picked up again was not available. Another irregularity was the fact that not all targets had information about the aircraft type or flight number. This limited the classification of results according to aircraft size to only those targets where that information was available. In addition, this prevented us from identifying targets that were not aircraft but rather other ground vehicles moving on the airport surface and therefore might have infected our results if they were on the runways or taxiways. Indeed, Blocks 3, 8 and 9 did not include any information about aircraft types and flight number because the required computer tap was not in service during the collection period.
3.4 Runway Analysis
3.4.1 Runway Occupancy Time During Landing
Runway occupancy time is the time over which a runway is effectively blocked (occupied) to any other traffic by a single landing or departing aircraft. As such, it potentially affects the traffic capacity of that runway. In the case when the runway is used only for landings, the runway occupancy time and its potential variations currently do not significantly affect the overall runway capacity as the inter-arrival radar separation standards of the approaching aircraft cause spacing which is almost always greater than the occupancy time. On the other hand, if the runway is used for mixed arrivals and departures, the landing occupancy time becomes more critical. In that case, the shorter the landing occupancy time, the more the time allowed to insert a takeoff between landings. This results in higher runway operational capacity, and smaller delays for the departing aircraft.
Average Occupancy Time During Landing
Runway II Data Block Figure
4R 1,6,9 1, 2, 3 4L n/a n/a 22R n/a n/a 22L 8, 10 4, 5 27 2,3,8,10 6,7,8,9 9 n/a n/a 33R n/a n/a 33L 2, 5 10, 11 15R 4, 7 12, 13 15L n/a n/a Table 3.4.1.1
The following tables (3.4.1.2 to 5) correlate each exit link of every runway from the GMS airport layout (Figure 3.4.1.1 to 3) to an exit number for the graphs that follow.
Exit Number
Link
Runway 27
Runway 9
I
1
12
A06-A90
2i
11 A05-A04 3 10 II A03-A024
I
9
11
A13-A01
5 JI 8 11 A17-A18 6 7 A08-A09 7 6 A09-A288
1F
5
11
A36-A35
9
4
II
A34-B
13 10 3 B14-A3711
1
2
N1-A39
12 1II
N2-A40 Table 3.4.1.2Exit Number Link
Runway 33L Runway 15R 1
ii
14 A12-A16 2 13 A13-A17 3 12 A01-A19 4 11 A21-A18 5Jj
10I
A22-A23 6 9 A14-A23 7 IL 8 1 A14-A488
1
7
II
A52-A51
9
II
6II
A53-A51 10 5 A53-A85 11I
4
A 75-A83 12 3 B11-B1013
II
2
1
A78-A81
14 1 II A77-A79 Table 3.4.1.3Rotat) Zoom n) ZoomOut) FullView) Redraw) Display r) Edit t)
Zooming to full airport view...
29
00 A A7 12 Al
t .A97.~ .J e
Rotate) Zoomn) ZoomOut) FullView) Redraw) Display r) Edit r- it C] We Zooming out by 1.50... -Q -J AD 19 J4 II .. T LT J
Exit Number Link Runway 4L Runway 22R 1 14 A39-N2 2 13 N1-N2 3 12 A42-A20
4
11
A43-A10
5 10 A43-A00 6 9 A46-A607
8
I
A47-A70
8 7 A51-A869
6
A53-A75
10 5 A53-A85 11 4 A54-A7412
3
I
A59-A73
13 2 A72-A71 14 1 A67-69 Table 3.4.1.4Exit Number Link
Runway 4R Runway 22L 1 16 A12-A16 2 15 A26-A32 3 14 A27-A33 4 13 A28-A36 5 12 A09-A44 6 11 A45-A44 7 10 A24-A46
8
9
A49-A48
9
8
1
A23-A48
10
7
]
A14-A48
11 6I
A14-A52
12 5 A29-A56 13 II 4 A57-A5514
II
3
L
A65-A66
15 2 A64-A63 16 1 A62-A63 Table 3.4.1.5Rotate Zoom Zoom Out Full View Rd Display Rotating airport by 30 degrees..
9
CaUe
SQ
t
The occupancy time during landing is measured from the moment the aircraft is over the runway threshold until the time it has turned in the exit and its tail has crossed the runway edge. Since our aircraft motion data was in the form of a series of discrete radar hits (approximately every 1.7 sec on the surface), the time between the first hit inside the first runway link and the first hit inside the exit link was used. In this way the size of the error was minimized. As expected before the analysis of the results, occupancy time tends to increase with the distance of the exit location from the runway threshold. This is normally true except in some cases ( Figure 3.4.1.4 Exit 12 in Runway 4R and Figure 3.4.1.7 Exit 11 in Runway 22L) where the particular angle of these exits allow aircraft to exit with higher speeds, and therefore maintain a higher average landing velocity resulting in occupancy times similar to exits that are located much closer to the threshold.
Figures 3.4.1.4 through 3.4.1.16 are graphs of the average occupancy time during landing for all aircraft types over a single runway and exit for every block of collected data. It seems there exits a relationship between aircraft weight and occupancy time. We observe that usually, the standard deviation of the occupancy times are quite small (5-10 seconds) for aircraft using the first exits, unlike for those using exits that are located further down the runway. Runway 27 under configuration 2 (arrivals 27 and departures 22R) displayed the lowest occupancy time (35 seconds) for aircraft exiting at high speed from exit 6 (Figures 3.4.1.9, 10, 12). In data block 8 (Figure 3.4.1.11), with similar weather conditions but at night (20:00-21:00), most aircraft used exit number 8 (low speed) and the occupancy times were significantly larger (53 seconds). The heavier aircraft tend to land with higher velocities and require longer landing distances and therefore exit further down the runway resulting in higher occupancy times. However aircraft using a given exit have similar occupancy times, independent of aircraft size.
Average Occupacy Time During Landing 8 Rauway 4R Block 1 80 m Avg.Oc.Tim. 20 70 l Stdev. 18 -- 16 60 - N __ - 14 - 5050 --12 4 0 40 10'S 8 u P 30 -20 Landing Direction 6 20-- 4< 10 2 0 0 t- w ON - - % Exit Figure 3.4.1.4
Average Occupancy Time Dring Landing Runway 4R
Block 6 80 Avg.Oc.Tim. 20 70 Stdev. 18 16 .' 60 1 - N 14 j50 12 , 40 - 10 C. 8 -30 20 Landing Direction 6 4 10 2 0 0 Exit Figure 3.4.1.5
Average Occupancy Time During Landing Rinway 4R Block 9
80 I I Avg. Oc. Tim. 20
18 70 - . Stdev. 16 0 60 14 - N S 50 12 O 40 - 10 or
e
8
=
p 30 6 Landing Direction 20 4 10 2 O *I 1 .1 I . A0--Cl tf \o r- X0 a- 0- C t\ Exit Figure 3.4.1.6 44Average Occupancy Time During Landing Runway 22L Block 8 80 -70 -60 -50 -40 -30 -20 -10 -0. Exit L D A.O.T. *Stdev. -N Landing Direction -Ii II I a*V)s rCt c
e-rL'Ur .1
L,.u a-Figure 3.4.1.7Ave ge Occupancy Time During Landing Runway 22L Block 10 A.O.T. 80 20 70 Stdev. - 18 .16 . S 60 - N 1 14 PZ 50 12 . Landing Direction S 40 10 S30 8 6 20 0 Exit Figure 3.4.1.8 h . 03
ziiSy~n~n r~~h~L"4~---- ~ .1--l~Y1~4 -- L-~1-*r-I~-.~m- - _~, _ .,.~.;1.-_1._,~.,__~,~__,_~_;____ ~__
~ P.M I - IM -- IM
IM-I *
Average Occupancy Time During La ding Runway 27 Block 2 Avg.Oc.Tim. Stdev. - - N 70
+
* 1IAvgI Oc.Ii mIi.
-20 -18 - 16 - 14 -12 - 10 -8 -6 .4 -2 0
80
70 60 50 : *L 1 2 3 4 5 6 7 8 9 10 11 12 Exit 40 -30 -20 -10 -0. Landing Direction rlrlrNo Figure 3.4.1.9K
Avg.Oc.Tim. Stdev. -U N Landing DirectionS-
* - . - I ]Average Occupancy Time During Landing
Block 3 -20 - 18 - 16 - 14 - 12 -10 -8 -6 -4 -2 -0 -4 -a sm L U h I - - I , I 1 2 3 4 5 6 7 8 9 10 11 12 Exit
sJ
Figure 3.4.1.10 e U t.. , < U 0 Sa-M . t_ 80 -70 - 60-50 -40 30 -20 -10 - 0-l~---~-rr~Fnl . _ I I - ~-~-~-~-~ - - --Ramway 27Average Occupancy Time During Landing
Figure 3.4.1.11
Average Occupancy Time During Landing Runway 27
Block 10 80 - Avg.Oc.Tim. 20 70 " Stdev. 18 16 . S60-- 6 - - N 14 50 12 40 10 t Landing Direction 8 30 6 2a 20 4-< 10 2 0 0 1 2 3 4 5 6 7 8 9 10 11 12 Exit Figure 3.4.1.12 Block 8 80 Avg.Oc.Tim. 20 70
-
Stdev. 18 16 N60 14 CL-50 12 I e 40 t 10 3 8 % 5 30 30 Landing Direction 6 20 4--10 2 0 0 1 2 3 4 5 6 7 8 9 10 11 12 Exit Runway 27Average Occupancy Time During Landing Raway 33L Block 2 80 Avg.Oc.Tim. 20 70 Stdev. 18 16 N 14 -50 , 12 S 40 10 t Z 30 Landing Direction 8 6 b 20 -
Z
-4 10 2 0 - 0 Cl en 0 -O N00 0 CqT Exit Figure 3.4.1.13Average Occupancy Time During Landing Ranway 33L
Block 5 Avg.Oc.Tim. 80 20 70 Sdoccup 18 E Landing Direction 16 60 16 14 50 12 40 10 o-08 30 6 co 20 4 z 10 - 2 m C 4 I \O - 00 0 C enTExit Exit Figure 3.4.1.14 -~Fpl)(-? 4~--- --^ c "i r;iic~anaaharrr;h-cu*ru4paaL~ia3~1
Average Occupancy Time During Landing Rnway 15R Block 4 "- 111888 l Avg.Oc.Tim. Stdev. -i--& -- -- NN
U.
I f M m a m -I ] I a 80 70 60 -50 -40 -30 -20 -10 -0* Exit Figure 3.4.1.15 Ruaway S15RAverage Occupancy Time DTring Landing Block 7 U U v 4J I-1.1. z *x ela S( 0 0N 00 r- CExit Exit Landing Direction Figure 3.4.1.16 49 0% 00 r- i lr m I a a E U: v t-D -20 -18 -16 - 14 - 12 , 10 8 -6 -4 -2 0 Landing Direction I IIIhhhI T-u- r\ -. I. ~ -aC w I.- I-Srv I-z 3 .8 3 B
1. .
B Pm m I3.4.2 Exit Use
Figures 3.4.2.1 through 3.4.2.13 represent graphically the exit use both for all aircraft that landed in every runway and for each aircraft (weight) class in every data block that information about the aircraft types were available. If information was available during data collection, the exit use per particular aircraft class is presented. Each aircraft is classified according to its weight into one of the following three classes :
Class
Weight Range ('000 LB)
Heavy 300-900
Large 12.6-299
Small 0-12.5
Table 3.4.2
The major observations are that, as expected, the probability of exit is related to the aircraft size (weight class). Hence, heavier aircraft tended to use exits that are located further away from the runway threshold while smaller sized ones required shorter landing distances and exited earlier.
A second factor that affected exit use was the specific turning angle of the exit. This angle (which could have been acute, right, or obtuse) provides a measure of the difficulty of using each exit. As a result, independent of runway, most aircraft tended to prefer the use of obtuse angled (high speed) exits.
nrr~.-Figure 3.4.2.1
Exit Use per Aircraft Class Runway 4R Block 6 23 Landings
Landing Direction
F..
00 O 0 i - Ci e 1 7 Exit Figure 3.4.2.2 35 30 25 20 15 10 * Small O Large Heavy SI I - | e -f \O-_-.p~-
__I ~*TYC~~L~ I---LI IP IIC--s~_I~=~ l?~_i~DC;~EF-~- Q-~L-il i.4
S
a
i
' I a
Exit Use Runway 4R Block 9 29 Landings All Classes 35 30
I
All Classes 25-S20 S15 10 . Landing Direction 5 o 0 I II-I I I -I--l-Exit Figure 3.4.2.3Figure 3.4.2.4
Exit Use per Aircraft Class Runway 22L Block 10 16 Landings
8 Small O Large * Heavy Landing Direction I3 I L J J I a I I 1 I * 1 - M c c - 0 O\ - - - -Exit Figure 3.4.2.5 53 40 35 -30 -25 20 15 10 \O 'r 'i e, -."
.~l-r_--r~u..L~ ..:^...,,II~~, ..i~YV~33~- 1..7 L--- I ~-- ~9~_,?LII (^i~ ~ ~.r~;~I~LFP~I~_~E
--- . 1 1 I
II I I U •
00 r- C n NT M
Figure 3.4.2.6
Exit Use Runway 27 Block 3 8 Landings All Classes
2
All Classes Landing Direction pii I -u---- I I I 1 2 3 4 5 6 7 T r1 --- . 8 9 10 11 12 Exit Figure 3.4.2.7 100 -90 -80 -70 - 60-50 -40 30. 20 10 0_i _ __ ___~I.I _ _ ~)__I____Yil____IU__I-R-C-41_9~..r- ... __ - I_; ..
--J
Exit Use Runway 27 Block 8 19 Landings All Classes 100 90 80
E
All Classes 70 60 J 50 40 , Landing Direction 30 20 10 0 I I I I I I II I I 1 2 3 4 5 6 7 8 9 10 11 12 Exit Figure 3.4.2.8Runway 27 Block 10 12 Landings
Exit Use per Aircraft Class
60
--7
E
SmallO
LargeSHeavy
Landing Direction a00 .L I I I I l l i l I 1 2 3 4 5 6 7 8 9 10 11 12 Exit Figure 3.4.2.9 50 -40 30 20 10 -"~~--p---' • I • • • I • • I i m i I I IExit Use per Aircraft Class Runway 33L Block 2 27 Landings
Figure 3.4.2.10
Exit Use per Aircraft Class Runway 33L Block 5 37 Landings
60 50
E] Small Landing Direction
40 O Large 30 S Heavy 20 10 M I I O 00 0 0 I-I C Exit Figure 3.4.2.11 60 50 40 30 20 10-M Small O Large SHeavy Landing Direction l l
I-.1,
I I I II I I ,- C C IC t O ! - 00 O' O Ci Exit rn 11 1-41--- 1----I -- 411*-.--- C - l-LU-I . I . -~i ~W-i iLIIY IL CL ~ 14 11 I1 -^I - C ~ _ __ _i~-*--_~
L --- j- L
Figure 3.4.2.12
Exit Use per Aircraft Class Runway 15R Block 7 28 Landings
E Small
O
Large * Heavy Landing Direction pp l 0 ON 00 r- O l lE Exit Figure 3.4.2.13 45 40 35 30 a 25 20 15 10 5 03.4.3 Exit Velocities
The angle of every exit plays a significant role in the exit velocity of the aircraft. As figures 3.4.3.1 through 3.4.3.13 show, whenever the landing aircraft are using the obtuse angled exits the exit velocities are significantly higher than the other ninety degrees or acute angled exits. However, this is only true for high speed exits which are accompanied with long exit segments and give the pilot room to brake (exit 6 runway 27:
38 knots and exit 5 runway 33L : 40 knots). Exit 8 of runway 4R, although it is obtuse angled, the short exit segment that follows does not allow high exit velocities. Each figure presents, using columns the average exit velocity, and with a line, one high and one low value which corresponds to the average exit velocity plus or minus one standard deviation (see figure legend). The letter H denotes a high speed exit.
Average Exit Velocity All Classes Rnway 4R Block 1
60 -- Avg. Exit Vel.
50 A.E.V. + SD
40 A.E.V. -SD
" Avg. Exit Vel.
30 S20 Landing Direction H H
W
- -I - - C C M - -00 - -Exit Figure 3.4.3.1Average Exit Velocity AM Classes Runway 4R Block 6
O Avg. Ex. Vel.
A.E.V. + SD A.E.V. - SD " Avg. Ex. Vel.
Landing Direction - _ f 0 O S sr 10 Q SExit Exit Figure 3.4.3.2
Aveg e xit Velocity Al Classes Runway 4R Block 9
O
AvgExVel A.E.V. + SD A.E.V. -SD • AvgExVel Landing Direction,rh
..fl.
Figure 3.4.3.3 40 -30 20 101 60 50 -40 30 20 10 .rn. N en It %n 00 . O . 0 .. - m . .O Exit 50 50 H Figure 3.43. I 0-Average Exit Velocity All Classes Ranway 22L Block 8 0 AvgExVel A.E.V. + SD A.E.V. - SD AvgExVel Landing Direction
- - -
a
50 -40 ~ 30 w 20 S10 0* Figure 3.4.3.5.m
DO in t en Clq - 0 00 t- O v 11 C14 -4 Exit~
---~-~---~
60 T - - I- aAverage Exit Velocity All Classes Ranway 27 Block 2 60 O AvgExVel 50 A.E.V. + SD 40 S4A.E.V. - SD > 30 AvgExVel 0 20 Landing Direction S10 H 1 2 3 4 5 6 7 8 9 10 11 12 Exit Figure 3.4.3.6
Average Exit Velocity All Classes Runway 27 Block 3
60 - OAvgExVel 50 A.E.V. + SD 40 A.E.V. -SD SAvgExVel > 30 0 -20 Landing Direction 10
10
H i 1 2 3 4 5 6 7 8 9 10 11 12 Exit Figure 3.4.3.7 61Average Exit Velocity All Classes Runway 27 Block 8 60 S50 O Avj 50 A.E S40 o A.E > 30 Landing Direction " Av - 20 10 -F1 1 2 3 4 5 6 7 8 9 10 1 Exit gExVel .V. + SD .V. - SD gExVel Figure 3.4.3.8
Average Exit Velocity All Classes Runway 27 Block 10
O AvgExVel
50 - A.E.V. + SD
40 - A.E.V. -SD
>w 30 Landing Direction AvgExVel
u 20 10 H 0 - -- -1t - - 6 -
1
.
th F l
. . . 1 2 3 4 5 6 7 8 9 10 11 12 Exit Figure 3.4.3.9 62 1 12Average Exit Velocity All Classes Rm way 33L Block 2 O AvgExVel A.E.V. + SD A.E.V. - SD " AvgExVel Landing Direction po I I1 I I I I I l Exit Figure 3.4.3.10
Average Exit Velocity All Classes R~mway 33L Block 5
I I I I -- I - I -I -!- 00 O
rrmfl
O
AvgExVel A.E.V. + SD A.E.V. - SD - AvgExVel.11.
0 - el e m -Exit Figure 3.4.3.11 63 60 50 40 30 20 10 0 60 50 40 20 10 1-4 CI 4 tn zI
i- - -
I _ 1 , I N uuI I -1 . - - - ~ -.-- • .- . . . .. -Fiure 3.4.3.10 SI I I i60 50
40
30
Average Exit Velocity All Classes Runway S1R Block 4
O AvgExVel
A.E.V. + SD A.E.V. -SD " AvgExVel 20 -Landing Direction[]
10- +.n.
I C - 0 0 00 Ex it Exit Figure 3.4.3.12Average Exit Velocity All Classes Runway ISR Block 7
| | \ r I. c I
O
AvgExVel A.E.V. + SD A.E.V. -SD " AvgExVel 60 50 40 30 20 10 I I I I I .. I I. I.I 1O kI 1* e C' -Landing Direction>.
.i
Exit Figure 3.4.3.13 64 I i ~rilFigures 3.4.3.14 through 3.4.3.22 show the average exit velocities per aircraft class. These velocities vary from aircraft class to aircraft class but the variation is not consistent and no conclusions can be drawn in favor of one class or another.
I Heavy O Large
E Small
Landing Direction
..
Average Bxit Velocity per Aircraft Class Rmaway 4R Block I
50 -45 -40 -35 -30 -25 -20 15 -10 5 o0 - I I I n I I0 ("4 n¢ ,q u' ,0 t I
.rf
il
Figure 3.4.3.14 -4 C14 IOCn N W --- --- -. . . . . .. IAverage Exit Velocity per Aircraft Class Runway 4R Block 6 50 -r 45 -40 -35 -30 . 25 20 15 10 - 5-0 4 Heavy O Large * Small Landing Direction
.n
en..4 "..0~
kn I a I I I I I 1-4 C14 en ,, i \O r.- 00 E Edit Figure 3.4.3.15Average Exit Velocity per Aircraft Class Runway 22L BlocklO
50 45 Landing Direction S40 E Heavy 35 S30 0 Large H 0 > 25 0 Small 20 15 10 5 Exit Figure 3.4.3.16 66
-H~Cb ll~eB4~LISMn-'- i~"'.--cnrra~-B~*M I -..-. -~"" ~I~- ~PLIII~ -~lca;--.---.; ;--tl.C~C~i~PI~ii: