Publisher’s version / Version de l'éditeur:
Analytical and Bioanalytical Chemistry, 402, 1, pp. 429-438, 2011-11-29
READ THESE TERMS AND CONDITIONS CAREFULLY BEFORE USING THIS WEBSITE.
https://nrc-publications.canada.ca/eng/copyright
Vous avez des questions? Nous pouvons vous aider. Pour communiquer directement avec un auteur, consultez la première page de la revue dans laquelle son article a été publié afin de trouver ses coordonnées. Si vous n’arrivez pas à les repérer, communiquez avec nous à PublicationsArchive-ArchivesPublications@nrc-cnrc.gc.ca.
Questions? Contact the NRC Publications Archive team at
PublicationsArchive-ArchivesPublications@nrc-cnrc.gc.ca. If you wish to email the authors directly, please see the first page of the publication for their contact information.
NRC Publications Archive
Archives des publications du CNRC
This publication could be one of several versions: author’s original, accepted manuscript or the publisher’s version. / La version de cette publication peut être l’une des suivantes : la version prépublication de l’auteur, la version acceptée du manuscrit ou la version de l’éditeur.
For the publisher’s version, please access the DOI link below./ Pour consulter la version de l’éditeur, utilisez le lien DOI ci-dessous.
https://doi.org/10.1007/s00216-011-5509-y
Access and use of this website and the material on it are subject to the Terms and Conditions set forth at
Determination of moisture content of single-wall carbon nanotubes
Sturgeon, Ralph E.; Lam, Joseph W.; Windust, Anthony; Grinberg, Patricia;
Zeisler, Rolf; Oflaz, Rabia; Paul, Rick L.; Lang, Brian E.; Fagan, Jeffrey A.;
Simard, Benoit; Kingston, Christopher T.
https://publications-cnrc.canada.ca/fra/droits
L’accès à ce site Web et l’utilisation de son contenu sont assujettis aux conditions présentées dans le site LISEZ CES CONDITIONS ATTENTIVEMENT AVANT D’UTILISER CE SITE WEB.
NRC Publications Record / Notice d'Archives des publications de CNRC:
https://nrc-publications.canada.ca/eng/view/object/?id=26fe4a77-3ea5-44be-adf5-88f78117e56a https://publications-cnrc.canada.ca/fra/voir/objet/?id=26fe4a77-3ea5-44be-adf5-88f78117e56aORIGINAL PAPER
Determination of moisture content of single-wall
carbon nanotubes
Ralph E. Sturgeon&Joseph W. Lam&Anthony Windust&Patricia Grinberg& Rolf Zeisler&Rabia Oflaz&Rick L. Paul&Brian E. Lang&Jeffrey A. Fagan& Benoit Simard&Christopher T. Kingston
Received: 4 July 2011 / Revised: 11 October 2011 / Accepted: 17 October 2011 / Published online: 29 November 2011 # Springer-Verlag 2011
Abstract Several techniques were evaluated for the estab-lishment of reliable water/moisture content of single-wall carbon nanotubes. Karl Fischer titration (KF) provides a direct measure of the water content and was used for benchmarking against results obtained by conventional oven drying, desiccation over anhydrous magnesium perchlorate as well as by thermogravimetry and prompt gamma-ray activation analysis. Agreement amongst results was satisfactory with the exception of thermogravimetry, although care must be taken with oven drying as it is possible to register mass gain after an initial moisture loss if
prolonged drying time or elevated temperatures (120 °C) are used. Thermogravimetric data were precise but a bias was evident that could be accounted for by considering the non-selective loss of mass as volatile carbonaceous compo-nents. Simple drying over anhydrous magnesium perchlo-rate for a minimum period of 8–10 days is recommended if KF is not available for this measurement.
Keywords Single-wall carbon nanotubes . Moisture determination . Oven drying . Desiccator drying . Karl Fischer titration . Prompt gamma-ray activation analysis
Introduction
Nanoparticles are particles with a diameter between 1 and 100 nm [1], and nanotechnology is generally defined as the study, exploitation, and/or manipulation of matter at nanometer scales to produce new materials, structures, and devices. Currently, hundreds of applications ranging from household products and sports equipment to optoelectronic devices and drug delivery systems for biomedicine capital-ize on the unique properties of engineered nanoparticles, accelerating the interest in, demand for, and need of characterization techniques for what promises to become a ubiquitous product of modern technology.
Accurate characterization of physical and/or chemical properties of nanomaterials is a fundamental requirement for furthering their application in various product lines as well as for understanding and managing potential risks associated with their ultimate release to the environment [2,
3]. The international measurement system (the SI) and its means of dissemination, primarily through use of reference materials (RMs), form the basis of all comparative and traceable measurements [4]. In the current general absence
Published in the 10th Anniversary Issue.
R. E. Sturgeon (*)
:
J. W. Lam:
A. Windust:
P. GrinbergInstitute for National Measurement Standards, National Research Council of Canada, Ottawa, ON K1A 0R6, Canada e-mail: ralph.sturgeon@nrc.ca R. Zeisler
:
R. Oflaz:
R. L. PaulAnalytical Chemistry Division,
National Institute of Standards and Technology, Gaithersburg, MD 20899-8391, USA
B. E. Lang
Biochemical Science Division,
National Institute of Standards and Technology, Gaithersburg, MD 20899-8391, USA
J. A. Fagan Polymers Division,
National Institute of Standards and Technology, Gaithersburg, MD 20899-8391, USA
B. Simard
:
C. T. KingstonMolecular and Nanomaterials Architecture Group, Steacie Institute for Molecular Sciences,
National Research Council of Canada, Ottawa, ON K1A 0R6, Canada Anal Bioanal Chem (2012) 402:429–438 DOI 10.1007/s00216-011-5509-y
of nanoscale RMs, measurement errors may contribute large uncertainties to estimates of nanoparticle character-istics; they are thus critical to ensuring continued product development as well as exposure assessment efforts or ecotoxicology studies.
Since the discovery of carbon nanotubes by Iijima [5], these materials surfaced as one of the first major nanoscale manufactured products to enter the market and amongst nanomaterials, single-wall carbon nanotubes (SWCNT) are the most promising, having attracted great attention over the past 15 years as a consequence of their exceptional mechanical, electrical, and thermal properties, making them the ultimate additives for multifunctional composites. Most recently, RMs for nanotechnology have begun to emerge to support measurement methodologies, i.e., a suite of NIST gold sols of various particle size (NIST RM 8011, 8012, and 8013) with imminent release of both a size (length) segregated SWCNT (NIST RM 8281) as well as a carbon nanotube soot material (NIST SRM 2483) [6]. It should be mentioned that the NRC is actively pursuing this avenue as well, and a candidate reference material for SWCNT produced by a laser vaporization technique is currently undergoing physicochemical characterization for a number of measurement properties through an international round-robin exercise. The material available for study herein was produced in-house via a plasma process described in more detail later. Additionally, although ISO has launched an intensive attempt to generate protocols for characterization of SWCNT using various instrumental techniques, few such standards are currently available [7]. Fortunately, other efforts to impart standardization of measurement approaches have recently appeared [8, 9] which, when used in conjunction with available RMs, will provide for more accurate characterization and benchmarking of these materi-als [10]. It is noteworthy that no mention is made in these documents of the need of, or methodology recommended for, accurate determination of moisture content in these materials. Indeed, ISO TC 229 “Nanotechnologies” has not yet considered this important measurement parameter. However, for applications of CNTs that involve adsorption of gaseous molecules, the presence of water vapor could compromise performance. Moreover, it is clear that production of a future RM for benchmarking measurement performance must include this parameter, although it is entirely unclear at this time what type of SWCNT RM will be most useful to the nanotechnology/nanoscience community, i.e., a raw or processed (purified) dry SWCNT powder, a stabilized suspension of either or size, chirality, or conducting versus semiconducting material.
Knowledge of moisture content is required for all materials which need to be characterized on a dry mass basis because of their hygroscopicity. The methodology selected for dry mass correction may significantly influence
the certified contents of other constituents [11]. SWCNT may have numerous defects and surface functional groups (principal adsorption sites) that influence water adsorption behavior, nano-confined interfacial water wherein the small diameter of the nanotubes can accommodate a monolayer of water, or at interstitial sites between bundles of nano-tubes. Depending on the relative humidity of the laboratory, the content of water may change appreciably due to exposure time when excessive handling of the material after removal from a storage vessel is required. Although the adsorption of water by CNTs has been the subject of numerous physicochemical studies (e.g., [12–15]), it is its uptake and form of accommodation that has been investi-gated rather than any aspects of dehydration. By contrast, significant fundamental work relating to the determination and impact of moisture content on the characterization of biological and environmental RMs, for example, has been published [16–22]. It is acknowledged that whereas several methods exist for the determination of water content [23] due to the presence of water bound in different environ-ments, different results are frequently obtained. Thus, a distinction must be made between water and moisture content [17]. Water content is obtained by determining water selectively, whereas moisture content (technically mass loss) is obtained by drying techniques applied under specified conditions and may either include mass loss due to desorption of other volatile material or may even leave a portion of the water undetected.
It would appear that the closest analogous materials to SWCNT for which specified drying procedures are avail-able are coals and cokes [21, 22] from which initial guidance for assessment of this parameter in SWCNT may be adopted. To this end, a comparative study of several popular approaches to the determination of moisture and water content was undertaken in an effort to identify a recommended procedure for characterizing this parameter in SWCNT. For this study, these included specific measurement of water by Karl Fischer titration (KF), conventional oven drying at 105 °C, drying in a desiccator over anhydrous magnesium perchlorate, estimation of moisture loss by thermogravimetry, and application of prompt gamma-ray activation analysis (PGAA). Water specific KF measurements as well as PGAA and drying over anhydrous magnesium perchlorate in a desiccator were examined at NIST while parallel experiments on samples of the same SWCNT material were undertaken at NRCC using all approaches except PGAA.
Materials and methods
The NRCC SWCNT material used for this study was produced in-house via a plasma process using conditions
described by Kim et al. [24] with the exception that the carbon black source was Elftex® 12 (Cabot Corp., Boston, MA). The product was subsequently homogenized by dispersion in hexane and briefly circulated through a high-shear mixer to produce a dry, free-flowing powder of sufficiently small size as to pass a 400 μm sieve. No further size characterization was undertaken.
The SWCNT powder was subsequently manipulated in a glove box which was continuously flushed with dry, high purity argon from a liquid Ar blow-off vent. Nominal 0.3 g masses of SWCNT were sub-sampled into 10-mL glass vials which had been pre-cleaned and oven dried before being transferred to the glove box. Sub-sampling was accomplished using an aluminum metal scoop, machined to dimensions sufficient to contain the desired mass of material, and a small aluminum funnel to ensure its clean transfer to the vial. The metal scoop and funnel were selected in an effort to minimize static charge. Once filled, each vial was immediately sealed with a Teflon coated silicone septum and metal cap. Approximately 50 such samples were prepared in the course of an hour and, when completed, pairs of the capped vessels were removed from the glove box and immediately placed into heat-sealed trilaminate foil pouches so as to produce an enumerated random set of bottled material.
Sixteen bottles of material were shipped to NIST for parallel determinations of moisture content by PGAA, KF titration and drying in a desiccator over anhydrous magnesium perchlorate, of which ten were opened and processed. After a period of 6 months, three packages (containing six bottles) which remained unopened were returned to NRCC for determination of moisture content and comparison with data generated 9 months earlier. For this purpose, several approaches were taken at NRCC, including conventional oven drying at 105 °C, desiccator drying over anhydrous magnesium perchlorate and molec-ular sieve, KF titration as well as thermogravimetry. These procedures/techniques are described in detail below.
In addition to the SWCNT material from NRCC, samples of candidate SRM 2483 carbon nanotube soot from NIST were also examined in select comparative experiments. This material was produced using the CoMo-Cat fluidized-bed process [25].
Karl Fischer titration
A Mettler Toledo DL39 KF coulometer was coupled with a Stromboli oven sample changer (Mettler Toledo, Inc., Mississauga, Ontario, Canada) and integrated drying oven (temperature, 275 °C) for automated determinations of water in the SWCNT. The KF reagent was Hydranal Coulomat AG. Glass vials (20 mL, Mettler), cleaned and dried in an oven at 120 °C for at least 24 h, were used for
delivering the SWCNT samples to the oven. Nominal 0.15 g test portions of SWCNT, quickly transferred from a freshly opened sample bottle into pre-weighed glass vials, were rapidly sealed with a self-sealing aluminum foil (Mettler). The container was reweighed and the difference noted. The sampling procedure required about 1 min. Once all the samples were prepared, they were loaded into the sampling rack for analysis. A silicone rubber cap (Mettler) sealed the sample vial in the oven while a glass tube punctured the aluminum seal. The high temperature released the moisture from the SWCNT and transferred it via an insulated PTFE transfer tube to the titration cell in a 150-mL/min flow of dry nitrogen.
Prior to sample analysis, drift was assessed, which is the moisture introduced into the titration vessel by the drying gas and accounts for any possible air leakage within the system. This was performed with an empty sample vial placed at the “Drift” position of the sample rack. Normally, the same glass vial is repeatedly used as the “conditioned” container which produces a more consistent result, inde-pendent of the humidity. Once the system stabilized (low, consistent drift values attained; 5 μg/min), a blank (prepared in an identical fashion to the sample) was run to provide an estimate of the moisture contained in an identically sized vial of air. Several more blanks were processed at the end of each sequence to check for consistency. Blanks averaged 390 μg water.
All titrations were performed in automatic mode for a set length of time rather than by electrochemical potential of the cell alone (generally, 30 min.). The determination of moisture is selective and considered to be an absolute method as long as the reaction which generates iodine in the KF electrolyte occurs with 100% efficiency [26]. The technique can also be validated by analysis of stable solids of known water content, such as sodium tartrate dihydrate or potassium citrate monohydrate. The latter (water content, 5.55%) was chosen for use here as it has a higher dehydration temperature.
Samples sent to NIST were similarly treated for analysis by KF. Test portions were weighed on a micro balance (Mettler) with a precision of 2 μg. The mass of sample was determined by the mass difference between an empty and full sample pan. After weighing, the samples were transferred to dry 6 mL glass headspace vials that had been previously dried in an oven at 250 °C for 16 h. The vials were hermetically sealed with a septum cap to prevent uptake of water from the atmosphere.
The determination of water was made using a volumetric KF titrator with an attached KF oven (Metrohm 795 KFT Titrino, Metrohm KF Thermoprep Oven). The solvent for the analysis was anhydrous methanol (Mallinckrodt). The KF reagent was one-part Hydranal Composite 2 (Sigma). The sample vials were inserted into the 250 °C KF oven,
and the resulting water vapor was transferred to the titration cell using dry nitrogen as the carrier gas, flowing at a rate of 40 mL/min. The transfer is made possible by piercing the septum of the headspace vials with a needle assembly that allows the carrier gas to flow in from the supply and out to the KF cell. The stirring rate in the KF cell was set relatively high to help maximize the uptake of the water vapor into the solvent in the KF cell (note: the KF titration cell was set up to allow for the manual injection of the calibration standard while the carrier gas was flowing through the KF cell).
An empty, sealed headspace vial was placed into the oven sample holder (at 150 °C), the septum pierced and the nitrogen carrier gas was allowed to flow into the KF cell. The titration system was started and was allowed to run overnight for the system to achieve a stable baseline. An initial baseline drift was determined by performing a titration with the system as is. This was followed by three calibration measurements using 80 mg (nominal) of NIST SRM 2890 (water-saturated 1-octanol (WSO)) as a standard that was injected into the titration vessel through a silicone septum via a gas-tight syringe. The amount injected was determined by weighing the injection syringe before and after the injection on an analytical balance.
Following the WSO calibration runs, samples were analyzed using the following procedure. The oven temper-ature was brought up to 250 °C and one of the vials containing a SWCNT sample was placed into the KF oven. The titration was started and the septum cap was pierced with the oven’s needle to start the transfer of evolved water vapor to KF cell. At the completion of the titration, the old sample vial was removed from the oven and a new sample was placed in the oven for the next titration. After the sample measurements, a titration was run using an empty vial to determine the atmospheric water contribution, since the sample vials were sealed in air. On average, this amounted to a correction of 70 μg water.
All titrations were run for a set length of time rather than by electrochemical potential of the cell alone due to the slow release of water in the samples (generally 30 min for the calibration runs and 60 min for the samples run in the oven). The drift of the instrument was calculated at the conclusion of every run over two successive 10-min intervals to check for consistency in the baseline and to make adjustments in the volume of the KF reagent titrated into the sample cell. Typical baseline drifts were less than 2 μL KF reagent per minute.
Thermogravimetry
Thermogravimetry utilizes smaller test masses than oven drying or desiccator-based approaches but can provide insight into the nature of the compounds produced during
the heating process. Thermogravimetric analysis (TGA) was conducted using a TA Instruments (New Castle, DE) Q5000 following the protocol outlined by Freiman et al. [8]. Samples (4 to 5 mg) of SWCNT were loaded onto open, high temperature platinum pans and were heated under N2at a flow rate of 25 mL/min at a rate of 5 °C/min
up to 120 °C and then held isothermally for 2 h, at which point the sample gas was switched to air and the sample heated at a slower rate of 2.5 °C/min (to minimize the possibility of sample ignition) to 800 °C.
Oven drying
Individual samples were opened and the entire content transferred to pre-cleaned, dry pyrex weighing bottles. Multiple test samples were prepared in this manner and loaded into a Blue M electric lab oven (Watertown, WI) maintained at a temperature of 105±2 °C. Measurements of mass loss were conducted at regular intervals over a period of several days using a Mettler Toledo (model XP-205) analytical balance (0.01 mg readability) located in a temperature and humidity controlled room (24 °C and 13% RH). Prior to weighing, samples of approximately 300 mg were transferred between the oven and balance as well as cooled to room temperature in a desiccator. Some oven drying experiments, specifically noted as such, were conducted at 120 °C. Following completion of the drying experiments, the weighing bottles were emptied, cleaned and reweighed to establish the tare and net initial mass of sample under study.
Drying over desiccant
Samples similarly prepared in weighing bottles were subjected to drying using anhydrous magnesium perchlo-rate (Anachemia, Montreal). The moisture content of the material was determined by weighing by difference sub-portions of approximately 300 mg in weighing vessels to record “wet” weight. After drying in a desiccator for selected periods of time the “dry” weight was determined. Tare weights either had been determined before sub-sampling, or the empty vials were weighed after preparation of all analytical samples to determine the tare weight. Uncertainties were determined through repeated weighing and calculation of standard deviations.
Hygroscopicity evaluation
The hygroscopicity of the samples was evaluated by loading approximately 0.5 g sample masses of the SWCNT into separate weighing bottles to permit the mass uptake rate to be monitored for each sample at regular time intervals over the course of several hours from the opening
of the sample bottles at room temperature and by exposure of freshly dried samples to the ambient laboratory atmo-sphere. The experiments were performed under controlled temperature and hygrometry conditions (approximately 13% relative humidity and 24 °C; typical laboratory environment). Sample depth was approximately 2 mm with surface coverage of 130 mg cm−2 in each case. Such
measurements may be useful for accounting for any additional uncertainties if the content of water changes appreciably due to exposure time when excessive handling of the material after removal from a storage vessel is required.
Prompt gamma-ray activation analysis
PGAA was performed using the cold neutron PGAA instrument at the NIST Center for Neutron Research [27]. The mass fraction of hydrogen was determined during the course of PGAA for elemental composition [28]. Sample aliquots ranging in mass from 66 to 130 mg from three bottles of SWCNT were pressed into pellets using a 12.7-mm stainless steel die and hydraulic press. Each pellet was then weighed into a bag of FEP Teflon and heat-sealed. Samples were irradiated for at least 24 h in the neutron beam. Hydrogen was determined by measurement of the characteristic 2,223 keV gamma-ray line. Hydrogen count rates were corrected for background (determined from measurement of an empty Teflon bag irradiated in the beam) and for an interference peak by cobalt at this same energy. The hydrogen sensitivity (hydrogen counts per hydrogen mass) was measured, in order to convert signal to hydrogen mass fraction. Because element sensitivities in PGAA vary greatly as a function of H content, it is not easy to measure H sensitivity directly in a hydrogenous material. Hydrogen sensitivity was determined by first measuring the H/Ti sensitivity ratio from a pellet prepared from a mixture of titanium powder, graphite and urea (composition, 12.55% Ti and 3.171% H). The H sensitivity was determined by measuring the Ti sensitivity from irradiation of a high purity titanium foil. Water content of the samples was estimated by converting the measured hydrogen mass fraction to an apparent water mass fraction. Since not all hydrogen may be present as water, such an approach may lead to an overestimation of the water content.
Stability study
Additional desiccator-based drying measurements were repeated after 5 months of storage of a set of unopened bottles sealed in the trilaminate foil pouches in order to assess the integrity of the selected packaging on the long-term stability of the moisture content of the samples as stored under typical laboratory conditions.
Elemental analysis
Elemental carbon content of the SWCNT sample was determined using a LECO TRUSPEC combustion furnace (model 630-100-400, St. Joseph, MI) employing a fuel oil secondary standard (LECO 502-083) for calibration (trace-able to NIST SRMj benzoic acid) with IR detection. Safety note Aerosol production is to be avoided in the workplace while handling SWCNT. Wearing PPE is recommended as well as a suitable filter respirator if the work space does not provide sufficient air ventilation. Samples should be prepared in controlled chambers such as glove boxes and fume hoods. Due to their nanometer-scale dimensions, it is recommended that such materials be treated as hazardous substances and disposed of as such. Disclaimer The identification of certain commercial equip-ment, instruments, or materials does not imply recommen-dation or endorsement by the National Institute of Standards and Technology. These identifications are made only in order to specify the experimental procedures in adequate detail.
Results and discussion
The in-house synthesized SWCNT samples used for this study had a particle (agglomerate) size of less than 400 μm. Elemental analysis revealed a carbon content of 92.7±2.7% (relative standard deviation (RSD), n = 5). A residual catalyst content (primarily Mo and Co) amounted to approximately 10% by mass (~13% when oxidized).
A variety of techniques can be used for the determination of water (commonly ascribed as moisture content) in materials; those most frequently applied include oven drying to constant mass at temperatures ranging from 85 to 200 °C, exposure of the sample to desiccants such as anhydrous magnesium perchlorate or sulfuric acid, selective KF titration of water and quantitation or moisture via TGA. Other methodologies have also been described [29]. Of these, KF determines the water content by a direct measurement based on a measurand specific chemical reaction [26] and may thus be considered as the ideal international reference method. Because KF is not widely available in laboratories, other simpler approaches must commonly be adopted, provided they can be validated to yield accurate performance with the test sample. As no earlier studies have been undertaken regarding the perfor-mance characteristics of such alternative techniques when applied to SWCNT, it was instructive to examine the performance of these approaches as benchmarked against results obtained using KF.
Results for moisture/water content are summarized in Table1. Using the KF results as a benchmark, it is possible to evaluate the performance of the other methodologies for accuracy and applicability. These are discussed below within their relevant sub-sections.
Hygroscopicity evaluation
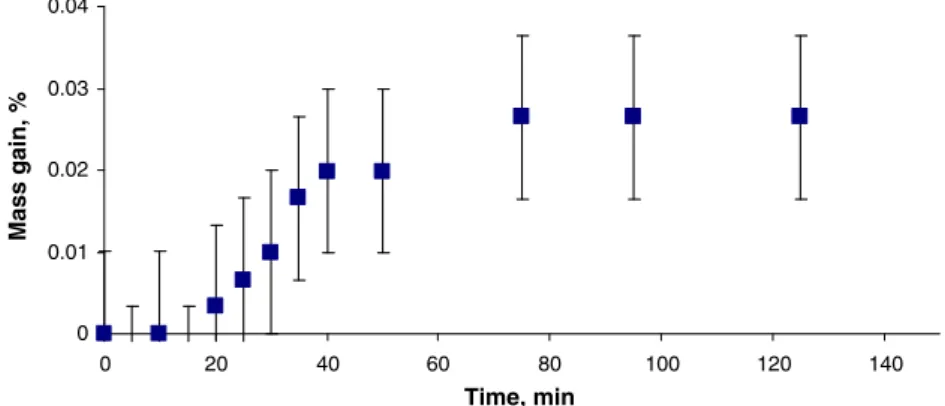
The uptake of moisture by previously dried samples (oven or by desiccator) as well as those freshly taken from their bottles was examined and is shown in Figs.1and2, respectively. As noted earlier, the SWCNT samples were originally bottled at 25 °C in an argon flushed glove bag at low RH, but had been earlier exposed to uncharacterized ambient humidity (RH) conditions during/following their synthesis. Figure1displays the typical characteristics of an adsorption isotherm for water onto a hydrophilic surface, with relatively rapid gain of moisture in the first hour of exposure to the 24 °C ambient atmosphere at 13% RH. This behavior is similar to that reported by Ellison et al. [15] who studied the uptake of water onto dried SWCNT (800 °C for 12 h in vacuo) by Fourier transform infrared (FTIR) at 298 K and Pwater=3 kPa
(23 Torr), in that equilibrium was reached only after 2 h. It is interesting that even after the 3-h period shown in Fig. 1, weight gain continues to occur but at a much slower rate. Presumably, the principal adsorption sites are most easily saturated, these being surface defects and functional groups and thereafter within the diameters of the nanotubes themselves. It is not know whether, if given sufficient time, the moisture content may finally approach the original approximately 0.5% value, this being the moisture content of the material as bottled, following its exposure for an unknown period of time to an atmosphere of unknown RH. Information on the rate of uptake of water from the ambient atmosphere is useful, as during the typical 1 min measure-ment period when sample is exposed on the balance, the sample would gain approximately 0.01% mass due to
moisture uptake. This correction was not applied to the data, as it is negligible, amounting to a 2% correction to the determination of overall moisture content (i.e., 0.01 in 0.5= 2% correction) and is of the same order of magnitude as the measurement uncertainty. Uncertainties, determined through repeated weighing and calculation of standard errors, are reported as expanded uncertainty (k=2).
Figure2shows that a pristine sample immediately taken from an opened bottle also gains moisture when exposed to ambient air, reaching what appears to be a saturation level after about 1 h, representing a weight gain of 0.25%. The only significance of this observation is that the ambient RH to which the SWCNT was exposed before bottling must have been close to, but slightly less than, that at the time of these measurements, as weight gain is minimal. From a practical perspective, when undertaking mass-loss determi-nations by any of the proposed methodologies, it appears possible to work with the material for a few minutes without having to consider the consequences of further moisture uptake. Such characteristics of water uptake and loss are influenced by the state of aggregation of the particles, as reflected in the effective surface area per mass of the sample. A decrease in the state of aggregation or particle size should increase the specific surface area and enhance the kinetics of these processes.
KF titration results
As noted earlier, KF specifically determines the water content by a direct measurement and may thus be considered as the ideal international reference method. Unfortunately, it is not known what fraction of any tightly bound water that may be present within the SWCNT tube structure may have been released at the 250 to 275 °C oven temperatures used for these experiments.
Based on processing seven separate sub-samples through the procedure, an average water content of 0.54±0.06%
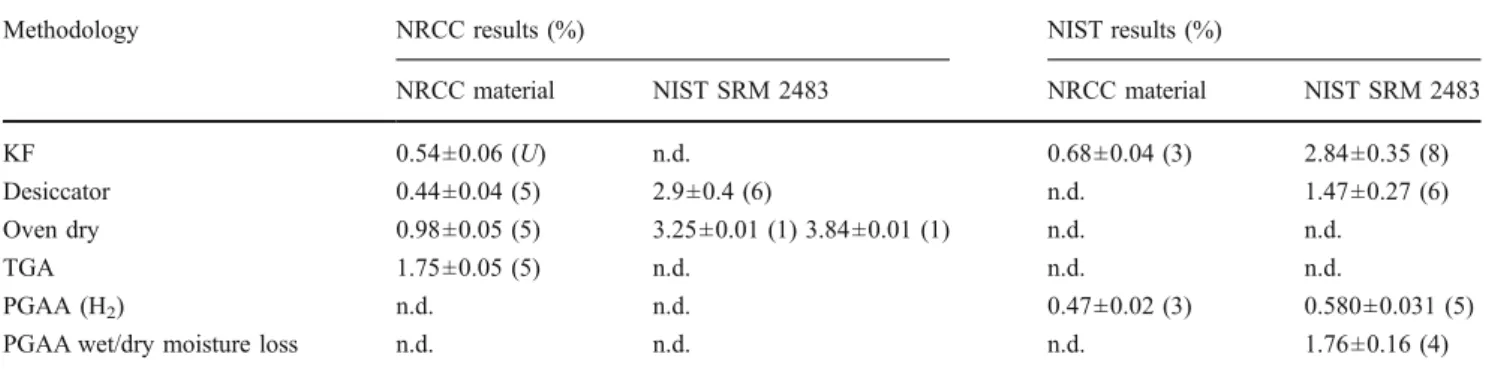
Table 1 Summary of results for determination of moisture in SWCNT samples
Methodology NRCC results (%) NIST results (%)
NRCC material NIST SRM 2483 NRCC material NIST SRM 2483 KF 0.54±0.06 (U) n.d. 0.68±0.04 (3) 2.84±0.35 (8) Desiccator 0.44±0.04 (5) 2.9±0.4 (6) n.d. 1.47±0.27 (6) Oven dry 0.98±0.05 (5) 3.25±0.01 (1) 3.84±0.01 (1) n.d. n.d.
TGA 1.75±0.05 (5) n.d. n.d. n.d.
PGAA (H2) n.d. n.d. 0.47±0.02 (3) 0.580±0.031 (5)
PGAA wet/dry moisture loss n.d. n.d. n.d. 1.76±0.16 (4) Precision given as RSD with number of replicate samples tested given in parentheses
(U, k = 2) was determined. The principal sources of uncertainty contributing to this result arose from the correction due to the blank (as a result of humidity and sample handling) and the reproducibility of replicate measurements or characterization of the sample. No effort was made (i.e., ANOVA) to isolate sources arising from bottle-to-bottle inhomogeneity or potential inhomogeneity of water content within a given test sample, although it is quite conceivable that this may also be a factor contributing to the spread of the results and is considered to be accounted for in the “characterization” contribution. It is instructive to examine the performance of other approaches as benchmarked against results obtained using KF.
Determination of moisture content in the NRCC SWCNT samples at NIST by KF (based on three samples of nominally 90 mg, 250 °C oven) yielded results of 0.68 ± 0.04% (RSD, n= 3) by mass. This is slightly higher than that generated at NRCC for comparable samples and may reflect the heterogeneity of this material with respect to moisture content. Samples of candidate NIST SRM 2483 soot material yielded an average moisture content of 2.84 ± 0.35% (RSD, n= 8) by mass [6], by measurements undertaken at NIST wherein the uncertainty associated with an individual determination by KF on a nominal 50 mg sample was typically 0.1%. This highlights the inherent spread in the moisture content from sample to
sample of the same batch of soot material, ranging from 2.47% to 3.37% by mass.
TGA results
Figure 3 presents a representative TGA profile of the SWCNT material from which an indication of its relative purity may be gained from the high oxidation temperature (T0, the temperature at the maximum rate of oxidation, i.e.,
600 °C) of the principal mass-loss peak compared with the more diffuse losses incurred at lower temperatures (380– 400 °C) which typically reflect combustion of the amor-phous carbon structures present [30]. At 800 °C, the residual mass (Mres) is accounted for by the oxidation of
major metal catalysts (Mo and Co) present in the material and used in the synthesis of the SWCNT, amounting to some 12.3% by mass. An independent measurement of these constituents by NAA at NIST indicated approximately 13% Mo and 2% Co.
Within the temperature region 80–120 °C, the material lost on average 1.75±0.05% (RSD, n=5) mass, which must be ascribed to both moisture as well as volatile material (such as residual solvent from the synthesis) degassing from the sample. This mass loss is significantly larger than that determined by KF, which reflects specific measurement of water loss, and can be considered one of the shortcomings of 0 0.05 0.1 0.15 0.2 0.25 0.3 0.35 0.4 0 20 40 60 80 100 120 140 160 180 200 Time, min Mass gain,%
Fig. 1 Gain in moisture by exposure of previously dried samples of SWCNT when exposed to ambient atmosphere at 24 °C and 13% RH. Note: error bars represent expanded uncertainty (U=0.01%) 0 0.01 0.02 0.03 0.04 0 20 40 60 80 100 120 140 Time, min Mass gain, %
Fig. 2 Isotherm for gain in moisture by exposure of freshly opened SWCNT sample to ambient atmosphere at 24 °C and 13% RH. Note: error bars represent expanded uncertainty (U=0.01%)
the TGA technique for selective detection of water in such highly adsorbing materials. It is to be noted that the RH of the TGA laboratory was nominally 13% during these experiments and samples were taken immediately from their freshly opened bottles without delay in the measurements. As such, no corrections for any possible uptake of moisture from ambient were needed for two reasons; the kinetics of uptake were slow (cf. “Hygroscopicity” section) and the maximum weight gain experienced by a 1-h exposure of the sample to ambient was 0.25%—even this was not a remarkable correction to the 1.75% recorded.
In an attempt to further investigate the nature of the mass loss during the initial ramp to 120 °C, exhaust gas from the oven was routed through a FTIR gas cell (results not shown here). Although signal to background was poor, a weak absorbance was observed at 2,800–3,000 cm−1 within the
first 10 min, characteristic of C–H bonds. This corroborates the conclusions drawn above that the mass loss determined using TGA methodology cannot selectively be associated with water loss from the SWCNT. Runs undertaken at
different isothermal holding temperatures and times had little effect on the overall results and illustrated the difficulty in separating dehydration processes from those of degassing of other species of similar volatility/adsorption energy.
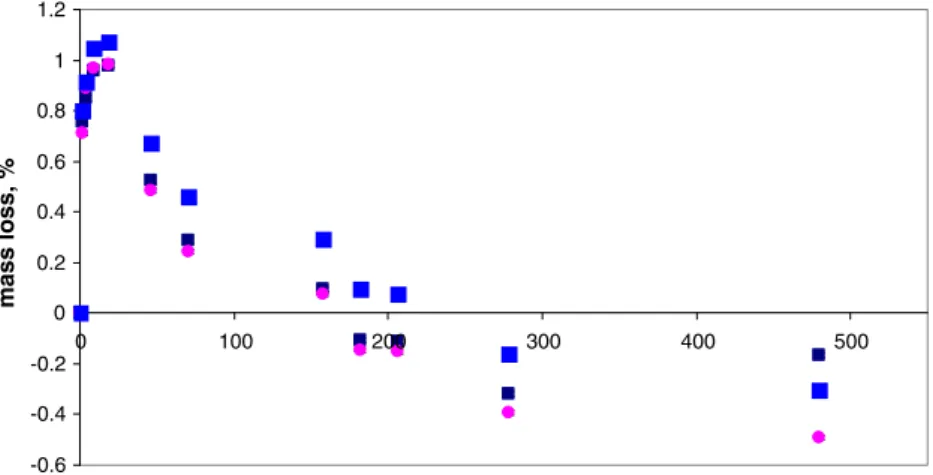
Oven drying results
Replicate samples were subjected to drying in an isothermal oven, exposed to the ambient air for varying periods of time. Cooling before weighing was completed in a desiccator. Figure 4 illustrates the typical mass-loss time characteristics for three sub-samples of this material. Unusual behavior was noted after several hours heating in the oven in that following an initial mass loss, weight gain was then apparent for all sub-samples. A second indepen-dent run consisting of two additional sub-samples repro-duced these same characteristics.
At the inflection point of the mass-loss curve, after approximately 9 h of cumulative heating, the maximum mass loss amounted to 0.98± 0.05% (RSD, n= 5). This is clearly not an accurate measure of the moisture content of this material and simply reflects the balance point achieved between several competitive overall loss and gain processes. Thermal drying of the SWCNT will result in loss of moisture as well as desorption of any volatile organic residues (VOCs), much as is the case with the TGA approach, which indicated that up to 1.75% mass loss could occur if no oxygen was available during this heating stage. The access to ambient oxygen in the heated oven permits oxidation reactions involving the residual catalyst metals to occur, producing an increase in mass with time as this reaction progresses, reaching an apparent 0.3% mass gain after 20 days in the oven. When compensating for the real mass lost as a result of moisture and VOCs, this weight gain arising from oxidation of the residual Mo and Co would be on the order of 1.3%, which
Temperature (oC) 0 100 200 300 400 500 600 700 800 Weight (%) 0 20 40 60 80 100 Deriv. Weight (%/ o C) 0.0 0.2 0.4 0.6 T0 Mres
Fig. 3 Representative TGA profile for the SWCNT sample showing the oxidation temperature (To=(dm/dT)max) and residual mass (Mres)
-0.6 -0.4 -0.2 0 0.2 0.4 0.6 0.8 1 1.2 0 100 200 300 400 500 Time, h mass loss, %
Fig. 4 Mass-loss characteristics for SWCNT dried in a 105 °C oven open to ambient atmosphere. Note: error bars represent expanded uncertainty (U=0.01%) and are typically buried beneath symbols)
is not unusual considering that 13% mass content of the SWCNT is attributable to these metals and their initial oxidation state in the as-produced material is unknown. When experiments were repeated at an oven temperature of 122 °C, a net mass gain was evident after only 4 h of heating, reflecting a more rapid oxidation reaction at elevated temperature.
Oven drying of the NIST SWCNT candidate material was undertaken at 122 °C in an effort to maximize any such effects; no mass increase was evident after 11 days of heating. An apparent moisture content of 3.25% and 3.84% by mass was achieved on two test samples.
Simple oven heating cannot be recommended for SWCNT in general as the metal content is unknown; a dry nitrogen purged oven may prove fit for the purpose. Desiccator results
Drying over anhydrous magnesium perchlorate resulted in a significant moisture loss after the first day, as evident in Fig. 5. Additional water losses continued over a period of up to 7 to 8 days, beyond which, within the uncertainty of the measurements, no further changes occurred. Based on five replicate samples taken through the process at NRCC (data in Table 1), an average mass loss of 0.44±0.04% (RSD, n=3) was observed. These are in agreement with data obtained at NIST based on three replicate samples similarly dried in a desiccator, yielding 0.46%, 0.36%, and 0.43% mass loss due to moisture.
Although Fig. 5 presents a typical mass-loss plot for such samples, it is to be noted that the slope of the plot over the initial 2 days differed substantially from sample to sample, perhaps reflecting the agglomerate particle size distribution of the bottled SWCNT material.
Moisture content determined using a simple desiccator approach suggests the need for a minimum 7- to10-day drying period and provides data that are somewhat in agreement with that generated by KF titration (0.44 ± 0.04% vs. 0.54 ± 0.06%, respectively). The bias between
these data may reflect the very difficult fraction of moisture recoverable from the interior of the SWCNT tubules achieved using the high temperature KF oven for desorption.
Samples of the candidate NIST SRM 2483 SWCNT material with different history were subjected to an identical drying protocol in the desiccator. This resulted in mass loss after generally 7 to 10 days of drying, yielding a moisture content of 5.1% for the original bulk material (6.0% with KF) and 4.1± 0.05% for original bottles opened shortly after preparation. Original bottles opened after about 18 months of storage in ambient conditions yielded 2.89± 0.56% moisture with a range from 2.25% to 3.73%. Twenty bottles used in the investigations had been opened for several uses over a period of several months before the elemental analyses. These yielded 1.47 ± 0.27% moisture loss. This compares reasonably well to the moisture loss of 1.76± 0.16% estimated from the difference in hydrogen content determined by PGAA of freshly prepared samples and samples prepared from the desiccator dried material. Dried samples subjected for a week to ambient laboratory conditions regained their original mass to 99.2 ± 0.3% and yielded a second moisture loss of 1.61 ± 0.21%. The NIST KF result for these materials was 2.8± 0.4% water content.
Prompt gamma-ray activation analysis
The water content of the SWCNT was estimated by converting the mass fraction of the measured hydrogen to a mass fraction of water resulting in 5.09±0.26% (RSD, n= 8) water for the previously used SRM samples and 4.21± 0.18% water for the “fresh” NRCC samples. This approach may overestimate the amount of water since not all hydrogen is likely present as water; potential organic residues should be determined by gas mass spectrometry. It is clear from the TGA experiments that evolved gases contained hydrocarbon residues. These data are considered here simply for completeness of techniques, albeit the
0 0.1 0.2 0.3 0.4 0.5 0.6 0 50 100 150 200 250 300 350 400 450 500 550 Time, h Mass loss, %
Fig. 5 Typical loss of moisture on drying of SWCNT in a desiccator over anhydrous mag-nesium perchlorate. Note: error bars represent expanded uncer-tainty (U=0.01%)
conversion of differences in hydrogen content between dried and “fresh” samples yielded a comparable moisture loss. The possibility to study the behavior of hydrogen over time in drying during irradiation under vacuum was not pursued in this work.
Conclusions
Although the materials investigated in this study are not “pure” SWCNT in any definable way, they serve as an excellent model for the variety of samples obtained in production processes. The measurable behavior of their water content is important for their characterization, their use, and perhaps their commercial value. The selective measurement of water based on the KF titration permits its use as a benchmarking methodology for the determination of water content in SWCNT. Possibly due to their residual catalytic metal content, some samples may suffer oxidation reactions which lead to mass gains following initial loss of moisture during oven heating at 105 °C or for prolonged periods of time. Thus, as in the case of some coals and coke, the oven may have to be purged with dry nitrogen to minimize such an effect [21]. Since not all of the water in the sample may be liberated (detected) if the temperature is not high enough, this conflicting situation suggests that simple oven drying cannot be recommended for processing SWCNT samples. Drying over desiccants such as anhy-drous Mg(ClO4)2 provides a convenient and inexpensive
means of establishing a reproducible moisture content. A minimum desiccator drying period of 8 to10 days over anhydrous Mg(ClO4)2 is thus recommended for such
materials. Drying CNT material for determination of mass loss is needed irrespective of the RH of the user laboratory if moisture content impacts use or performance or any other characteristic that is mass-based (such as purity or cost).
The methodology selected by NRCC for bottling the SWCNT material proved to be effective for preserving their integrity with respect to moisture content over a 10-month period and when subjected to air transport, suggesting that this may prove efficacious for formal packaging of any subsequent reference material.
Acknowledgments The authors thank G. Robertson of NRCC’s Institute for Chemical Process and Environmental Technology (ICPET) for making available the TGA-FT-IR apparatus used in this study, F. Toll (ICPET) for performing the carbon content measure-ments and P. Rasmussen (Health Canada) for measuremeasure-ments of the SWCNT agglomerate particle size.
References
1. ISO TC 229 (2008) Nanotechnologies. ISO/TS 27687. Available at http://www.iso.org/iso/iso_technical_committee? commid=381983
2. Hassellov M, Readman JW, Ranville JF, Tiede K (2008) Ecotoxicol 17:344–361
3. Lead JR (2010) Environ Chem 7:1–2
4.http://www.bipm.org/en/home/
5. Iijima S (1991) Nat Lond 354:56–58
6. Zeisler R, Paul RL, Oflaz Spatz R, Yu LL, Mann JL, Kelly WR, Lang BE, Leigh SD, Fagan J (2011) Anal Bioanal Chem 399:509–517
7.http://www.iso.org/iso/products/standards/catalogue_ics_browse.
htm?ICS1=07&ICS2=030
8. Freiman S, Hooker S, Migler K, Arepalli S (2008) NIST special publication no. 960-19, U.S. Department of Commerce
9. Decker JE, Hight Walker AR, Bosnick K, Clifford CA, Dai L, Fagan J, Hooker S, Jakubek ZJ, Kingston C, Makar J, Mansfield E, Postek MT, Simard B, Sturgeon RE, Wise S, Vladar AE, Yang L, Zeisler R (2009) Metrologia 46:682–692
10. Belin T, Epron F (2005) Mater Sci Eng B119:105–118
11. Ruckold S, Grobecker KH, Isengard H-D (2001) Fresenius J Anal Chem 370:189–193
12. Naguib N, Ye H, Gogotsi Y, Yazicioglu AG, Megaridis CM, Yoshimura M (2004) Nano Lett 4:2223–2243
13. Strioloa A, Chialvo AA, Cummings PT, Gubbins KE (2006) J Chem Phys 124:074710–074711
14. Wang H-J, Xi X-K, Kleinhammes A, Wu Y (2008) Science 322:80–83
15. Ellison MD, Good AP, Kinnaman CS, Padgett NE (2005) J Phys Chem B 109:10640
16. Vassileva E, Quetel CR (2008) Food Chem 106:1485–1490 17. Yazgan S, Bernreuther A, Ulberth F, Isengard H-D (2006) Food
Chem 96:411–417
18. Mann JL, Kelly WR, MacDonald BS (2002) Anal Chem 74:3585–3591
19. Ruckold S, Grobecker KH, Isengard H-D (2001) Food Control 12:401–407
20. Ruchold S, Grobecker KH, Isengard H-D (2001) Fresenius J Anal Chem 370:189–193
21. American Society for Testing and Materials (D3173-03) (2008) Standard test method for moisture in the analysis sample of coal and coke”. ASTM International, Barr Harbor, PA
22. International Organization for Standardization, ISO 579:1990(E), “Coke—determination of moisture content”, Geneva, 1999 23. Isengard H-D (2001) Fresenius J Anal Chem 370:189–193 24. Kim KS, Cota-Sanchez G, Kingston CT, Imris M, Simard B,
Soucy G (2007) J Phys D 40:2375–2387
25. Resasco DE, Alvarez WE, Pompeo F, Balzano L, Herrera JE, Kitiyanan B, Borgna AJ (2002) Nanopart Res 4:131–136 26. Schmitt K, Isengard H-D (1998) Fresenius J Anal Chem 360:465–469 27. Paul RL, Lindstrom RM, Heald AE (1997) J Radioanal Nucl
Chem 215:63–68
28. Zeisler R, Oflaz R, Paul RL, Fagan JA (2011) J Radioanal Nucl Chem, doi:10.1007/s10967-011-1290-9
29. Isengard H-D (1995) Trends Food Sci Technol 6:155–162 30. Arepalli S, Nikolaev P, Gorelik O, Hadjiev VG, Holmes W, Files