Publisher’s version / Version de l'éditeur:
Vous avez des questions? Nous pouvons vous aider. Pour communiquer directement avec un auteur, consultez la première page de la revue dans laquelle son article a été publié afin de trouver ses coordonnées. Si vous n’arrivez pas à les repérer, communiquez avec nous à PublicationsArchive-ArchivesPublications@nrc-cnrc.gc.ca.
Questions? Contact the NRC Publications Archive team at
PublicationsArchive-ArchivesPublications@nrc-cnrc.gc.ca. If you wish to email the authors directly, please see the first page of the publication for their contact information.
https://publications-cnrc.canada.ca/fra/droits
L’accès à ce site Web et l’utilisation de son contenu sont assujettis aux conditions présentées dans le site LISEZ CES CONDITIONS ATTENTIVEMENT AVANT D’UTILISER CE SITE WEB.
8th International Coastal Structures Conference, pp. 69-78, 2019-10-02
READ THESE TERMS AND CONDITIONS CAREFULLY BEFORE USING THIS WEBSITE.
https://nrc-publications.canada.ca/eng/copyright
NRC Publications Archive Record / Notice des Archives des publications du CNRC : https://nrc-publications.canada.ca/eng/view/object/?id=cf9f9511-a66a-49a1-a480-1684cba77303 https://publications-cnrc.canada.ca/fra/voir/objet/?id=cf9f9511-a66a-49a1-a480-1684cba77303
NRC Publications Archive
Archives des publications du CNRC
This publication could be one of several versions: author’s original, accepted manuscript or the publisher’s version. / La version de cette publication peut être l’une des suivantes : la version prépublication de l’auteur, la version acceptée du manuscrit ou la version de l’éditeur.
For the publisher’s version, please access the DOI link below./ Pour consulter la version de l’éditeur, utilisez le lien DOI ci-dessous.
https://doi.org/10.18451/978-3-939230-64-9_008
Access and use of this website and the material on it are subject to the Terms and Conditions set forth at Physical modelling of extreme wave interaction with an offshore terminal
Abstract: This study involves an unnamed offshore export terminal in Australia. The berth is more than 40 years old, and consists of a series of concrete gravity caisson structures which support a steel superstructure and shiploader. The offshore facilities were originally designed to Working Stress principles, for a lower average recurrence interval event and a smaller maximum wave than is now recommended under modern Ultimate Limit State standards. A large-scale physical modelling study was undertaken to assess the design wave climate, the immunity of the berth, and potential structural mitigation measures. The 1:35 scale model structures were tested in several configurations for extreme wave conditions associated with return periods up to 1,000 years and for various incident wave headings. A large amount of high quality information on waves, water levels, forces, moments, pressures, and wave-structure interaction was obtained to inform the assessment of wave immunity and guide the design of reinforcement to mitigate higher wave loads.
Keywords: physical modelling, extreme waves, offshore terminal, caisson structures
1 Project Background
This study involves an unnamed offshore export terminal in Australia. The berth is more than 40 years old, and consists of a series of concrete gravity caisson structures which support a steel superstructure and shiploader. The offshore facilities were originally designed to Working Stress principles, for a lower average recurrence interval event and a smaller maximum wave than is now recommended under modern Ultimate Limit State standards. Aurecon and other partners undertook a study for the asset owners, assessing the design wave climate, and assessing the immunity of the berth and potential structural mitigation measures [see Blacka & Rayner (2011) and Anglin (2018)]. As part of the study, Aurecon commissioned physical model testing with the National Research Council of Canada (NRC).
Bathymetry information around the project site (see Figure 1) was developed based on a combination of navigation chart data and several sounding datasets. The immediate offshore area is relatively flat, with a typical elevation of −13.3 m. A 1V:4H batter slope forms the transition from the local native seabed elevation to the dredged navigation channel, while a 1V:3H batter slope forms the transition from the dredge navigation channel to the dredge pocket. The nearshore area features a transition from the dredged depth back to the native seabed elevations.
The design waves adopted for the study were based on a detailed met-ocean study. The design waves are a cyclonic sea-state with moderate directional spreading, where the standard deviation of wave directions is 20 degrees. The primary wave direction is perpendicular to the quay line, but waves approaching up to 30 degrees southward were also investigated. A set of target wave conditions for the physical model study was specified in terms of significant wave height, peak period, and mean direction (with spreading) specified just up-wave from the berth structures. However, due to uncertainty in predicting the effects of the wide shallow foreshore on the incident cyclonic wave conditions, the distribution of incident wave heights and crest elevations at the berth for design conditions was somewhat uncertain. Five short-crested sea-states, each approaching from three directions, were considered for model testing (more detail is provided in Section 3 below).
Physical Modelling of Extreme Wave Interaction with an Offshore
Terminal
S. Baker
National Research Council, Ottawa, Canada
S. Collins
Aurecon, Brisbane, Australia
A. Cornett
National Research Council, Ottawa, Canada
R. McLaren
The berth structures primarily consist of a series of concrete gravity caissons. The primary caissons each consist of a submerged rectangular hull from which four concrete columns rise above the free surface to support a steel superstructure comprising two shiploader rail girders, several transverse beams, a large shiploader crane, and a variety of other elements. The berth also includes other smaller caissons consisting of a submerged base supporting a steel jacket structure which supports a roadway deck and conveyor. For reasons of confidentiality, drawings and photos of the model and prototype structures cannot be included in this paper.
2 Physical Model Setup
An undistorted 1:35 scale 3D physical model of the berth structures and the surrounding bathymetry was constructed in NRC’s 50 m by 30 m Large Area Basin, representing a ~1.82 km2
rectangular area of prototype terrain (see Figure 1). The facility features a 30 m long state-of-the-art directional wave generator comprised of 72 independent wave boards that can generate short-crested sea-states with significant wave heights up to 0.4 m.
Fig. 1. Overview of the physical model.
The model bathymetry was a faithful representation of the existing seabed, including the native seabed area, dredged navigation channel, and berth pocket area. A digital elevation model (DEM) was created by combining various bathymetry datasets and assumed depths for certain regions. Elevations were extracted at 2.54 cm (model scale) intervals along a series of rows spaced 1 m apart and used to define a network of templates used to construct the model bathymetry. The resulting bathymetry templates were highly refined in the east-west direction (along the predominant direction of incident waves), while coarser in the north-south direction.
The bathymetry templates were precision cut and erected on a grid of levelled pads. The templates were backfilled with gravel and covered with a skin of concrete grout that was screeded to match the local elevations defined by the templates. Small rectangular cavities were constructed beneath the location of each berth structure to accommodate global force measurement systems.
Directional Wave Generator Berth structures Basin gate 1V:4H slope from dredge channel to native seabed elevation
1V:8H slope from native seabed elevation to basin floor Dredged approach channel Native seabed (approx EL -13.3m) Basin floor (EL -23.1m) Dredged berth pocket Edge of dredged approach channel Native seabed (EL varies) Native seabed (EL varies) Secondary wave absorbers Limit of model bathymetry ~1V:5H slope from native seabed elev. to basin floor WG5 Primary wave absorbers Secondary wave absorbers Basin floor
(EL -23.1m) Edge of dredged approach channel Limit of model bathymetry WG4 WG2 WG1 DA1 WG3 WG9 DA2 WG11 WG16 WG12 WG20 WG19 WG18 WG15 WG14 WG13 WG17 WG7 WG8 WG6 0 100 200 meters 0° 17° 30°
Incident wave angles relative to berth structures
2.1 Model Structure Design and Fabrication
The geometry of the prototype structures was defined in a set of drawings provided by Aurecon. Wherever possible, the model structures were a dimensionally accurate scaled reproduction of the prototype structures. Small deviations and/or simplifications were made for some components of the structures in order to use readily available construction materials and/or simplify construction. The chief model dimensions were generally accurate to within ± 2 mm of the target values (model scale). The model berth structures including scaled reproductions of the shiploader rail girders, the main transverse beams, and the parking deck. A simple representation of the roadway structure was also included, but slender steel trusses within the superstructure were not modelled.
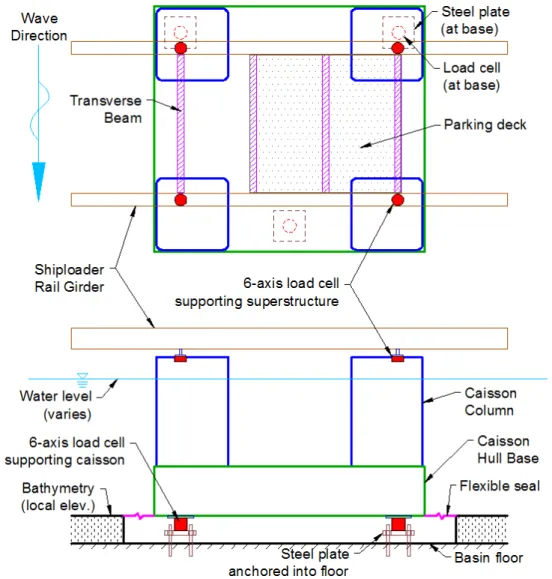
The caisson models were designed and setup so that global loads and moments due to wave action could be measured. One of the caisson models was also designed and setup so that the hydrodynamic loads and moments on the superstructure (rail girders, transverse beams, and parking deck) could be separately measured (see Figure 2). The parking deck was removable so that loads on the shiploader rail girders alone could be measured.
Fig. 2. Simplified schematic of the primary caisson models: plan view (top) and cross-section view (bottom).
The primary caisson hulls and columns were fabricated from marine grade plywood, and were designed and constructed with internal ribs to be stiff and lightweight, so that their natural frequencies of free vibration were maximized as much as possible. This ensured that inertial forces associated with model vibration were relatively small in magnitude and occurred at relatively high frequencies. This in turn helped ensure that impulsive hydrodynamic loads due to wave slam could be measured more accurately, and could be more easily differentiated from the spurious inertial loads caused by model vibration. The interior of the caissons was filled with closed cell foam to prevent the models from filling with water, thereby increasing in mass.
The shiploader rail girders and transverse beams were constructed using rectangular aluminum tubing, and laminated with strips of plywood where necessary to closely match the prototype beam
height and cross-sectional design. The rail girders were supported using short pieces of threaded rod that were mounted to the top of each caisson column. The rail girders were carefully installed to ensure the correct elevation and alignment. The parking deck and roadway were constructed using acrylic sheets fastened to aluminum bars and channels and were easily removable.
The smaller caisson had a similar hull constructed of marine grade plywood. The tower was fabricated using round aluminum tubing to represent the vertical and diagonal members, as well as local thickenings. A combination of rectangular and round aluminum tubing was used to construct the tower deck. A template was created to carefully control the layout of the tower deck members as they were welded together. Once completed, the vertical members were welded to the tower deck, and the entire assembly was fastened to the caisson lid. The (upper) steel deck structure was primarily fabricated using aluminum channel and bar. Where necessary, the pieces were laminated with strips of plywood to closely match the height of the prototype members (members smaller than 150 mm in the prototype were not included in the model). Finally, an acrylic deck was fastened to the top of the steel deck structure. As previously discussed, the smaller caisson model was similarly designed and constructed to be stiff and lightweight to maximize the natural frequency of free vibration.
2.2 Wave Measurement
Vertical fluctuations of the free surface (waves) were measured in the model using twenty-seven high-precision capacitance-wire wave gauges, sampled at a rate of 50 Hz. The gauges were positioned throughout the model domain, including in the offshore area (on the native seabed), along the edge of the dredged approach channel, along the centerline of the approach channel, along the centerline of the dredged berth pocket, and at key locations on and around the berthing structures (denoted WG# in Figure 1). Eight of the gauges were arranged in two compact arrays to collect the information necessary to resolve the directional properties of the wave field at two locations (denoted DA1 and DA2 in Figure 1).
2.3 Global Load Measurement
The global loads acting on two of the primary caissons were measured by two systems each comprised of three 6-axis load cells located beneath the model caissons in a triangular arrangement, similar to the setup in Babaei (2016, 2017), sampled at a rate of 1,000 Hz (see Figure 2). The static uplift pressure (buoyancy force) and the self-weight of the models was removed from the force measurement by re-zeroing the load cells in calm water before each test. An analysis procedure was developed to resolve the global loads and moments acting on the caissons based on the reactions measured at the six load cells (three per structure). A peak detection algorithm was applied to detect independent local maxima and minima in each of the force and moment records. Several other statistics were computed during analysis in order to obtain a more statistically stable and reliable measure of the extreme forces and moments recorded at each sensor in each test. In particular, the Max5 value was defined as the average value of the five largest positive independent peaks.
The maximum force or moment measured in one irregular wave test can be interpreted as a single estimate of the maximum force/moment that can be expected to occur over a 2-hour long exposure to steady irregular wave activity. Different 2-hour realizations of wave activity drawn from the same wave spectrum will each produce a different set of high waves and another (very likely different) estimate of the expected maximum force/moment. The maximums measured in repeated trials of the same wave record can also be somewhat variable, due to the fact that the maximum forces/moments can be sensitive to small variations in the wave crest elevation. In cases such as this, a less extreme statistic, such as the Max5 force or moment, can provide a more statistically stable and more reliable, albeit less extreme measure of peak force or moment. The Max5 force/moment can also be interpreted as an estimate of the maximum force/moment that can be expected to occur over a 24-minute exposure duration.
A series of tests was conducted in air to verify that the global force measurement systems and the analysis procedures developed to process the data were both working properly. First, a reference load cell was used to apply non-static loading on the model caissons while sampling the base load cell outputs. Second, known static loads and moments were applied to the model caissons while sampling
the load cell outputs. These tests confirmed that the global force measurement systems were able to resolve static and dynamic external loads and moments with good precision.
In reality, the caissons are bottom-founded and typically have only small dynamic pressures acting beneath them; however the model caissons were supported above the floor on load cells located in cavities below each model. The base of the model caissons was fitted with a thin flexible vinyl seal arranged to bridge the gap between the model base and the surrounding bathymetry, and (ideally) prevent dynamic pressures due to wave action from penetrating into the area beneath the model (see Figure 2). Unfortunately the seals were ineffective, and waves passing the test site were detected by pressure sensors located in the cavities beneath each structure. Therefore, a correction was applied to the vertical force measured by the caisson load cells, based on the pressure measured in the cavity multiplied by the caisson footprint.
Information on the free vibration frequencies of the model caissons was required in order to establish appropriate strategies for low-pass filtering in order to remove spurious inertial forces generated by the model’s vibrations. Subject to externally applied impulsive or dynamic loading, any structure, including the caisson models, will vibrate. These vibrations will generate inertial loads, proportional to the mass of the model and the accelerations, which will be sensed by the force measurement system. Hence, the force measurement system will measure both the externally applied hydrodynamic forcing and the spurious inertial forces resulting from the model vibrations. Unfortunately, these inertial forces can mask the true nature of the hydrodynamic loading. This situation can be partially resolved by low-pass filtering the measurements to remove the contributions due to model vibration. Unfortunately, the filtering operation will also suppress any parts of the hydrodynamic forcing at frequencies above the cut-off frequency. Selecting an appropriate cut-off frequency involves striking a balance between suppressing spurious inertial forces and not suppressing important hydrodynamic loading.
Any complex structure such as the caisson models will vibrate in many different modes, each having its own natural frequency. The free vibration frequencies of the caisson models were investigated by suddenly removing a static load applied by suspending a known mass while sampling the load cell outputs. The measurements were analyzed to identify the dominant natural frequencies of the model’s free vibration. Damping coefficients were also estimated by fitting an exponentially damped sinusoidal function to the measured vibration decay. Due to the nature of the model caisson construction (using wood materials) and the presence of flexible vinyl seals running around the perimeter of the caisson base, the resulting structure was moderately damped and exhibited very little free vibration and generated very small inertia forces. Hence it was decided to use the raw global loads as is without low-pass filtering.
The global loads acting on one of the smaller caissons was measured by a single 6-axis load cell, sampled at 1,000 Hz. A similar process was followed for confirming the accuracy of the load measurement system, and for collecting, analyzing, and processing the data.
2.4 Global Load Measurement on the Superstructure
The global loads acting on one of the caisson superstructures was measured by a system of four 6-axis load cells, sampled at a rate of 1,000 Hz (see Figure 2). An analysis procedure was developed to resolve the global loads and moments acting on the superstructure model, as well as the global forces acting on the front and rear rail girders, based on the reactions measured at the four load cells.
As previously described, a peak detection algorithm was applied to detect independent local maxima and minima in each of the force and moment records. Several additional statistics were computed in order to obtain a more statistically stable and reliable measure of the extreme forces and moments recorded at each sensor in each test. In particular, the Max5 value, defined as the average value of the five largest positive independent peaks, was computed and used to characterize extremes.
A similar series of tests was conducted in air to verify that the global force measurement systems and the analysis procedures developed to process the data were both working properly. The global force measurement system for the superstructure was able to resolve static and quasi-static external loads and moments with good precision. As would be expected, loads applied solely to the superstructure were equally measured by the base load cells. Transverse beam linkages between the front and rear rail girders resulted in significant transfer of axial load (from front-to-back or vice-versa), but almost no transfer of transverse load.
2.5 Local Pressure Measurement
The local pressures on the surface of the model structures were measured at thirty-one locations using 19 mm stainless steel pressure sensors suitable for measuring impulsive pressure fluctuations with rapid rise times, similar to the setup in Cornett (2013) and Knox (2014). The sensors were secured within water-tight enclosures that were installed into holes drilled through various locations on the model structures, and were sampled at a rate of 1,000 Hz.
A peak detection algorithm was applied to detect independent local maxima in each of the pressure records, and compute statistics to characterize the extreme pressure peaks. In particular, the Max5 value was defined as the average value of the five largest independent peaks. Different 2-hour realizations of wave activity drawn from the same wave spectrum will each produce another (very likely different) estimate of the expected maximum pressure. Moreover, in cases where the peak pressures result from runup, splash, and spray, the maximum pressure measured in repeated trials of the same wave record can also be highly variable, due to the fact that the maximum pressure in these situations can be sensitive to small variations in flow kinematics close to the sensor, such as the size and trajectory of individual water droplets. In cases such as this, a less extreme statistic, such as the
Max5 pressure, can provide a more statistically stable and more reliable, albeit less extreme measure
of peak pressure.
It should also be noted that in many tests, particularly those conducted with smaller waves and/or lower water levels, five or fewer significant pressure events were recorded at some sensors, and the
Max5 statistic is less meaningful in these situations.
3 Wave Climate Testing – Undisturbed Wave Tests
A key purpose of the physical model testing was to measure and confirm the distribution of wave heights and crest elevations and assess wave breaking across the relatively flat offshore bathymetry. Before installing the model caisson structures, a comprehensive series of initial wave climate tests was conducted to collect a large amount of wave data to establish distributions of the Hmax/Hs ratio which
could be produced in the facility with a multi-directional sea-state. There is relatively little published data on the Hmax/Hs ratio in multi-directional cyclonic sea-states, and this parameter was a key input
into the numerical met-ocean study which had been undertaken to define the design wave climate, design Hmax, and design wave crest levels.
The wave height measurements were assessed, and Hmax/Hs ratios calculated every 30 minutes
(prototype scale) to develop a series of wave height distributions. The data from all wave gauges across the basin were included to generate an overall Hmax/Hs distribution dataset. Three wave gauges
at the berth structures were also assessed as a group, with the Hmax from the three gauges taken every
30 minutes, to produce a combined Hmax/Hs distribution which included spatial distribution. This
combined dataset produced a higher Hmax/Hs distribution as expected, given the likelihood of a larger
Hmax is higher when more measurement locations are considered.
The results of this assessment are shown in Table 1, which indicates an average Hmax/Hs ratio of
~1.6-1.7 and a Hmax/Hs ratio of less than 1.8-1.9 for 90% of the time, for 30-minute intervals. The
maximum Hmax/Hs ratio measured in any of the multiple tests undertaken was 2.2.
Table. 1. Summary of Hmax/Hs ratio measurements at 30-minute increments (prototype scale)
Distribution – cumulative probability
Hmax/Hs
Single location * Berth length – maximum
Hmax across 3 locations **
10% 1.45 1.6
50% 1.6 1.7
90% 1.8 1.9
100% 2.2 2.2
* Adopting data from all individual wave gauge locations, representing wave height distribution at a given location. ** Adopting maximum Hmax every 30 minutes from three wave gauges at the berth, representing maximum wave height
The measured wave height distributions were adopted and incorporated into a revised numerical met-ocean study. This allowed refinement and confirmation of the design wave climate which was adopted by the project.
Following this initial series of wave climate testing, a second series of tests was conducted to prepare, calibrate, and verify the incident wave conditions to be used in the study and to verify Hmax/Hs ratios for the more extreme sea-states. These tests aimed to achieve the design wave
conditions (significant wave height, peak wave period, mean wave direction, and spreading) in the natural bed level area (east of the navigation channel), study the evolution of the wave field as it propagated over the dredged navigation channel, and measure wave heights and crest elevations at the location of the berth structures.
The wave conditions generated in this study were representative of extreme conditions at the site associated with average recurrence intervals (ARI) of 50, 100, 200, 500, and 1,000 years, approaching from three different directions (15 sea-states in total). Three different 2-hour long realizations (prototype scale) of each sea-state were generated, measured, and verified so that the variability of Hmax with time-domain realization could be considered (a total of 45 sea-states). For each prescribed
sea-state, an iterative procedure was followed to obtain a set of wave machine command signals which produced measured wave conditions at the location of interest that were in close agreement with specifications.
A side-wall reflection technique was used in this study to increase the physical area within the wave basin over which homogeneous wave conditions were generated. The technique involves purposely reflecting waves off the basin walls on either side of the wave machine (see Figure 1). This side-wall reflection technique was a crucial factor in being able to generate sea-states with moderate spreading and mean wave directions of up to 30° relative to the wave machine that were reasonably homogeneous across the test site.
While generating high-quality waves is important, absorbing the wave energy on the down-wave side of a model is equally important to ensure that the wave conditions in the model replicate nature to the highest possible degree. The facility was fitted with a large and highly-efficient passive wave absorber located opposite to the wave generator that was effective at absorbing and dissipating well over 95% of the incident wave energy over a broad range of water depths and wave periods. Additional portable wave absorber units were installed along both side walls to further reduce wave reflections (see Figure 1).
4 Wave-Structure Interaction Tests
The wave-structure testing program included a total of 135 unique tests. Tests were conducted with the berth structures configured in several different ways. Configuration 1 (C1) involved all berth structure elements, including the caisson structures and their corresponding superstructure elements: shiploader rail girders, transverse beams, roadway, and parking deck. Configuration 2 (C2) was obtained by removing the parking deck from the superstructure. Configuration 3 (C3) was obtained by removing all superstructure elements from the primary caissons. Finally, Configuration 4 (C4) involved removal of the superstructure from the smaller caisson.
4.1 Wave Conditions
The repeatability of the wave conditions realized at the test site throughout the entire testing program was assessed by comparing spectra and wave statistics for multiple runs of the same set of command signals. In general, statistics computed over the entire record, such as the significant wave height and peak period were very stable. However, extreme statistics based on the height of a single wave or a single value in the record, such as the maximum wave height or maximum crest amplitude, were less repeatable.
An in-depth analysis was performed by comparing the coefficients of variation (defined as the standard deviation divided by the mean value) of the significant wave height and maximum wave height measurements across all four test series. The average coefficient of variation for the significant wave height at gauges located in the berth pocket and near/at the berth structures was 1.3%, indicating very good repeatability. The average coefficient of variation for the maximum wave height was 6.7%, indicating that this extreme statistic was more variable. Some of this variability can be attributed to
small differences in wave board motions or measurement error, while some can be attributed to small differences in the wave breaking and wave-structure interaction process that affected the time history of the individual waves realized at each wave gauge location. It should also be noted that the three iterations of each ARI test condition were run with different wave time series, and while spectral parameters like significant wave height and peak period were effectively the same, it is to be expected that extreme values such as maximum wave height and maximum crest elevation would be far more variable. Overall, the repeatability of the generated waves lends confidence supporting comprehensive comparisons of loads and pressures on the berth structures under various model configurations.
4.2 Extreme Loads on Berth Structures
The influence of ARI and model configuration on the Max5 horizontal force and overturning moment is illustrated in Figure 3 (note that the results have been non-dimensionalized for reasons of confidentiality). The difference in peak force/moment for configurations 1 and 2 is due to removal of the superstructure parking deck, while the difference in peak load for configurations 2 and 3 is due to removal of the entire superstructure. Peak horizontal forces and moments were very similar during Configurations 1 and 2; however, there was a notable reduction in peak overturning moments for the 1,000-year ARI events when the parking deck was removed (for Configuration 2). For Configuration 1, the largest impact/uplift events on the underside of the parking deck were observed to occur during exposure to the 1,000-year ARI wave and water level conditions.
Very similar trends were observed for the extreme loads on the caisson superstructure itself. In general, the front rail girder saw greater horizontal impacts, while the rear rail girder saw larger vertical impacts. As expected, the uplift forces on the rear rail girder were significantly larger during Configuration 1, particularly during larger ARI events when wave impacts with the underside of the parking deck were larger and more frequent.
As expected, there was a moderate reduction in peak horizontal force and a large reduction in peak overturning moment for Configuration 3 when all the superstructure elements were removed, and these differences were more prominent at larger ARI events when wave impacts with the superstructure were more frequent and more forceful.
The influence of incident wave direction on the Max5 horizontal force and overturning moment was also as expected: peak horizontal forces and overturning moments were greater for waves approaching the structure head-on, since more of the structure was impacted simultaneously. Again, these variations were more prominent for larger ARI events when wave impacts with the superstructure tended to be larger and more frequent.
One of the primary model caissons did not undergo changes between Configuration 1 and 2, providing an opportunity for in-depth analysis of the repeatability of the wave loading. Figure 4 demonstrates the typical repeatability of Max5 horizontal forces and overturning moments for one particular ARI condition. In this case, tests with three different sea-state realizations all synthesized from the same wave spectrum (i.e. with the same parameters for significant wave height and peak wave period) were each conducted twice (a total of six tests for comparison). It was observed that the forces and moments in the repeated cases were nearly identical to the original, which provides a high degree of confidence in the measurements. Noteworthy is the fact that the different sea-state realizations (which are distinct wave time series) do show some variation from each other. As previously discussed, these unique time series contain different maximum waves and are thus expected to produce different maximum pressures, forces, and moments.
The coefficient of variation (defined as the standard deviation divided by the mean value) for the
Max5 horizontal force and overturning moment averaged over the full range of ARI events and wave
directions was 4.9% and 11.0%, respectively. A similar analysis for the individual maximum horizontal force and overturning moment yielded values of 8.2% and 19.2%, respectively. These results demonstrate wave loading variability between tests and the importance of not only duplicating some number of tests to confirm the repeatability of the measurements, but more importantly, of testing multiple realizations of the same sea-state to capture and better understand wave and load variability. These results also demonstrate that the variability of a single extreme value can be quite large, and confirms the benefit of considering a slightly less but more stable extreme statistic, such as the Max5 value discussed here.
Fig. 4. Non-dimensionalized Max5 horizontal forces and overturning moments in equivalent wave conditions.
5 Conclusions
A comprehensive large-scale physical model testing campaign was carried out as part of a large study to assess the immunity of an offshore export terminal. The 1:35 scale model structures were tested in several configurations for extreme wave conditions associated with return periods up to 1,000 years and for various incident wave headings. A large amount of high quality information on waves, water levels, forces, moments, pressures, and wave-structure interaction was obtained.
The wave climate testing allowed wave height distributions for multi-directional sea-states to be developed. A Hmax/Hs ratio typically between 1.5-1.9 was measured, with a maximum of 2.2 across all
the tests. The measured wave height distributions were adopted and incorporated into a revised numerical met-ocean study.
The experiment results on wave loading and local pressure are being used as key inputs into a series of structural modifications and upgrades for the berth.
References
Anglin, D., 2018. Case study – structural reliability assessment for marine terminal. Proceedings of the RPIC Marine Infrastructure National Workshop.
Apelt, C.J., Macknight, A., 1976. Wave action on large off-shore structures. Proceedings of the 15th International Conference on Coastal Engineering.
Baarholm, R., 2009. Experimental and theoretical study of three-dimensional effects on vertical wave-in-deck forces, in: Proceedings of the 28th International Conference on Ocean, Offshore and Arctic Engineering. pp. 451–459.
Babaei, H., Baker, S., Cornett, A., 2016. Validation of a CFD tool for studying the interaction of extreme waves with offshore gravity-based structures, in: Proceedings of the 6th International Conference on the Application of Physical Modelling in Coastal and Port Engineering and Science.
Babaei, H., Baker, S., Cornett, A., 2017. Validation of an open-source CFD tool to support efficient design of offshore gravity-based structures exposed to extreme waves, in: Proceedings of the 27th International Ocean and Polar Engineering Conference.
Bea, R., Xu, T., Stear, J., Ramos, R., 1999. Wave forces on decks of offshore platforms. Journal of Waterway, Port, Coastal and Ocean Engineering, 125 (3), 136–144.
Bea, R.G., Iversen, R., Xu, T., 2000. Wave-in-deck forces on offshore platforms. Journal of Offshore Mechanics and Arctic Engineering, 123 (1), 10–21.
Blacka, M.J., Rayner, D.S., 2011. Three dimensional caisson modelling [at unnamed site]. Water Research Laboratory technical report 2011/28, University of New South Wales.
Collins, S. Colleter, G., Nilsen, A., 2013. Wave loads on vulnerable deck structures – model testing, analysis and mitigation solutions, in: Proceedings of the 21st Australasian Coastal and Ocean Engineering Conference and 14th Australasian Port and Harbour Conference.
Cornett, A., Anglin, D., Elliott, T., 2013. Wave-in-deck loads for an intricate pile-supported pier and variation with deck clearance, in: Proceedings of the 32nd International Conference on Ocean, Offshore and Arctic Engineering.
Elshafey, A.A., Haddara, M. R., Marzouk, H., 2009. Dynamic response of offshore jacket structures under random loads. Marine Structures, Elsevier, 22 (3), 504–521.
Hughes, S.A. 1993. Physical models and laboratory techniques in coastal engineering. World Scientific, New Jersey. Isaacson, M., 1988. Wave and current forces on fixed offshore structures. Canadian Journal of Civil Engineering, 15 (6),
937–947.
Jamieson, W.W., Mansard, E.P.D., 1987. An efficient upright wave absorber, in: Proceedings of the ASCE Specialty Conference on Coastal Hydrodynamics.
Knox, P., Anglin, D., Cornett, A., Hall, E., Armstrong, M., 2014. Role of physical modeling in developing a new cruise ship terminal at an exposed site, in: Proceedings of the 34th International Conference on Coastal Engineering.
Murali, K., Sundar, V., Setti, K., 2009. Wave-induced pressures and forces on deck slabs near the free surface. Journal of Waterway, Port, Coastal and Ocean Engineering, 135 (6), 269–277.
Stansberg, C.T., Baarholm, R., Fokk, T., Gudmestad, O.T., Haver, S., 2004. Wave amplification and possible deck impact on gravity based structure in 10-4 probability extreme crest heights, in: Proceedings of the 23rd International Conference on Offshore Mechanics and Arctic Engineering. pp. 911–920.