Economic study of the treatment of surface water by small
ultrafiltration units
M Drouiche
1, H Lounici
1, D Belhocine
1, H Grib
1, D Piron
2and N Mameri
1*
1 Ecole Nationale Polytechnique d’Alger, 10 Avenue Pasteur, 16200, El-Harrach, Alger, Algeria 2 Ecole Polytechnique de Montréal, B.P.6079. Station Centre-ville, Montréal, Qc, Canada H3C 3A7Abstract
The purpose of this work is to evaluate the possibility of utilising an ultrafiltration process for the treatment of water from the dam in the Kabylia region of Algeria and, in particular, for the provision of drinking water to people living in dispersed small villages. The water quality was determined by measuring turbidity, and natural organic matter concentration. The results obtained with an ultrafiltration process indicate that this technique can considerably reduce suspended and organic matter. It also improves the bacteriological quality of the treated water. An economic evaluation for ultrafiltration of surface water is presented. The economic study was performed for a drinking water unit of 20 m3/h . It was found that the cost per m3 of treated water ($ 0.235/m3) obtained
would not be excessively high for the states of the North African region.
Notation
Jv Permeate flux (l/h·m2)
ODc Optic density of the concentrate solution ODp Optic density of the permeate solution Po Oulet membrane pressure (Pa) P1 Inlet membrane pressure (Pa)
ROD Experimental apparent rejection coefficient based on optic density (%)
RTur Experimental apparent rejection coefficient based on turbidity (%)
T Temperature (oC)
Turc Turbidity of the concentrate solution (NTU) Turp Turbidity of the permeate solution (NTU) U Tangential velocity (m/s)
UF Ultrafiltration process
DP Average transmembrane pressure (Pa)
Introduction
Access to water as a natural resource is a serious problem in the North African region. The treatment of water before distribution to people is essential in order to maintain quality of life. The North African population is increasing and the greatest rate of future growth will be in cities. Governments in this region use the full extent of economic capacity and current knowledge to develop acceptable urban environments and an efficient water supply. Lower priority is given to supplying water to small villages dispersed in the North African region. The long distances between the water reservoirs and these villages, as well as the tropical temperature of this region, necessitate a chlorine disinfection process which, as result of the presence of natural organic matter (NOM) in the raw water, may lead to the formation of carcinogenic by-products. Furthermore, the digestible organic carbon present in NOM leads to a potential for bacterial regrowth in distribution
systems (Lin et al., 2000).
The required conformity to microbiological standards for drinking water cannot be guaranteed cost-effectively by con-ventional technologies (Brugger, 2000). Membrane technology has been utilised to solve this problem, and the efficiency of this process has made it possible to increase the quantity and the quality of drinking water distributed to the rural population (Lin et al., 2000; Jolis et al., 1999 and Yuasa, 1998, Magara et al., 1998; Brahiti et al., 1994, Anselme et al., 1992, Tazi-Pain et al., 1992; Bersillon et al., 1989).
The main purpose of this work was to investigate the operation and efficiency of ultrafiltration in the treatment of surface water to drinking water standards for supply to small villages of the Kabylia region, with populations not exceeding 3 000. In the present study, an organic ultrafiltration membrane was used to treat surface water collected from the Keddara Dam under various experimental conditions. The effect of average transmembrane pressure (P) and tangential flow rate (U) on the performance of ultrafiltration membranes was measured. Raw water was treated by ultrafiltration under optimal conditions (tangential velocity and average transmembrane pressure), and an economic study of the membrane process was conducted.
Materials and methods
The main physico-chemical characteristics of Keddara Dam water are presented in Table 1. The water quality was determined by measuring the following parameters (Lefebvre, 1995): pH (WTW, model 1223), conductivity (TOA model CM-8ET), turbidity (HACH, model 2100A) and optic density at 254 nm and 270 nm (MILTON ROY UV/Vis spectrophotometer, model Spectronic 1201). The latter two determinants express values for suspended matter and dissolved organic matter in the raw water. The bacteriological quality of the water is evaluated by determining biological cell counts by the spread-plate method (ASM, 1987).
Ultrafiltration experiments were performed using the Microlab 130 S pilot unit made by Gamma Filtration, France. It was equipped with an organic Patterson Candy International (PCI-BX6) membrane with a molecular mass cut-off of 20 kDa. The PCI module was composed of 18 tubular polysulfone membranes with a length of
* To whom all correspondence should be addressed.
((514) 340 4710 x 4763; fax (514) 340 4167; e-mail: nabil.mameri@courriel.polymtl.ca
1.2 m and an internal diameter of 12.5 mm, yielding a total filtration area of 0.86 m2.
Two operating modes were used (Fig. 1). The first mode consisted of ultrafiltration with permeate recycling. It allowed the study of the influence of the hydrodynamic parameters on the performance of the ultrafiltration process for an initial raw water concentration. The second operating mode was used to study raw water treatment by ultrafiltration. In this mode, no permeate recirculation to the feed tank of 25 l capacity was used. The ultrafiltration experiments were conducted at 20°C under an average
transmembrane pressure (P0+P1)/2 of between 50 and 350 kPa. All experiments were duplicated, and the experimental error did not exceed 8%.
Results and discussion
Influence of hydrodynamic parameters on permeate flux
The influence of the average transmembrane pressure (DP) and the tangential flow rates (U) on the permeate flux Jv was studied with permeate recycling. From the results shown in Fig. 2, it can be deduced that the variation of the permeate flux was practically independent of U in the range tested. The results also show that a linear relationship exists between Jv and DP, which indicates that polarisation and fouling phenomena were not predominant under the prevailing operating conditions, since at higher transmembrane pressures, gel layers (represented by limiting fluxes) were not encountered (Mameri et al., 1996; Belhocine et al., 1998; Belhocine et al., 2000). These results indicate that the raw water contained low concentrations of suspended solids and organic matter. For the treatment of the raw water, a tangential flow rate U= 0.6 m/s was utilised to reduce the negative impact of the polarisation layer during the production of drinking water with the ultrafiltration process operating without permeate recycling.
The distilled water permeability, representing the characteristic parameter of the ultrafiltration membrane, was determined for both new membranes and for membranes which previously had been subjected to raw water ultrafiltration. The results, presented in Fig. 3, show a linear increase in permeate flux with transmembrane pressure increase, which is in agreement with the Poiseuille law. It appears that the pure water permeabilities are of the same order with a permeability decrease of only about 5% after raw water ultrafiltration. The initial membrane permeability was always TABLE 1
Typical range of raw water quality parameters from Keddara Dam
Determinant Monthly average range
pH 7.8 - 8.1 Conductivity (mS/cm) 1.03 - 1.20 Turbidity (NTU) 1.2 - 1.6 Optic density 254 nm 0.051 - 0.068 Optic density 270 nm 0.047 - 0.063 Oxidation KMnO4 (mg/l) 3.4 - 4.2 Total coliform (106cfu/100 ml) 0.35 - 0.77
a
b
Figure 1
Schematic representation of the ultrafiltration process. Ultrafiltration with (a) and without recycling permeate (b).
T: Feed tank; PC: Recycling pump; PA: Feed pump; M: ultrafiltration module. Po :Outlet membrane pressure ;
P1 : Inlet membrane pressure .
0 50 100 150 200 250 0 2 4 6 ∆P (105 Pa) Jv (l.h -1 .m -2 ) Figure 2
Influence of tangential flow rate and average transmembrane pressure on permeate flux (Jv). (·) U= 0.3 m/s, (¡)U= 0.6 m/sand
restored after a cleaning operation. Cleaning of the PCI membrane was carried out using dilute sulphuric acid (pH 4) at 30oC for 15
min.
Variation of the water quality parameters
Conductivity and pH of the concentrate and permeate were also monitored during raw water ultrafiltration at U = 0.6 m/s. It was found that the conductivity and pH of the two streams remained of the same order. This result may be explained by the fact that the ultrafiltration membrane was not able to modify the ionic strength of the raw water, particularly the H3O+ ions and salt concentration.
A considerable difference in turbidity was observed between the permeate and the concentrate solutions. Indeed, the turbidity of the permeate and concentrate solutions reached limiting values of 0.6 NTU and 2.5 NTU, respectively. These results indicate the ability of the ultrafiltration membrane to retain the suspended matter (Fig. 4).
It also showed that NOM is retained by the membrane yielding a permeate solution less charged in organic matter (Fig. 5).
To measure the efficiency of UF for treating raw water, apparent retention coefficients for turbidity (RTur) and optic density (ROD) were determined. The apparent retention coefficients were calculated by the following equations:
(1)
(2) The values of ROD and RTur calculated for the various tangential flow rates (U) and average transmembrane pressures (DP) showed that they were practically independent of the average transmembrane pressure and the tangential flow rate for the PCI membrane. They ranged from 20 to 30% for ROD, and around 70% for RTur. These
results are in agreement with those obtained by others (Brahiti et al., 1994; Jolis et al., 1999; Van Hoof, 2000), indicating that ultra-filtration considerably reduces suspended solids and organic matter. Treatment of raw water without recycling permeate Treatment of the raw water was conducted under the optimum conditions determined during the previous recycle experiment. The tangential flow rate U = 0.6 m/s was chosen as an optimum value to reduce the negative impact of the polarisation layer during y = 35.632x R2 = 0.964 0 25 50 75 100 0 1 2 3 ∆P (105 Pa) Jv (l.h -1 .m -2 ) Figure 3
Hydraulic membrane permeability with (·) virgin membrane and (-) after raw water ultrafiltration
0 1 2 3 0 1 2 3 4 ∆P(105 Pa) Turb.(NTU) 0 0.002 0.004 0.006 0.008 0 1 2 3 4 ∆P(105 Pa) OD Figure 4
Changes of the turbidity for the raw water ultrafiltration with permeate recycling at various transmembrane pressures
at U = 0.6 m/s
(·) concentrate and () permeate
Figure 5
Changes in the optical density (254 nm) for raw water ultrafiltration with permeate recycling at various
trans-membrane pressures at U = 0.6 m/s (¡) concentrate and () permeate
100 1 (%) X Tur Tur R c p Tur − = 100 1 (%) X OD OD R c p OD − =
the production of drinking water. The optimum transmembrane pressure (DP) retained was about 2.5 x 10⁵ Pa giving a high
permeate flux without changing the membrane porosity which may be damaged at higher DP. Permeate flux (Fig. 6) shows an initial flux which declines and rapidly reaches a steady-state value after an equilibrium period of 0.5 h. The permeate flux reduction after equilibrium time was about 10% for the PCI membrane.
It was also observed that the RTur and ROD reached steady-state values after equilibrium periods similar to that of permeate flux. These results indicate that it may be possible to obtain yields in the range of 95 to 98% as well as a long operation time before the membranes need chemical cleaning. The bacteriological quality of the water is considerably improved. Indeed, reduction factors of between 6 log and 4 log were obtained for bacteria and viruses, respectively (Table 2). These results on water quality are reassuring both for the population and the water companies.
Economic evaluation of the UF process
The membrane technique makes it possible to improve water quality, but the ultrafiltration process does not require softening pretreatments depending on the membrane type and the mineralisation of the treated water. The complete UF unit is presented in Fig. 7. The natural surface water was, first, passed through the cartridge filter F1 (100 mm) as a prefiltration step, before transfer to the feed tank T1 of the UF unit. This first step requires utilisation of the pump P1.
The water stored in the feed tank T1 is pumped under the required pressure to the UF unit by means of the pump P2 . The water treated by the ultrafiltration unit is stored in tank T2 which serves the urban water network. The concentrate solution produced by the ultrafiltration process is transferred temporarily to the tank T3 and is pumped by P3 to the exposition area built for water elimination by natural evaporation. Dimensions and evaluation of the main equipment of the UF process
The ultrafiltration process splits the feed water into two: the permeate product and the retentate concentrate streams. The quality of these solutions is linked to the water analysis, the transmembrane pressure, the yield and concentration in the retentate streams. The results previously presented made it possible to establish appropriate operating conditions for the ultrafiltration process, which are as follows:
• Transmembrane pressure: 250 - 300 kPa that gives a high permeate pressure without altering the porosity of the membrane,
• Yield: 95 to 98% obtained as well as the long operation time before the membranes need chemical cleaning,
• Concentrate stream: maximum solubility of the dissolved matter.
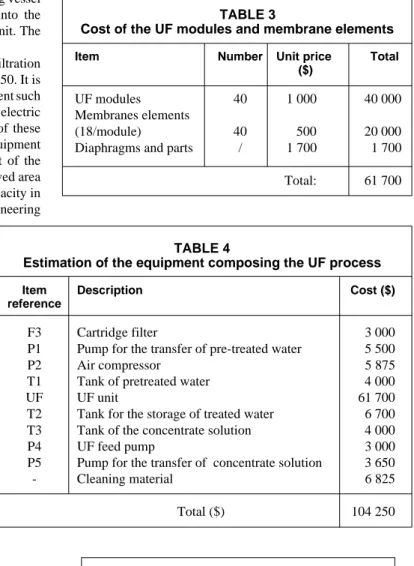
These conditions were utilised to predict the dimensions and the design of a 20 m3/h ultrafiltration unit. The
results obtained are reported in Table 3. The cost of the ultrafiltration membranes and modules is about $61 700. It is important to add to this the cost of the
0 25 50 75 100 0 10 20 30 Time (h) Jv ( l/m 2 bar h) 0 25 50 75 100 Ro (%) TABLE 2
Bacteriological quality of the raw water before and after treatment
Parameter Before treatment After ultrafiltration
Monthly average Monthly average
range range
Total coliform 0.35 - 0.77 Undetectable –
(106cfu/100 ml) 1 (cfu/100 ml)
Streptococcus group 0.3 - 0.5 Undetectable (105cfu/100 ml) (cfu/100 ml)
Enteric viruses 3 - 8 20 - 50
(105u/100 ml) (u/100 ml)
Figure 6
Changes in the permeate flux (¯), ROD (¡) and RTur (D) during the treatment of the raw water without recycling permeate at
U = 0.6 m/s, T = 20oC and DP = 2.5 bars
Figure 7
membrane cleaning operation which requires a 3 m3 mixing vessel
and a pump for the injection of the cleaner solution into the ultrafiltration unit and into all the pipes comprising the unit. The cost of the cleaning equipment is estimated at $6 825.
Estimation for all the equipment composing the ultrafiltration unit is presented in Table 4. The total cost is about $104 250. It is important to consider the cost induced by auxiliary equipment such as regulation apparatus, control and measuring apparatus, electric power installations and electric switchgear. Estimation of these items is expressed as a percentage of the cost of the main equipment (see Table 5). The civil infrastructure for the treatment of the concentrate solution consists in the realisation of a contrived area with a surface of 200 m2, calculated with evaporation capacity in
the range of 8 to 10 x10-3 m3/hm2. The cost of the civil engineering
works is valuated at $14 000.
The site, where the ultrafiltration unit and the control room etc. will be installed, has a surface area of about 400 m2 and their cost is estimated at $56 000. The
total cost for civil engineering works and infrastructure is about $70 000.
The subtotal cost to realise the ultrafiltration unit for the treatment of the surface water from Keddara Dam, presented in Table 6, is obtained by addition of the cost of the main components previously presented, transport and installation costs of all the main equipment and their spare parts. Estimation of these is also expressed as a percentage of the cost of the main equipment.
The total cost is obtained by multiplying the subtotal previously obtained by 1.1. The added 10% contingency represents engineering studies and all other costs that have not been considered. The total cost to realise the ultrafiltration treatment facility for the production of 20 m3/h is about $210 000.
The economic performance of the processes
The performance of the process is evaluated on the basis of 8 000 h/yr operating time. The cost price of the /m3 of treated water
is determined by taking into account the power costs, the membrane replacement cost, the consumables, the maintenance cost, the interest on the invested capital, and the amortised capital and labour costs.
Table 7 gives the cost of the ultrafiltration process. The consumable costs are estimated at $0.005/m3 , whereas, maintenance
costs and the interest on invested capital are fixed at 1.5 and 3% per year of the invested capital, respectively. Fifteen years amortised capital cost is considered for the process. The labour costs in North Africa may be considered to be negligible compared with the other cost items.
Conclusion
Ultrafiltration appears to be efficient for reducing the suspended matter and the natural organic matter present in raw water. The results obtained indicate that it may be possible to produce drinking water from surface water.
The cost of $0.235 per m3 of the treated surface water does not
seem expensive, since the people in the region buy bottled drinking water at $0.2 per litre. This solution could therefore be considered by the states of the North African region.
TABLE 4
Estimation of the equipment composing the UF process
Item Description Cost ($)
reference
F3 Cartridge filter 3 000
P1 Pump for the transfer of pre-treated water 5 500
P2 Air compressor 5 875
T1 Tank of pretreated water 4 000
UF UF unit 61 700
T2 Tank for the storage of treated water 6 700
T3 Tank of the concentrate solution 4 000
P4 UF feed pump 3 000
P5 Pump for the transfer of concentrate solution 3 650
- Cleaning material 6 825
Total ($) 104 250
TABLE 5
Auxiliary equipment costs
Item Cost ($)
pipes and accessories (20 %) 20 850
Regulation apparatus (15%) 15 640
Measurement and control apparatus (7%) 7 300 Electric and power installation (17%) 17 720 Electric command installation (5%) 5 200
Total: 66 720
TABLE 6
Total cost for the realisation of the UF process
Item Cost ($)
Main materials 104 250
Installation of the equipment (10%) 10 425 Transport of the main materials (3%) 3 130
Auxiliary equipment 66 720
Civil infrastructure and engineering 70 000
Spare parts (5%) 5 210
Construction site insurance (1%) 1 040
Subtotal 190 775
Engineering studies and all other costs (10%) 19 100 TABLE 3
Cost of the UF modules and membrane elements
Item Number Unit price Total
($)
UF modules 40 1 000 40 000
Membranes elements
(18/module) 40 500 20 000
Diaphragms and parts / 1 700 1 700
References
ANSELME C , CHEVALIER MR, MAZOUNIE P and MALLEVIALLE J (1992) Applications industrielles de l’ultrafiltration pour la production d’eau potable. Bilan de fonctionnement des installations. Perspectives d’évolution, Tech. Sci. Munic. 9 403-408.
ASM (1987) Manual of Methods for General Bacteriology. Am. Soc. for Microbiol., Washington, DC.
BELHOCINE D, MOKRANE H, GRIB H, PAUSS A and MAMERI N (2000) Membrane fouling during recovery of papain enzyme. Chem.
Eng. J. 76 (3) 189-196.
BELHOCINE D, GRIB H, ABDESMED D, COMEAU Y and MAMERI N (1998) Optimization of plasma protein concentration by ultrafiltra-tion. J. Membr. Sci. 142 159-171.
BERSILLON JL, ANSELME C, MALLEVIALLE J, APTEL P and FIESSINGER F (1989) L’ultrafiltration appliquée au traitement de l’eau potable: Le cas d’un petit système. Eau Ind. Nuisances 1 61-64. BRAHITI SE, DAKHI S, ABDESSMED D, GAID A and MAMERI N (1994) Traitement tertiaire des eaux usées par ultrafiltration. Trib.
CEBEDEAU 571 (5) 39-43.
BRUGGER A (2000) Reuse of filter backwash water using ultrafiltration technology. Filtr. Sep. 37 (1) 22-26.
TABLE 7 Process performance
Item UF
($/m3)
Power costs (0.05$/kWh) 0.010
Membrane replacement (life-time 5 years) 0.025
Consumables (cleaning products, cartridge filtration) 0.005 Maintenance costs (1.5% per year of the investment) 0.026 Interest on the invested capital (3% per year of the investment) 0.052 Amortised capital cost (in 15 year period) 0.117 Labour costs (assumed to be negligible) /
Total: ($/m3) 0.235
JOLIS D, HIRANO R and PITT P (1999) Tertiary treatment using microfiltration and UV disinfection for water reclamation. Water
Environ. Res. 71 (2) 224-231.
LIN CF, LIN T-Y and HAO OJ (2000) Effects of humic substance characteristics on UF performance. Water Res. 34 (4) 1097-1106. LEFEBVRE E (1995) Etude par des paramètres globaux de la matière
organique d’eaux brutes et clarifiées. Rev. Sci. Eau 8 (2) 125-150. MAGARA Y, KUNICANE S and ITOH M (1998) Advanced membrane
technology for application to water treatment. Water Sci. & Technol. 37 (10) 91-99.
MAMERI N, ABDESMED D, BELHOCINE D, LOUNICI H, GAVACH C, SANDEAUX J and SANDEAUX R (1996) Treatment of fishery washing waters by ultrafiltration. J. Chem. Biotechnol. 67 169-175. TAZI-PAIN A, FAIVE M and BOURBIOT M (1992) Comparaison des
techniques membranaires pour le traitement des eaux de surface chargées en matières organiques: perspectives d’évolution. Tech. Sci.
Munic. 9 411-415.
YUASA A (1998) Drinking water production by coagulation-microfiltration and adsorption-ultrafiltration. Water Sci. & Technol. 37 (10) 135-146. VAN HOOF S (2000) Semi dead-end ultrafiltration in potable water