HAL Id: hal-03009608
https://hal.univ-reunion.fr/hal-03009608
Submitted on 17 Nov 2020
HAL is a multi-disciplinary open access
archive for the deposit and dissemination of
sci-entific research documents, whether they are
pub-lished or not. The documents may come from
teaching and research institutions in France or
abroad, or from public or private research centers.
L’archive ouverte pluridisciplinaire HAL, est
destinée au dépôt et à la diffusion de documents
scientifiques de niveau recherche, publiés ou non,
émanant des établissements d’enseignement et de
recherche français ou étrangers, des laboratoires
publics ou privés.
Distributed under a Creative Commons Attribution| 4.0 International License
seabird: Implication for subspecies validation and
conservation
Laurence Humeau, Matthieu Le Corre, Silas Reynolds, Colin Wearn, Janos
Hennicke, James Russell, Yann Gomard, Hélène Magalon, Patrick Pinet,
Pauline Gélin, et al.
To cite this version:
Laurence Humeau, Matthieu Le Corre, Silas Reynolds, Colin Wearn, Janos Hennicke, et al.. Genetic
structuring among colonies of a pantropical seabird: Implication for subspecies validation and
conser-vation. Ecology and Evolution, Wiley Open Access, 2020, 10, pp.11886 - 11905. �10.1002/ece3.6635�.
�hal-03009608�
11886 | www.ecolevol.org Ecology and Evolution. 2020;10:11886–11905.
Received: 18 September 2019
|
Revised: 8 July 2020|
Accepted: 9 July 2020 DOI: 10.1002/ece3.6635O R I G I N A L R E S E A R C H
Genetic structuring among colonies of a pantropical seabird:
Implication for subspecies validation and conservation
Laurence Humeau
1| Matthieu Le Corre
2| S. James Reynolds
3,4| Colin Wearn
5|
Janos C. Hennicke
6,7| James C. Russell
2,8| Yann Gomard
9| Hélène Magalon
2|
Patrick Pinet
2,10| Pauline Gélin
2| François-Xavier Couzi
11| Etienne Bemanaja
12|
Vikash Tatayah
13| Bacar Ousseni
14| Gérard Rocamora
15,16| Patrick Talbot
17|
Nirmal Shah
18| Leandro Bugoni
19| Denis Da Silva
1| Audrey Jaeger
21UMR PVBMT, Université de La Réunion, CIRAD, Saint-Denis Cedex 9, La Réunion, France 2UMR ENTROPIE, Université de La Réunion, IRD, CNRS, Saint-Denis Cedex 9, La Réunion, France
3Centre for Ornithology, School of Biosciences, College of Life & Environmental Sciences, University of Birmingham, Birmingham, UK 4Army Ornithological Society (AOS), c/o Prince Consort Library, Aldershot, Hampshire, UK
5Royal Air Force Ornithological Society (RAFOS), Royal Air Force Headquarters, Buckinghamshire, UK 6Department of Ecology and Conservation, Biocentre Grindel, University of Hamburg, Hamburg, Germany 7Centre d'Etudes Biologiques de Chizé, CEBC-CNRS, Villiers-en-Bois, France
8School of Biological Sciences and Department of Statistics, University of Auckland, Auckland, New Zealand
9UMR PIMIT, CNRS, INSERM, IRD, Université de La Réunion, Plateforme Technologique CYROI, Sainte-Clotilde, La Réunion, France 10Parc National de La Réunion, La Plaine des Palmistes, La Réunion, France
11Société d'Etudes Ornithologiques de La Réunion (SEOR), Saint André, La Réunion, France 12Centre National de Recherches Océanographiques (CNRO), Nosy Be, Madagascar 13Mauritian Wildlife Foundation, Vacoas, Mauritius
14GEPOMAY, M'tsangamouji, Mayotte, France 15Island Conservation Society, Mahé, Seychelles
16Island Biodiversity and Conservation centre, University of Seychelles, Mahé, Seychelles 17Bermuda Zoological Society, Flatts, Bermuda
18Nature Seychelles, The Center for Environment and Education, Mahé, Seychelles
19Instituto de Ciências Biológicas, Universidade Federal do Rio Grande (FURG), Rio Grande, Brazil
This is an open access article under the terms of the Creative Commons Attribution License, which permits use, distribution and reproduction in any medium, provided the original work is properly cited.
© 2020 The Authors. Ecology and Evolution published by John Wiley & Sons Ltd
Correspondence
Laurence Humeau, Université de La Réunion, UMR PVBMT, 15 avenue René Cassin, 97715 Saint-Denis. Réunion, France. Email: [email protected]
Funding information
AAP Iles Eparses “OMABIO” project; FRROI; Programme Opérationnel de Coopération Territoriale 2007-2013, Grant/Award Number: 31189; Marie Curie Research Fellowship, Grant/Award Number: PIEF-GA-2009-236295; Fédération Biodiversité et Santé et Zone Tropicale BIOST (Université de La Réunion)
Abstract
Investigations of the genetic structure of populations over the entire range of a spe-cies yield valuable information about connectivity among populations. Seabirds are an intriguing taxon in this regard because they move extensively when not breeding, facilitating intermixing of populations, but breed consistently on the same isolated islands, restricting gene flow among populations. The degree of genetic structuring of populations varies extensively among seabird species but they have been under-studied in their tropical ranges. Here, we address this across a broad spatial scale by using microsatellite and mitochondrial data to explore the population connectivity of
1 | INTRODUCTION
Widely distributed species consist of distinct populations that are variously connected to each other though current and his-toric overlaps in ranges, resulting in different patterns of ge-netic structuring at global and local scales (Avise & Ball, 1990; Frankham, Ballou, & Briscoe, 2004). In mobile animals, life-his-tory traits such as dispersal and philopatry, as well as geographic isolation, shape population genetic connectivity (Dobzhansky & Dobzhansky, 1970; Greenwood, 1980; Matthiopoulos, Harwood, & Thomas, 2005; Taylor & Friesen, 2012; Wright, 1943). Many species with wide distribution are subdivided into subspecies (Ball & Avise, 1992). The distinction between a subspecies and a spe-cies is at time far from clear but a lineage can be considered as a new species when it acquires sufficiently different properties from others. Such differences can include being phenetically dis-tinguishable, diagnosable, reciprocally monophyletic, reproduc-tively incompatible, and ecologically distinct (de Queiroz, 2007). There is a critical (and ongoing) need for delineation of species and subspecies because it is fundamental in elucidating key processes in ecology (e.g., population connectivity) and conservation biol-ogy (e.g., definition of conservation priority units; Dayrat, 2005; Gutiérrez & Helgen, 2013). Traditional morphology-based taxon-omy defining “morphotypes” (i.e., taxa described solely from mor-phological traits) faces challenges when applied to taxa that are either cryptic (i.e., a group of individuals that is morphologically indistinguishable but incapable of interbreeding) or display consid-erable phenotypic plasticity. Therefore, Zink (2004) and Sackett et al. (2014) argued that only taxa defined by the congruence of multiple morphological or molecular characters should be recog-nized as distinct subspecies.
Investigating genetic population structure over the entire range of a species, with highly variable DNA markers such as microsatel-lites and mitochondrial DNA (mtDNA), provides valuable insights into speciation, population connectivity, biogeography, genetic drift, and within-population genetic diversity (Burg & Croxall, 2001; Godinho, Crespo, & Ferrand, 2008; Thanou et al., 2017). These genetic analy-ses also provide valuable information to identify appropriate conser-vation units allowing implementation of adaptive conserconser-vation plans for threatened species, subspecies, or populations (Dayrat, 2005; Fraser & Bernatchez, 2001; Gutiérrez & Helgen, 2013).
Seabirds are an intriguing taxon when their populations are considered in terms of gene flow and genetic diversity and struc-turing. Despite having wide dispersal potential over entire ocean basins (Booth Jones et al., 2017; Egevang et al., 2010; González-Solís, Croxall, Oro, & Ruiz, 2007), they often show high levels of population isolation and even endemism. This is the so-called “sea-bird paradox” (Friesen, 2015; Lombal, O'dwyer, Friesen, Woehler, & Burridge, 2020; Milot, Weimerskirch, & Bernatchez, 2008; Welch et al., 2012).
Of the three species of tropicbird (Phaethontidae), the white-tailed tropicbird Phaethon lepturus is the most common (Lee & Walsh-McGehee, 1998). This pantropical seabird is widely distrib-uted in the Atlantic, Pacific, and Indian Oceans between 30°N and 30°S (del Hoyo, Elliott, Sargatal, & Christie, 1992). Although its global conservation status is of “Least Concern,” the white-tailed tropicbird is decreasing globally predominantly because of predation by inva-sive species (BirdLife International, 2018). Declining populations are reported in the Atlantic islands where tropicbirds have been dep-redated by introduced brown rats Rattus norvegicus, black rats R. rattus, feral domestic cats Felis sylvestris catus, dogs Canis lupus famil-iaris, American Crows Corvus brachyrhynchos (on Bermuda), and tegu
13 breeding populations representing the six subspecies of the white-tailed tropicbird (Phaethon lepturus) in the Atlantic, Indian, and Pacific Oceans. Our primary aim was to identify appropriate conservation units for this little known species. Three morpho-metric characters were also examined in the subspecies. We found a clear pattern of population structuring with four genetic groups. The most ancient and the most iso-lated group was in the northwestern Atlantic Ocean. The South Atlantic populations and South Mozambique Channel population on Europa were genetically isolated and may have had a common ancestor. Birds from the Indo-Pacific region showed unclear and weak genetic differentiation. This structuring was most well defined from nuclear and mtDNA markers but was less well resolved by morphological data. The validity of classifying white-tailed tropicbirds into six distinct subspecies is discussed in light of our new findings. From a conservation standpoint our results highlight that the three most threatened conservation units for this species are the two subspecies of the tropical North and South Atlantic Oceans and that of Europa Island in the Indian Ocean.
K E Y W O R D S
lizards Salvator merianae (in the Fernando de Noronha archipelago) and where seabirds generally have long endured persecution from humans (Efe, Serafini, & Nunes, 2018; Lee & Walsh-McGehee, 2000; Nunes, Efe, Freitas, & Bugoni, 2017). In Bermuda, one of the main threats was habitat destruction through storm damage; in 2003, a category 3 hurricane damaged 50% of natural nest sites of white-tailed tropicbirds in one of national parks (PT unpublished data). In the Indian Ocean, the breeding tropicbird population of Aride Island, Seychelles, suffered a marked decline of 60% between 1989 and 1998 (Bowler, Betts, Bullock, & Ramos, 2002) which continues to the present day as a 5.4% annual rate of decline (Catry et al., 2009). Threats to tropicbirds on Aride have not been clearly identified to date but 23.2% of recorded adult mortalities are due to entangle-ment in Pisonia sticky seeds with birds losing the ability to fly off. This may be demographically significant (Catry et al., 2009).
Based on morphological differences, six subspecies of P. lep-turus are currently recognized, three occurring in the Indian Ocean, two in the Atlantic Ocean, and one in the Pacific Ocean (del Hoyo et al., 1992; Le Corre & Jouventin, 1999). Three large subspecies breed in the western (P. l. lepturus) and eastern (P. l. fulvus) Indian Ocean and in the northwestern Atlantic Ocean (P. l. catesbyi). The three small subspecies breed in the Pacific (P. l. dorotheae), Indian (South Mozambique Channel; P. l. europae), and south Atlantic Oceans (P. l. ascensionis). The species has golden or apricot plumage morphs in some populations in which birds have white parts of the body plumage that are tinged with these shades. Populations of P. l. fulvus and P. l. europae comprise large fractions of apricot and golden birds, respectively, whereas other subspecies contain mainly white individuals (Le Corre & Jouventin, 1999; see Table 1 and Figure 1).
Such body size and plumage differences among subspecies and locations suggest some level of genetic isolation among populations (Le Corre & Jouventin, 1999). In addition, even neighboring popu-lations could have sharp genetic structuring (Nunes et al., 2017; Wiley et al., 2012). Therefore, the aim of the present study was to explore genetic diversity and population genetic structuring across the entire range of the white-tailed tropicbird and to infer genetic
relationships among populations. Both microsatellite and mtDNA markers were used to investigate genetic structure of 13 breeding populations of the Atlantic, Indian, and Pacific Oceans, including birds from all of the six recognized subspecies. We also performed morphometric analyses to examine patterns of phenotypic differen-tiation among 11 populations of birds for which data were available. Our findings allow us to discuss subspecies validity and appropriate units for effective conservation strategies.
2 | MATERIALS AND METHODS
2.1 | Study sites and sampling
Thirteen populations were sampled between 2008 and 2013 in Atlantic, Indian, and Pacific Oceans (see Table 2 and Figure 1 for fur-ther details). In each population (except that at Réunion Island), all birds were sampled from the same local area and thus can be con-sidered to belong to the same breeding colony. On Réunion Island, we sampled birds from the local Wildlife Rescue Center (SEOR) that originated from various locations across the island. Details of field researchers and local licenses (when required) are provided in sup-porting information (Appendix S1, Table S1). Blood was collected from 382 birds by venepuncture of the brachial or metatarsal veins and samples were stored in 70% ethanol or by sterile syringe and needle and stored dry on filter paper.
2.2 | Biometrics
Morphometric measurements were obtained from breeding adults in 11 populations (Table 2): (a) wing length (i.e., flattened wing from the carpal joint to the tip of the longest primary), (b) tarsus length (i.e., maximum tarsus length), and (c) bill length (i.e., exposed cul-men) following the British Trust for Ornithology's (BTO’s) Ringers’ Manual (Redfern & Clark, 2001). Morphometric measurements of
Subspecies
Distribution
range Breeding locations
Color morph
Body size groupa
catesbyi North Atlantic Ocean
Bermuda, Caraibes White Large
ascensionis South Atlantic
Ocean Ascension, Sao Tomé, Fernando de Noronha White Small
europae South
Mozambique Channel
Single: Europa Island Golden Small
lepturus West Indian
Ocean
Three archipelagos (Seychelles, Comores, Mascarene), Madagascar
White Large
fulvus East Indian
Ocean Single: Christmas Island Apricot Large
dorotheae Pacific Ocean Numerous White Small
aAfter Le Corre and Jouventin (1999).
TA B L E 1 Characteristics of the six
616 individuals of white-tailed tropicbirds are available in support-ing information (Appendix S1, Table S2). Statistical differences in morphometric measurements of these birds between pairs of focal populations were examined using pairwise Wilcoxon rank sum tests corrected after Benjamini and Hochberg (1995), in R 3.4.2 (R Core
Team, 2017). Global patterns in morphometric differences among birds and the populations to which they belong were investigated using a principal components analysis (PCA) performed on a correla-tion matrix of three morphometric measurements from 421 birds of 10 populations individuals for which we had measurements for all
F I G U R E 1 (a) Locations (stars) and associated subspecies of white-tailed tropicbird populations sampled in the Atlantic, Indian and Pacific
Oceans (see Tables 1 and 2 for further details). Range (dotted lines) of each subspecies is indicated (BirdLife International, 2020). Variation in plumage coloration variation among three subspecies of Phaethon lepturus: (b) white morph of P. l. lepturus from Mayotte Island (Photo credit: MLC), (c) yellow morph of P. l. europae from Europa Island (Photo credit: A. Laubin), and (d) apricot morph of P. l. fulvus from Christmas Island (Photo credit: PP)
Fernando de Noronha Ascension Mayotte
Madagascar
Europa
Seychelles (Aride, Bird, Cousin)
Christmas Mauritius Reunion Tahiti P. l. ascensionis P. l. lepturus P. l. europae P. l. fulvus P. l. catesbyi P. l. dorotheae Bermuda (a) (b) (c) (d)
−100
−50
0
50
100
150
–20
−60
−40
−20
02
04
06
08
0
TA B L E 2 Characteristics of the studied populations of Phaethon lepturus
Region Population Code Latitude Longitude Subspecies N Nmsat
Nmt DNA
North Atlantic Bermuda BER 32°18N 64°47W catesbyi 11 21 8
South Atlantic Ascension ASC 7°57S 14°21W ascensionis 13 20 14
Brazil (Fernando de Noronha)
BRA 3°50S 32°24W ascensionis 60 4 4
South Mozambique Channel
Europa EUR 22°21S 40°22E europae 50/140 50 14
West Indian Mayotte MAY 12°49S 45°10E lepturus 40 47 13
Madagascar (Nosy Hara)
MAD 13°19S 48°16E lepturus 8 4 4
Seychelles (Bird) SEB 3°43S 55°12E lepturus 32 34 7
Seychelles (Cousin) SEC 4°20S 55°40E lepturus 144/230 69 12
Seychelles (Aride) SEA 4°13S 55°40E lepturus 0 25 6
Mauritius (Round Island)
MAU 20°20S 57°35E lepturus 23/25 25 8
Reunion RUN 21°7S 55°31E lepturus 41/45 55 13
East Indian Christmas CHR 10°29S 105°38E fulvus 11/12 17 12
Pacific Tahiti TAH 17°39S 149°26W dorotheae 0 11 8
Overall 433/616 382 123
three characters (Appendix S1, Table S2) using the ade4 package in R (Dray & Dufour, 2007). Differences in the synthetic morphology of birds, as characterized from the three morphometric measure-ments, were investigated among the 10 populations of birds using a multivariate analysis of variance (MANOVA). The three principal component scores (i.e., PC1, PC2, and PC3) from the PCA were the variables in the MANOVA from which a Wilk's lambda (Huberty & Olejnik, 2006) was derived following 9,999 permutations. Benjamini and Hochberg (1995) corrected pairwise permutation MANOVAs were performed to compare morphometric measurements among pairwise populations, using the RVAideMemoire package in R (Hervé, 2019).
2.3 | Microsatellite genotyping
Total DNA was extracted from blood or tissue samples using the QIAmp Blood and Tissue kit (Qiagen). Genotyping was con-ducted for 10 polymorphic microsatellite loci (described in Humeau et al., 2011) on DNA extracts from 382 individuals (Table 2). Amplified fragments were resolved by capillary elec-trophoresis on an automated sequencer ABI Prism 3100 Genetic Analyzer (Applied Biosystems). Allele sizes were determined using GeneMapper Software 4 with the LIZ500(-250) standard (Applied Biosystems). Raw microsatellite genotypes of 382 individual white-tailed tropicbirds are available in the supporting informa-tion (Appendix S1, Table S3).
2.4 | Mitochondrial DNA sequencing
Mitochondrial DNA variation was analyzed in a subset of sam-ples used for microsatellite genotyping (n = 123, Table 2) and was assayed following the amplification of part of the cy-tochrome oxidase subunit I (COI) region. Sequences from white-tailed tropicbirds (Kennedy & Spencer, 2004; GenBank ac-cessions AY369055, JN801349) were used to design two primers: CO1Fcons 5′-GACCGAAACCTAAAYACCACA-3′ and CO1Rcons 5′-GGTTCGATTCCYTCCTTTCTT-3′. Each PCR contained 3 µl of DNA solution (60 ng), 0.2 µM of each primer, 7.5 µl of Qiagen PCR MasterMix and was run on GeneAmp PCR System 9700 thermalcy-cler (Applied Biosystems). The PCR consisted of 35 cycles at 94°C for 30 s, 58°C for 90 s, and 72°C for 90 s, preceded by an initial denaturation step of 5 min at 94°C and followed by a 15 min final ex-tension step at 72°C. DNA templates were purified and sequenced in both directions by Genoscreen (Lille, France), obtaining 872 bp se-quences (GenBank accession numbers: KY784127–KY784144, and see Appendix S1, Table S4 for details). In addition to the P. lepturus samples, DNA from six red-tailed tropicbirds of P. rubricauda was also included in the phylogenetic analysis as an outgroup (GenBank accession numbers: MT073267 and MT073268; Appendix S1, Table S4). This species is the phylogenetically closest interspecific relative to P. lepturus (Kennedy & Spencer, 2004).
2.5 | Genetic diversity
Evidence of null alleles, large-allele dropout, and stutter peaks in all microsatellites was examined using MicroChecker 2.2.3 (Van Oosterhout, Hutchinson, Wills, & Shipley, 2004). Each locus-pair combination was tested for linkage disequilibrium with GenePop 4.0.10 (Rousset, 2008). The p-values were corrected using the Benjamini and Yekutieli (2001) method for multiple comparisons (Narum, 2006). The mean observed number of alleles per locus (AL) and the number of private alleles per population (AP) were computed using GenAlEx 6.5 (Peakall & Smouse, 2012). Allelic rich-ness (AR—El Mousadik & Petit, 1996), adjusted for discrepancies in sample size by incorporating a rarefaction method as implemented using FSTAT 2.9.3 (Goudet, 2001), was used to make comparisons of the mean number of alleles among populations (except for the populations from Fernando de Noronha and Madagascar that
con-tained only four individuals each). Observed heterozygosity (HO),
un-biased expected heterozygosity estimated according to Nei (1978)
(HE), and Wright's F-statistics FIS according to the method of Weir
and Cockerham (1984) were calculated for each population using GENETIX 4.05.2 (Belkhir, Borsa, Chikhi, Raufaste, & Bonhomme, 1996–2004). Deviations from Hardy–Weinberg equilibrium (HWE) were tested for each population using GENETIX 4.05.2.
To test whether patterns of genetic variation in the mtDNA sequences deviated from neutral expectation, Ewens–Watterson test (Ewens, 1972; Watterson, 1978) was performed in ARLEQUIN 3.5.1.3 (Excoffier & Lischer, 2010). Haplotypic diversity (h; Nei, 1987) and nucleotide diversity (π; Tajima, 1983) were also calculated to as-sess levels of genetic variation within populations.
2.6 | Population bottlenecks
Genetic evidence for a recent reduction in population size was tested for each population by heterozygosity excess, L-shaped graph, and M-ratio methods (Cornuet & Luikart, 1996; Garza & Williamson, 2001; Luikart, Allendorf, Cornuet, & Sherwin, 1998). Heterozygosity excess tests were performed with the program BOTTLENECK 1.2 (Piry, Luikart, & Cornuet, 1999) by the Infinite Allele Model (IAM) and Two-Phased mutation Model (TPM), incor-porating 78% of single-step mutations and 12% of variance among multiple steps, following the recommendation of Peery et al. (2012). Statistical significance of the number of loci with heterozygosity ex-cess as expected in bottlenecked populations (Luikart et al., 1998)
was evaluated by a one-tailed Wilcoxon signed-rank test from 104
simulation replicates. The L-shaped method illustrates the frequency of rare alleles in the populations; an L-shape graph indicates that the population is in mutation–drift equilibrium (Luikart et al., 1998). The BOTTLENECK software was also used to establish if allele frequency distribution was L-shaped. Finally, test for signatures of a bottleneck by the M-ratio method (Garza & Williamson, 2001) was applied using the StrataG package in R (Archer, Adams, & Schneiders, 2016). The M-ratio statistic indicates the number of unoccupied potential
allelic states and was shown to be small (<0.68 in a dataset with seven loci) when a severe population decline had occurred (Garza & Williamson, 2001).
2.7 | Genetic differentiation and structuring
A hierarchical analysis of molecular variance (AMOVA) was per-formed on microsatellite allele identity and mtDNA to determine how genetic diversity was distributed within and among subspe-cies and populations. Statistical significance was determined in ARLEQUIN 3.5.1.3 (Excoffier & Lischer, 2010) with 1,000 permutations.
Genetic differentiation among all pairs of populations with
sam-ple sizes ≥ 5 was assessed by calculating pairwise FST and ΦST values
for microsatellite and mtDNA data, respectively. FST was computed
between pairs of populations following Weir and Cockerham (1984)
and Whitlock (2011), and statistical significance was tested by 104
permutations of genotypes among populations under Bonferroni's
correction, using GenoDive (Meirmans & Van Tienderen, 2004). ΦST
indices and tests were calculated in ARLEQUIN 3.5.1.3 (Excoffier & Lischer, 2010).
Assignment tests based on multi-locus microsatellite gen-otypes were evaluated using two methods because different clustering approaches may lead to different conclusions (Waples & Gaggiotti, 2006). First, we used a Bayesian genotype clus-tering procedure in STRUCTURE 2.3.3 (Pritchard, Stephens, & Donnelly, 2000). The admixture model was used with and without the LOCPRIOR setting, which considers sample location, and al-lows structure to be detected when genetic structure is weak or when the number of loci is small (<20; Hubisz, Falush, Stephens, & Pritchard, 2009). Correlated allele frequencies were assumed (Pritchard et al., 2000). For each value (1–13) of the number of
independent genetic clusters or K, we ran 106 iterations 20 times
(after a burn-in of 5 × 10⁵ steps). For choosing the optimal number
of clusters, three criteria were used; (1) the log likelihood given K (L(K); Pritchard et al., 2000), (2) the second-order rate of change of mean log likelihood (∆K; Evanno, Regnaut, & Goudet, 2005), and (3) the median value of L(K). The first two were calculated using STRUCTURE HARVESTER online Web server (Earl & VonHoldt, 2012). The third was calculated using CLUMPAK soft-ware (Kopelman, Mayzel, Jakobsson, Rosenberg, & Mayrose, 2015) that was also used to find the optimal individual alignments of rep-licated cluster analyses and to visualize the results.
Population structure was also explored by performing a Discriminant Analysis of Principal Components (DAPC; Jombart, Devillard, & Balloux, 2010) that does not make any assumptions about HWE or linkage disequilibrium. We used K-means clus-tering of principal components for K = 1 to 20 and Bayesian Information Criteria (BICs) to assess the optimal number of ge-netic clusters; the K with the lowest BIC value is the optimum (after Carlen & Munshi-South, 2020). However, BIC values may continue to decrease below the optimum in case of genetic clines
and hierarchical structure (Jombart et al., 2010). Therefore, the rate of decrease in BIC values was visually examined to identify values of K, after which BIC values decreased only subtly (Jombart et al., 2010). DAPC was applied using the Adegenet package 2.1.1 in R (Jombart, 2008).
A hierarchical analysis of the genetic structuring using Bayesian and DAPC procedures was performed at different spatial scales to detect a possible pattern among the less isolated populations. This was performed: (a) in all populations, (b) after removing the much-dif-ferentiated Bermuda population, and (c) after removing the three differentiated genetic groups on Bermuda, Ascension/Fernando de Noronha and Europa.
2.8 | Network and phylogenetic analysis
A statistical parsimony haplotype network was obtained from mtDNA sequences (123 individuals sampled in 13 populations) using the pegas package 0.11 in R (Paradis, 2010). The haplotype network was built using an infinite site model (Hamming distance) (Templeton, Crandall, & Sing, 1992) to display the maternal connections among populations and subspecies of P. lepturus.
We used Mega 7.0.26 (Kumar, Stecher, & Tamura, 2016) to align the sequences of 123 P. lepturus and six P. rubricauda. The model of DNA substitution was determined using jModelTest 2 (Darriba, Tab oada, Doallo, & Posada, 2012). The Tamura and Nei (1993) model (TN93) with invariant sites (I) and discrete Gamma distribution (G) was selected as the best-fit model of nucleotide substitution. Maximum likelihood (ML) phylogenetic trees were constructed in Mega 7.0.26 (Kumar et al., 2016) using TN93+I+G model and 1,000 bootstrap replicates. Bayesian phylogenetic (BI) trees were reconstructed from the datasets with the BEAST program 1.10.4 (Drummond, Suchard, Xie, & Rambaut, 2012). The Bayesian analyses were performed using a TN93+I+G model, a constant size coalescent tree prior, and a strict clock model of rate as the tree priors, as well as other default pa-rameters. We estimated the time of the most recent common ances-tor (MRCA) for nodes of interest observed in the mtDNA tree also with the BEAST program. To calibrate the molecular clock, we used the estimated divergence time between P. lepturus and P. rubricauda following Kennedy and Spencer (2004). Accordingly, we calibrated the divergence between the two species with a normally distributed prior with a mean of 4 MYr and a standard deviation of 1 MYr.
Three independent Markov Chain Monte Carlo (MCMC) runs of
5 × 10⁶ generations, with a 10% burn-in were performed. Posterior
distributions for parameter estimates and likelihood scores to ap-proximate convergence were visualized and checked with the ef-fective sample sizes (ESS > 200) using the Tracer program 1.7.1 (Rambaut, Drummond, Xie, Baele, & Suchard, 2018). A maximum clade credibility (MCC) tree was estimated by TreeAnnotator 1.10.4 (Drummond et al., 2012) from the combined output of the three MCMC runs using the LogCombiner program after the removal of the initial trees (10%) as burn-in. The MCC tree was visualized with the program FigTree 1.4.4 (Rambaut, 2012).
2.9 | Correlations among genetic,
morphometric, and geographic distances
Isolation by distance was tested though the correlations among nu-clear and mtDNA genetic distances, morphometric distances, and geographic distances using a Multiple Regression of dissimilarity Matrices (MRM; Goslee, 2010). Since the three morphometric meas-urements were available for only 10 populations (all except Tahiti, Christmas, and Bird islands), genetic and geographic distance ma-trices were only calculated for these 10 populations. We used the
previously estimated FST matrix of genetic distances to calculate a
new matrix based on Slatkin (1993) genetic distances FST/(1−FST).
Differentiation in morphometric measurements among 10
popula-tions was estimated using pairwise Mahalanobis D2, calculated with
the HDMD package in R (McFerrin, 2013). The Great Circle Distance (WGS84 ellipsoid) method was used to calculate geographic distance between each pair of populations using sp package in R (Pebesma & Bivand, 2005). Multiple regression on scaled distance matrices were
performed using the ecodist package (Lichstein, 2007) with 104
permutations.
3 | RESULTS
3.1 | Phenotypic variation
Based on three morphometric measurements, birds of the subspe-cies P. l. catesbyi (i.e., in the Bermuda population) had significantly longer tarsi than birds in the other populations (Table 3). Birds of the subspecies P. l. europae (i.e., in the Europa population) were consist-ently smaller for all three measured traits compared with the remain-der (differences of 25, 6, and 6 mm between Bermuda and Europa
populations for wing (all Ps ≤ .006), tarsus (all Ps ≤ 4 × 10⁻⁶), and
bill (all Ps ≤ 9 × 10⁻⁶) lengths, respectively; Table 3). No birds in the
other subspecies differed significantly in size in pairwise compari-sons (Table 3). The PCA revealed the separation of individuals along the PC1 axis (explaining 59% of the total variance) into three main clusters corresponding to subspecies P. l. catesbyi, P. l. europae, and the others (P. l. ascensionis, P. l. lepturus and P. l. fulvus; Figure 2). The populations were significantly different in morphology when tested
by parametric MANOVA (Wilk's lambda = 0.33, df = 9, p < 2.2 × 10–
16). Pairwise permutation MANOVAs showed that P. l. catesbyi and
P. l. europae were significantly bigger and smaller, respectively, com-pared to all other populations (all Ps < 0.05).
3.2 | Genetic diversity and test of bottleneck
No null alleles, large-allele dropout nor stutter peaks were detected for the 10 microsatellite loci. The percentage of missing data was 0.81%. Linkage disequilibrium among loci was detected for three of the 45 loci pairs (p < .05) but no significant linkage
disequilib-rium was observed among any of the loci after the Benjamini and TA
B LE 3 M ea n m or ph om et ric m ea su re m en ts ( ± 1 SD ) o f f iv e s ub sp ec ie s o f P hae th on le pt ur us in 1 1 p op ul at io ns ( se e T ab le 1 f or f ur th er d et ai ls ) Po pu la tio n Su bspec ies M or pho me tri c me as ur eme nt s W in g len gth (mm ) Ta rsu s len gth (mm ) B ill len gth (mm ) N Mea n ± 1 SD Pair wis e N Mea n ± 1 SD Pair wis e N Mea n ± 1 SD Pair wis e B er mu da ca te sb yi 11 28 5. 55 ± 5 .5 4 a 11 26 .9 5 ± 1 .55 a 11 50 .3 7 ± 2 .24 a A sc ens io n as ce ns io ni s 13 27 0. 46 ± 7. 78 b 13 23 .62 ± 0 .87 cd 13 48 .4 5 ± 1 .75 ab c B ra zi l ( Fe rn an do d e N or on ha ) as ce ns io ni s 60 27 3. 25 ± 6 .83 bc 60 23 .2 1 ± 1 .53 bc d 60 47 .78 ± 2 .6 3 b Eu ro pa eu ro pa e 14 0 261 .4 3 ± 6 .3 9 f 50 21 .3 3 ± 1 .01 e 14 0 44 .51 ± 1. 86 d M ay ot te le pt ur us 40 276 .8 3 ± 5 .2 8 e 40 22 .87 ± 0 .71 b 40 49 .8 4 ± 1 .7 0 a Ma da ga sc ar le pt ur us 8 27 9. 38 ± 3 .29 ade 8 23 .0 0 ± 1. 00 bc d 8 49 .0 6 ± 1 .9 2 ab c Se yc he lle s ( B ird ) le pt ur us 32 276 .7 5 ± 9 .8 3 bc de 32 23 .5 0 ± 1 .31 c 32 49 .2 3 ± 2 .71 ac Se ych el le s (C ous in ) le pt ur us 23 0 27 9. 89 ± 7. 05 ad 14 4 23 .0 3 ± 1 .07 bd 23 0 49 .2 7 ± 1 .9 7 a Maur iti us le pt ur us 25 28 0. 60 ± 5 .8 4 ad 23 23 .07 ± 0 .87 bc d 24 49 .0 9 ± 1. 86 ab c Reu ni on le pt ur us 45 276 .2 4 ± 8 .3 0 ce 41 23 .3 5 ± 1 .14 bc d 45 47. 96 ± 2 .07 bc C hr is tm as fu lv us 12 28 0. 25 ± 4 .3 7 ade 0 NA – 11 49 .6 6 ± 2 .1 3 ab c N ote : S ig ni fic an t d iff er en ce s a m on g p op ul at io ns a s d et ec te d b y W ilc ox on 's s ig ne d-ra nk t es ts a re s ig ni fie d b y d iff er en t l ow er ca se l et te rs f ol lo w in g t he B en ja m in i a nd H oc hb er g ( 19 95 ) c or re ct io n f or m ul tip le p ai rw is e c om pa ris on s a nd u si ng a n a lp ha t hr es ho ld o f 0 .0 5.
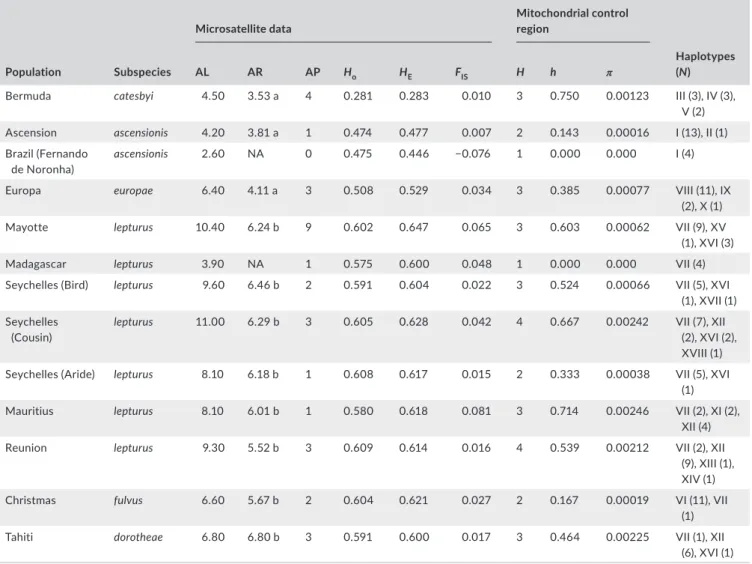
Yekutieli (2001) correction for multiple tests (adjusted α = 0.011), suggesting that all loci were independent. The mean allelic richness, based on minimum sample size of 11 individuals, ranged from 3.5 to 6.8 alleles per locus and was relatively similar among popula-tions, except for the less variable Atlantic Ocean and Mozambique Channel populations (Table 4). All studied populations contained one (Ascension, Seychelles [Aride], Mauritius) to nine (Mayotte) private alleles (Table 4). Observed heterozygosity and unbiased expected heterozygosity ranged from 0.28 to 0.61 and from 0.28 to 0.63, re-spectively (Table 4). Deviations from HWE were not significant for all populations (all Ps > 0.05).
Eighteen different mtDNA COI haplotypes were obtained from 872 bp COI sequences of 123 individuals sampled across 13 pop-ulations (Table 4). Haplotypes were defined by 32 polymorphic sites (3.7%), all of which were substitutions, including 31 transi-tions and one transversion. Populatransi-tions of the North (Bermuda) and South Atlantic (Ascension/Fernando de Noronha), and of the Mozambique Channel (Europa) presented three, two and three pri-vate haplotypes, respectively (Table 4, Figure 3). One haplotype (VII, 36 individuals) was found in high frequency in all populations of the Indian (except Europa) and Pacific Oceans, but it was rep-resented by a single individual in the Christmas Island population (Table 4). All other individuals from Christmas Island shared a pri-vate haplotype (VI). Nucleotide diversity and haplotype diversity were lower in Ascension, Europa, Aride and Christmas populations compared with the other populations (Table 4). Ewens–Watterson (all Ps > 0.09) and Tajima's D (all Ps > 0.13) tests within all popu-lations were not significant, providing no evidence of deviations from selective neutrality.
The L-shaped allele frequency distribution graphs and M-ratio statistics were not consistent with recent bottleneck events in any population. All populations had normal L-shaped distributions and
M-ratio statistics well above 0.68. However, heterozygosity excess was detected in Ascension, Europa, Reunion and Mauritius colonies (Ps < 0.05; Appendix S1, Table S5), suggesting that these populations were not in mutation–drift equilibrium.
3.3 | Genetic differentiation and
population structure
The AMOVA using microsatellite allele identity indicated that 65% of microsatellite variation was attributed to differences among the delineated subspecies, 10% among the populations and 25% among individuals (all Ps < 0.001). With mtDNA, 73% of the variance was attributed to differences among subspecies, 13% to among popula-tions and 14% to among individuals (all Ps < 0.001).
3.3.1 | Microsatellite differentiation and clustering
Pairwise FST values ranged between 0.003 and 0.485 with a global
FST of 0.102 (p < .001). Based on FST values, three populations were
clearly distinguishable: (1) Bermuda, (2) Ascension, and (3) Europa, suggesting a strong isolation of these three populations (Appendix
S1, Table S6). For the Indo-Pacific populations, FST values indicated
weak (maximum value: 0.056), although statistically significant ge-netic structuring for two-thirds of the pairwise comparisons and sug-gested isolation of the Reunion population (all Ps < 0.05; Appendix S1, Table S6).
Clustering of microsatellite genotypes using STRUCTURE analysis showed that the best-supported model contained three to eight genetic clusters, depending on the optimal K method used (Figure 4a) and suggested a hierarchical structure. Without
F I G U R E 2 Scatterplot from a
principal component analysis (PCA) of morphological variation based on three morphometric measurements [wing length (WL), tarsus length (TL) and bill length (BL)] taken from 421 Phaethon lepturus from 10 localities. The total variance explained by PC1 and PC2 was 59% and 25%, respectively. Colors correspond to populations with population codes detailed in Table 2 TL BL WL ASC (P. l. ascensionis) BER (P. l. catesbyi) BRA (P. l. ascensionis) EUR (P. l. europae) MAY (P. l. lepturus) MAD (P. l. lepturus) SEB (P. l. lepturus) SEC (P. l. lepturus) MAU (P. l. lepturus) RUN (P. l. lepturus) Eigenvalues PC1 PC2
geographic information, the best-supported model contained five or eight genetic clusters (break in the slope of Evanno's likelihood val-ues at K = 8, maximum L(K) at K = 5 and optimal K using median value of L(K) at K = 5; Figure 4a). Clustering analysis using the geographic information model showed that the optimal K varied from three (Evanno's procedure) to eight clusters (mean and median L(K) values; Figure 4a). Regardless of the model and optimal value of K, analy-ses clearly distinguished three clusters corresponding to North and South Atlantic regions (the Bermuda population forming one and the Ascension and Fernando de Noronha populations the second) and the Europa population in the Mozambique Channel (Figure 4a). All the other populations were not clearly isolated. Similar clustering analy-sis performed after removing (a) the Bermuda population and (b) the Bermuda and Ascension/Fernando de Noronha populations showed the same patterns; distinct clusters in the South Atlantic Ocean and in the Mozambique Channel (data not shown). At the Indo-Pacific Ocean scale, the optimal number of clusters varied from two to four,
depending of the method (Figure 4b). Without geographic informa-tion, no clear structure was revealed with all populations appearing admixed. Using geographic information, three pure and genetically distinct clusters (Reunion, Mayotte/Christmas and Seychelles pop-ulations) and two admixed populations (Mauritius, Tahiti) could be distinguished. Based on these results, the subspecies P. l. catesbyi, P. l. ascensionis, and P. l. europae seemed to be clearly isolated while the others (P. l. lepturus, P. l. fulvus, and P. l. dorotheae) were admixed.
The DAPC clustering produced similar estimates of optimal num-ber of clusters as the previous method. The initial sharp decline in BIC values continued up to K = 5–8 for all populations, K = 4–6 for all populations except Bermuda, and K = 2–5 at the Indo-Pacific Ocean scale except Europa (Figure 5). The first axis of the DAPC reduced space plot clearly distinguished between the Bermuda pop-ulation and the others (100% assignment-success rate, Figure 5a). Removing the Bermuda population, the South Atlantic populations (100% assignment-success rate) and the Europa population (98%
TA B L E 4 Estimates of genetic diversity at 10 microsatellite loci and an 872-bp fragment of the mtDNA COI in 13 populations of Phaethon
lepturus Population Subspecies Microsatellite data Mitochondrial control region AL AR AP Ho HE FIS H h π Haplotypes (N)
Bermuda catesbyi 4.50 3.53 a 4 0.281 0.283 0.010 3 0.750 0.00123 III (3), IV (3),
V (2)
Ascension ascensionis 4.20 3.81 a 1 0.474 0.477 0.007 2 0.143 0.00016 I (13), II (1)
Brazil (Fernando
de Noronha) ascensionis 2.60 NA 0 0.475 0.446 −0.076 1 0.000 0.000 I (4)
Europa europae 6.40 4.11 a 3 0.508 0.529 0.034 3 0.385 0.00077 VIII (11), IX
(2), X (1)
Mayotte lepturus 10.40 6.24 b 9 0.602 0.647 0.065 3 0.603 0.00062 VII (9), XV
(1), XVI (3)
Madagascar lepturus 3.90 NA 1 0.575 0.600 0.048 1 0.000 0.000 VII (4)
Seychelles (Bird) lepturus 9.60 6.46 b 2 0.591 0.604 0.022 3 0.524 0.00066 VII (5), XVI
(1), XVII (1) Seychelles
(Cousin)
lepturus 11.00 6.29 b 3 0.605 0.628 0.042 4 0.667 0.00242 VII (7), XII
(2), XVI (2), XVIII (1)
Seychelles (Aride) lepturus 8.10 6.18 b 1 0.608 0.617 0.015 2 0.333 0.00038 VII (5), XVI
(1)
Mauritius lepturus 8.10 6.01 b 1 0.580 0.618 0.081 3 0.714 0.00246 VII (2), XI (2),
XII (4)
Reunion lepturus 9.30 5.52 b 3 0.609 0.614 0.016 4 0.539 0.00212 VII (2), XII
(9), XIII (1), XIV (1)
Christmas fulvus 6.60 5.67 b 2 0.604 0.621 0.027 2 0.167 0.00019 VI (11), VII
(1)
Tahiti dorotheae 6.80 6.80 b 3 0.591 0.600 0.017 3 0.464 0.00225 VII (1), XII
(6), XVI (1)
Note: AL, mean number of alleles per locus; AR, mean allelic richness per locus based on minimum sample size of 11 diploid individuals [means
followed by the same lower case letter are not significantly different (i.e., p > .05) according to the pairwise Wilcoxon's signed-rank tests with
Bonferroni correction]; AP, private allelic richness; HO, observed heterozygosity over all loci; HE, unbiased expected heterozygosity; FIS, fixation index
assignment-success rate) were isolated from the others (Figure 5b). All the populations of the Indo-Pacific Ocean except Europa were admixed, with a maximum of 71% assignment-success rate between two clusters (Figure 5c).
3.3.2 | mtDNA network and phylogeny
The haplotype network based on mtDNA sequences showed the same pattern of genetic structuring as shown by the microsatel-lite analyses (Figure 3). The Bermuda population (P. l. catesbyi) was the most isolated with 13 nucleotide changes distinguishing it from the Ascension population and three private haplotypes. The Europa population was related only to the Ascension/Fernando de Noronha populations (four substitutions between them) and the Ascension/Fernando de Noronha populations were sepa-rated from the Indo-Pacific populations by four substitutions. The Europa and Ascension-Fernando de Noronha populations had
pri-vate haplotypes (three and two, respectively). Pairwise ΦST values
among populations confirmed these findings with all comparisons
among these three populations and the remainder yielding ΦST
values > 0.81 which were significantly different from 0 (Appendix S1, Table S6). All other individuals located in Indian and Pacific Oceans exhibited extensive shared haplotypes among populations (Figure 3). The most frequent haplotype (VII) was present in all
sampled population of the Indo-Pacific region except Europa. The population of Christmas Island (i.e., P. l. fulvus) contained 92% of individuals with a private haplotype (VI). All comparisons among
populations in the Indo-Pacific region except Europa yielded ΦST
values < 0.77 (and <0.66 if the Christmas Island population was excluded); half of them were not significantly different from 0 (Appendix S1, Table S6).
Phylogenetic analysis confirmed the same relationships as in the haplotype network (Figure 6). Both phylogenetic analyses grouped populations of P. lepturus in three well-supported and dis-tinct phylogroups: (1) The first clustered the Bermuda population (P. l. catesbyi), (2) the second was divided into two well-supported phylogroups consisting of the Ascension/Fernando de Noronha (P. l. ascensionis) populations and the Europa population (P. l. euro-pae), and (3) the third included all of the remaining individuals of Indio-Pacific Oceans (Figure 6). Each of the phylogroups was fur-ther subdivided. Three of them showed strong tree node support. The P. l. catesbyi, P. l. ascensionis, P. l. europae phylogroups were each clustered in two subgroups, with strong to medium tree node support (Figure 6). The other three subspecies were not clearly clustered in distinct clades, except individuals from Christmas Island but showed moderate tree node support and were grouped with three individuals from Reunion, Mayotte, and Seychelles populations.
Divergence time between P. lepturus and P. rubricauda was es-timated by BEAST at 3.70 Mya [CIs: 1.63, 5.76 Mya]. According to our molecular dating, the most recent common ancestor of all white-tailed tropicbirds lived up to about 700 kya (Figure 6). The P. l. cates-byi phylogroup was then isolated from its sister clade from which South Atlantic Ocean, Mozambique Channel and Indian-Pacific Ocean populations originated. The latter further split approxi-mately 290 kya, separating the phylogroup of South Atlantic Ocean/ Mozambique Channel populations, and the phylogroup of the Indo-Pacific populations. The more recent split separating P. l. ascensionis and P. l. europae phylogroups was dated at approximately 160 kya (Figure 6).
3.4 | Correlations among genetic,
morphometric, and geographic distances
Genetic distances based on nuclear microsatellites and mtDNA se-quences estimated for 10 populations showed significant relation-ships with geographic distances (MRM tests, r = .48, p = .001, and r = .20, p = .012, respectively). Morphometric distances estimated for the same 10 populations were weakly correlated with nuclear
F I G U R E 3 Haplotype network of COI mtDNA sequences
(872 bp) from 123 Phaethon lepturus sampled in 13 populations. Pie charts and filled circles correspond to haplotypes. Open circles represent mutational steps. Colors correspond to populations with population codes and associated subspecies detailed in Table 2
2
2
2
2
2
2
II
III
IV
V
VI
VIII
IX
X
XI
XIII
XIV
XV
XVI
XVII
XVIII
ASCBER BRA EUR MAY MAD SEB SEC SEA MAU RUN CHR TAH 30 20 10 1
I
VII
XII
catesbyi ascensionis lepturus europae fulvus dorotheaeF I G U R E 4 Genetic structure based on 10 microsatellite loci using STRUCTURE with and without geographic information models. Left:
Detection of the number of genetic clusters K using the log likelihood mean values L(K) (black circles), median values of L(K) (red stars) and ΔK statistic (after Evanno et al., 2005; black triangles) as derived from STRUCTURE with K ranging from 2 to 13 with each value obtained by averaging the posterior probabilities over 20 independent runs. Right: Proportional membership probability of an individual to a given cluster. (a) Analysis of 382 Phaethon lepturus from 13 localities and K varied from 5 to 8, and (b) analysis of 287 individuals from nine localities in Indo-Pacific Oceans (except Europa) and K varied from 2 to 4. Colors correspond to genetic clusters. Population codes and associated subspecies are detailed in Table 2
(a)
All populations
(b)
Without Atlantic and Europa populations
P. l. catesbyi P. l. europae P. l. lepturu s P. l. fulvus P. l. dorotheae MA Y EUR BR A ASC MA U SEA SEC SEB MA D TA H CHR RUN BER K = 5 K = 6 K = 7 K = 8 K = 5 K = 6 K = 7 K = 8 P. l. ascencionis
Without geographical information With geographical information Without geographical information
1 2 3 4 5 6 7 8 9 10 11 12 13 4 3 2 1 0 -10000 -10800 -11600 -12400 -13200 -14000
∆K
Number of clusters (K)
L(K)
' 1 2 3 4 5 6 7 8 9 10 11 12 13 12 10 8 6 4 2 0 -11000 -11400 -11800 -12200 -12600 -13000Number of clusters (K)
∆K
L(K) ' 1 2 3 4 5 6 7 8 9 -9000 -9600 -10200 -10800 -11400 -12000 0 0.5 1 1.5 2 2.5∆K
L(K)
' 1 2 3 4 5 6 7 8 9 18 15 12 9 6 3 0 -9000 -9200 -9400 -9600 -9800 -10000 Number of clusters (K)With geographical information
∆K
L(K) 5 6 7 8 9 10 11 12 13 5 6 7 8 9 10 11 12 13 K = 2 K = 3 K = 4 5 6 7 8 9 10 11 12 13 5 6 7 8 9 10 11 12 13 MA Y MA U SEA SEC SEB MA D TA H CH R RUN K = 2 K = 3 K = 4 K = 5 K = 5 Number of clusters (K)F I G U R E 5 Discriminant analysis of principal components (DAPC) of genetic variation based on 10 microsatellite loci of Phaethon lepturus.
Individual birds (dots) and populations (ellipses) are discriminated using the first two component axes. Left: Bayesian Information Criterion (BIC) for each K from Adegenet function in R (after Jombart et al., 2010). Right: Scatterplots from DAPC 1st-2nd axes and 1st-3rd axes. Percentage of cumulated variance (Cum. Var.) and DA Eigenvalues (DA Eigen.) are plotted. (a) Analysis based on 382 birds from 13 localities. (b) Analysis excluding Bermuda population and based on 361 birds. (c) Analysis at the Indo-Pacific Ocean scale (except Europa) based on 287 birds. Colors correspond to populations whose codes are detailed in Table 2
440 460 480 Number of clusters BIC 2 4 6 8 10 340 34 53 50 2 4 6 8 10 12 14 420 440 460
(a)
all populations
(c)
Indian-Pacific Ocean
Number of clusters Number of clusters BIC BIC 5 10 15 20 ASC BER BRA EUR MAY MAD SEB SEC SEA MAU RUN CHR TAH DA eigen. 0 20 40 60 80 100 04 08 0 Cum. Va r. MAY MAD SEB SEC SEA MAU RUN CHR TAH 0 20 40 60 80 100 0 40 80 0 20 40 60 80 100(b)
all populations except Bermuda
PCA axis DA eigen. Cum. Va r. Cum. Va r. DA eigen. DA eigen. DA eigen. DA eigen. 04 08 0 PCA axis ASC BRA EUR MAY MAD SEB SEC SEA MAU RUN CHR TAH
genetic distances (MRM test, r = .16, p = .03) but not with mtDNA genetic distances (MRM test, r = .15, p = .06).
4 | DISCUSSION
The present study has provided data on genetic and morphologi-cal differences among putative white-tailed tropicbird subspe-cies. Patterns of variation in white-tailed tropicbirds revealed significant differences at different geographic scales and sug-gested disparities in connectivity among populations. This struc-turing was broadly in agreement in morphological, nuclear, and mtDNA marker analyses. Our results showed clear morphologi-cal and genetic differentiation in some subspecies such as P. l. catesbyi, represented by the Bermuda population, in which birds are larger and display a genetic clade potentially isolated from the Middle Pleistocene. Birds of Europa (P. l. europae) were the smallest and constituted a highly differentiated genetic cluster. The subspecies P. l. ascensionis from the South Atlantic popula-tions is morphologically similar to the Indo-Pacific populapopula-tions but genetically isolated. Birds from the remaining populations of the Indo-Pacific region were morphologically similar and showed weak genetic differentiation. These results are discussed below in terms of subspecies validity and appropriate units for conserva-tion strategies.
4.1 | Morphological variation among subspecies
Morphometric measurements of birds showed clear differentiation among the larger subspecies P. l. catesbyi, the smaller subspecies P. l. europae and the other subspecies that were intermediate in size (Table 3 and Figure 2). Our results were not entirely consistent with those of Le Corre and Jouventin (1999) who distinguished between large subspecies (i.e., P. l. catesbyi, P. l. lepturus, and P. l. fulvus) and small subspecies (i.e., P. l. ascensionis, P. l. europae, and P. l. dorotheae). This difference in findings of these two studies may be partly ex-plained by Le Corre and Jouventin (1999) sampling birds of the sub-species ascencionis from the São Tomé population as opposed to the present study that included birds from the Ascension and Fernando de Noronha populations. There are slight morphological differences between birds from the western and eastern South Atlantic, with birds from Ascension/Fernando de Noronha populations slightly bigger than birds from the São Tomé population (see table 2 in Le Corre and Jouventin (1999) and Table 3 in the present study).As previously reported by Le Corre and Jouventin (1999), body size appeared to decrease from the highest (Bermuda, 32°N) to the lowest (Europa, 22°S) latitudes but variation was only subtle with none of the correlations of any morphological traits with latitude or longitude being statistically significant (data not shown). Body size variation of P. lepturus could be explained, in part, by Bergmann's Rule, applied at an intraspecific level, as suggested by Le Corre and
F I G U R E 6 Phylogenetic relationships
and estimated divergence times based on COI mtDNA sequences (872 bp) from 123 Phaethon lepturus from 13 populations. Statistical support is given above branches; number shown in order for the respective analysis (Beast posterior probabilities/Maximum Likelihood bootstrap values) only if p > .50 and bootstrap values >50. Numbers on the x-axis refer to millions of years (MYr) since the present; mean estimated times in MYr and the 95% intervals are indicated for each major node corresponding to the four phylogroups. Colors correspond to populations whose codes and associated subspecies names are detailed in Table 2
1.0 0.5 TAH12 RUN2 E107 RUN11 SEA17 BRA2 RUN56 E11-5 CHR14 SEC40 RUN3 CHR11 TAH11 E11-4 ASC16 RUN18 RUN12 BER2 E11-7 CHR15 MAY20 MAY22 ASC5 ASC9 MAY13-12 MAY24 SEA12 MAU20 BER16 BER11 SEC16 ASC20 BER12 E100 CHR5 CHR9 MAY11 SEA6 MAY14 ASC15 MAU1 BER14 MAU3 BER21 SEC45 MAD4 BRA1 TAH7 SEB-BI26 TAH9 ASC7 E13-15 CHR16 RUN49 MAY13-6 RUN15 E13-3 CHR12 RUN24 CHR1 E13-12 MAY13-14 SEA22 BRA3 SEBS1 MAD2 RUN47 SEA5 SEC43 CHR2 TAH3 MAU6 BER9 E102 SEC14-2 ASC1 E104 CHR3 SEB-S2 ASC8 SEA18 SEB-BI29 MAY1 SEC-S14 SEC14 MAY3 TAH1 CHR10 SEB-BI22 SEC17 ASC2 BER17 BRA4 ASC4 RUN1 MAU5 E11-6 SEC8 MAY13-20 MAD1 MAU23 SEC-S6 ASC11 MAY13 SEB-BI21 MAY16 RUN0 E13-30 E101 ASC3 TAH2 ASC13 ASC6 MAD3 MAU25 RUN22 E13-6 SEB-S3 CHR17 TAH10 SEC-S5 SEC20 0.70 [0.22,1.33] [0,09,0.57]0.29 [0,04,0.35]0.16 1/95 0.99/92 0.61/- 0.84/81 0.99/97 0.99/82 0.93/65 0.71/- 0.70/-0.96/66 0.88/-0.0 MYr 0.88/87 -/63 P. l. catesbyi P. l. lepturus P. l. fulvus P. l. dorotheae P. l. europae P. l. ascensionis
Jouventin (1999). Phenotypic structuring results from the selection of multiple pressures to which an organism is exposed (Mayr, 1956), such as differences in local oceanographic characteristics around distinct seabird populations (Friesen, 2015). Environmental char-acteristics (e.g., sea surface temperature, primary productivity) and characteristics relating to foraging behaviour seem to be correlated with the distribution of phenotypes in the marine realm, as has been suggested for seabirds (Weimerskirch, Zimmermann, & Prince, 2001; Yamamoto et al., 2016).
4.2 | Genetic structuring among subspecies
Microsatellites and mtDNA analyses suggested complex structur-ing among white-tailed tropicbirds subspecies. Phaethon l. catesbyi represented by the Bermuda population was the most ancient and the most isolated group, estimated to have been potentially isolated since the Middle Pleistocene. The subspecies P. l. ascensionis (South Atlantic populations) and P. l. europae (South Mozambique Channel) were each isolated and may have a common ancestor. Birds from the remaining subspecies (P. l. lepturus, P. l. fulvus, and P. l. dorotheae rep-resented by only one population) of the Indo-Pacific region showed no clear and weak genetic differentiation but sample sizes were gen-erally low.
Birds from Bermuda are the most divergent and isolated genetic group, as suggested by microsatellite clustering (Figure 4), DAPC (Figure 5), the mtDNA network (Figure 3), and phylogeny (Figure 6). This subspecies could have diverged from others approximately 700 kya (Figure 6). Several factors could explain this strong isolation. Mejías, Wiersma, Wingate, and Madeiros (2017) showed that the postbreeding dispersion of the Bermudian white-tailed tropicbirds extended as far west as North Carolina and as far east as the Mid-Atlantic Ridge. None of the tracked birds crossed the equator and reached the southern Atlantic Ocean. Campos, Andrade, Bertrand, and Efe (2018) and Santos, Campos, and Efe (2019) tracked the move-ment of white-tailed tropicbirds (P. l. ascensionis) during chick-rearing from Fernando de Noronha archipelago and showed that long forag-ing trips reached an average distance from the breedforag-ing colony of 105 ± 48 km. This reinforces the hypothesis of a lack of connectivity between northern and southern populations of the Atlantic Ocean. Indeed, birds from Bermuda are genetically and morphologically dis-tinct from birds of Ascension and Fernando de Noronha, suggesting that gene flow does not occur between the southernmost and north-ernmost populations of the Atlantic Ocean. Bermuda and Ascension Islands are separated by 39° of latitude (or 7,800 km), and so it is likely that latitudinal distance plays a major role in their genetic isola-tion. There is a pressing need to investigate the genetic structure of birds along the southeast–northwest gradient of the tropical Atlantic (including Great and Lesser Antilles), to identify the spatial limits of northern and southern genetic clusters.
The phylogroup of P. l. ascensionis and P. l. europae could have a common ancestor that probably diverged from the ancestor of the Indo-Pacific region about 290 kya (Figure 6). All nuclear
microsatellite analysis showed a strong isolation for each of these two populations. The geographic localization of the ancestor could not be determined and would not have been reliable with only one sequence of <1,000 bps carried a tiny amount of phylogenetic sig-nal. Nevertheless, sporadic gene flow could be possible between Atlantic and Indian Oceans. Some birds of the tropical Atlantic (i.e., from Ascension and Fernando de Noronha, but also from São Tomé and Príncipe in the Gulf of Guinea—not included in our study) may have migrated to the Indian Ocean, probably through the southern tip of Africa. Similar gene flow between Atlantic and Indian Oceans was proposed for petrels (Pterodroma spp.; Booth Jones et al., 2017; Brown et al., 2010) and between Atlantic and Pacific Oceans for magnificent frigatebirds Fregata magnificens (Hailer et al., 2010).
Birds of Europa Island were genetically isolated from all other populations of the western Indian Ocean, indicating very limited gene flow between Europa and the other populations of the re-gion. Ecological barriers to gene flow are unlikely because there is no marked marine ecological gradient between the northern and southern Mozambique Channel nor between the west and east of Madagascar. Movements of white-tailed tropicbirds from Europa have not been studied to date but we have no indirect evidence of any regional dispersal with no ringing recoveries outside of Europa. However, the nonbreeding distribution of several seabird species breeding in the Mozambique Channel has been studied and all of them are capable of crossing the Mozambique Channel or of flying south of Madagascar to reach the Mascarene archipelago (Le Corre et al., 2012; Weimerskirch et al., 2006). The isolation of Europa Island tropicbirds also manifests itself in at least two other marine verte-brates for which a role for ecological isolation is suspected. Marine conditions in the southern and central Mozambique Channel are thought to drive genetic isolation of local populations of the green tur-tles Chelonia mydas (Bourjea et al., 2007). The red-footed booby Sula sula is a polymorphic pantropical seabird and most populations in the Indian Ocean predominantly consist of the white-tailed white morph except at Europa Island where >95% are of the white-tailed brown morph, suggesting strong isolation (Le Corre & Jouventin, 1999) as confirmed by a recent genetic study (Danckwerts, 2018). We sug-gest that the strong genetic isolation of P. l. europae on Europa Island may be due to several factors such as natal philopatry and breeding fidelity, breeding phenology, ecological specialization, and sexual se-lection (Friesen, Burg, & McCoy, 2007; Lombal et al., 2020; Sexton, Hangartner, & Hoffmann, 2014; Uy, Irwin, & Webster, 2018).
Surprisingly, the only population of the Pacific Ocean that we included in our study (Tahiti, French Polynesia) was genetically in-distinguishable from populations of the Indian Ocean (except birds in the Europa population). The lack of nuclear and mtDNA genetic differentiation between Indo-Pacific subspecies (i.e., P. l. lepturus and P. l. dorotheae, represented by one breeding population in Tahiti) demonstrates that the Indonesian archipelago is not a physical bar-rier to seabird dispersion, suggesting that gene flow occurs among populations in the two ocean systems. An alternative scenario that would explain this result would be from only recent isolation of a