HAL Id: hal-02187130
https://hal.sorbonne-universite.fr/hal-02187130
Submitted on 17 Jul 2019HAL is a multi-disciplinary open access
archive for the deposit and dissemination of sci-entific research documents, whether they are pub-lished or not. The documents may come from teaching and research institutions in France or abroad, or from public or private research centers.
L’archive ouverte pluridisciplinaire HAL, est destinée au dépôt et à la diffusion de documents scientifiques de niveau recherche, publiés ou non, émanant des établissements d’enseignement et de recherche français ou étrangers, des laboratoires publics ou privés.
Silicates
Benoît Dubacq, Alexis Plunder
To cite this version:
Benoît Dubacq, Alexis Plunder. Controls on Trace Element Distribution in Oxides and Silicates. Journal of Petrology, Oxford University Press (OUP), 2018, 59 (2), pp.233-256. �10.1093/petrol-ogy/egy027�. �hal-02187130�
CONTROLS ON TRACE ELEMENT
DISTRIBUTION IN OXIDES AND SILICATES
Benoît Dubacqa*, Alexis Plundera,baSorbonne Universités, UPMC Univ. Paris 06, CNRS, Institut des Sciences de la Terre de Paris
(ISTeP), 4 place Jussieu 75005 Paris, France
bDept. of Earth Sciences, Utrecht University, Heidelberglaan 2, 3584CS Utrecht, The
Netherlands
*corresponding author: [email protected] Tel: 00 33 144 27 51 01
Running title: Controls on trace element distribution in oxides and silicates
How to cite: Dubacq B., Plunder A. (2018) Controls on trace element distribution in oxides and silicates. Journal of Petrology 59, 2, 233 – 256, doi: 10.1093/petrology/egy027
Abstract
Understanding and quantifying the
partitioning of elements in low concentrations is important for petrology, as minor and trace elements are used as tracers of many geological processes. The lattice strain model has consequently been found very useful, as it links mineral/melt partition coefficients to the elastic properties of the mineral and to the difference in ionic radius between the trace element and the cation it replaces. However, this model has limitations, particularly in terms of describing crystal strain, due to the form of the equation and from the choice of a hard-sphere model.
After a review of the thermodynamics of trace element incorporation into crystal sites and equilibrium between mineral phases, this article presents classical atomistic modelling using transferable empirical potentials. Following incorporation of one (or more) mismatching element(s), crystal strain appears strongly related to the environment of the site of exchange, with anisotropic, vacancy-rich minerals deforming more than densely-packed minerals, due to anisotropic deformation, rotation and tilting of the surrounding polyhedra. As shown by the computed cation-oxygen length in strained crystal sites, bond strain is smaller than the difference in cation radii, and varies between structures, with densely-packed minerals being less strained. Consequently, computed relaxation energies are smaller in less compressible minerals. This has implications for modelling the partitioning of trace elements, and highlights the limits of using continuum mechanics below crystal cell scale. Neither oxides nor silicates have isotropic elastic properties, and at nanoscale they do not deform like continuous material. Predictions of partitioning between mineral and melt (or fluid) remain hampered by several factors, amongst which i) knowledge of the thermodynamics properties of the
dissolved species (in melts and fluids), ii) the precision of estimated defect and strain energies and iii) the presence of solid solution in natural systems, even when limited to a few percent. The latter may have orders-of-magnitude effects on the calculated partition coefficients due to interactions between strain fields around minor cations, leading to a chemical mixing regime at low concentration different from solid solutions where phase components are found in high proportions. Partitioning between mineral phases in an assemblage is described with similar equations as for mineral / liquid equilibria. In cases where terms linked to fluid species disappear, such as incorporation with similar substitutions in two minerals, the assumption that crystal strain energy is the preponderant term during cation exchange becomes unnecessary and it is preferable to use defect energies rather than strain energies.
Application and discussion of these concepts are presented for mineral/melt partitioning and for partitioning between minerals, using garnet/clinopyroxene equilibria. Advantage of atomistic modelling is that it does not rely on fitting. Agreement with experimental data shows predictive accuracy within an order of magnitude, which is poorer than what may be achieved by fitting the lattice strain model to experimental data, but validating the theoretical approach and sufficient for application to some petrology problems. Improvements of the modelling for better application to minerals like augite involve systematic work on the effect of solid solutions on the strain field around defects and imply solving ordering problems. Key words (alphabetical order)
atomistic simulation; equilibria;
geochemistry; igneous petrology;
metamorphic petrology; partition coefficient; thermodynamics; trace element
INTRODUCTION
Minor and trace elements have been used for decades as tracers of geologic processes in a broad sense, with considerable success on extremely varied materials and case studies (see for example Allègre et al., 1977; Putirka, 2009). Understanding and quantifying the trace element distribution between fluids and co-existing minerals is consequently of huge interest for petrology, not only in magmatic settings but also for metamorphic petrology where fluids have H2O or CO2-rich solvent -
as opposed to silicate melts.
There is interest in using elements in low concentration for studying metamorphic processes, and particularly in quantifying partitioning for complex minerals such as amphibole and phyllosilicates (chlorite, micas, serpentine). These have been shown to be key for the cycling of light, fluid-mobile elements as well as large-ion lithophile elements (Bebout et al., 1999, 2007, 2013; El Korh et al., 2009 ; Pabst et al., 2012; Scambelluri et al., 2015) in addition to being
used as proxies for crystallization
environment (Deschamps et al., 2012) and for
thermobarometric purposes relying on
thermodynamic modelling (e.g. Plunder et al., 2012; Dragovic et al., 2012; Baxter & Caddick, 2013).
However thermodynamic models for amphibole and phyllosilicates suffer from complexities arising from numerous solid solutions, polytypes, iron speciation, and metastability, all of which take place to various extents in chlorite (Holland et al., 1998; Vidal et al., 2006; De Andrade et al., 2011), phengite (Massonne & Szpurka, 1997; Parra et al., 2002), illite (Dubacq et al., 2010; Bourdelle et al., 2013), smectite (Vidal & Dubacq, 2009; Andrieux and Petit, 2010) serpentine (Evans, 2004) and amphibole (Diener and Powell, 2012). Additional difficulties such as identifying mineralogical assemblages at equilibrium in deformed,
brecciated or partially molten rocks and
estimating the composition of the
corresponding fluids hamper
thermobarometry and reactive transport modelling..
An important difference between trace and major elements is their sensitivity to reservoir effects, where small fractions of minerals in the rock may control the chemical budget of trace elements, as for Nd in monazite and Hf in zircon (Garçon et al., 2011). The reservoir effect may also induce very strong zoning in minor and trace elements in minerals showing otherwise homogeneous contents in major elements (e.g. Ginibre et al., 2002) and fractionate element ratios in the manner of Rayleigh distillation (e.g. Kohn, 2003). This sensitivity may be used to reconstruct the petrologic history of magmatic and metamorphic assemblages, with the advantage of being independent from thermodynamic modelling based on pseudo-sections and multi-equilibrium thermobarometry: the trace element signature of parageneses provides an independent record of (dis)equilibrium (e.g. Zack et al., 2002; Rubatto and Hermann, 2003). This requires quantifying the extent of trace element incorporation in complex and ubiquitous crystals like amphibole and phyllosilicates, and their partitioning with other phases.
Estimating partition coefficients between crystals and melts in the absence of measurements has been shown to be possible, at least within an order of magnitude, first through the use of Onuma diagrams (Onuma et al., 1968) and then with a simple equation by Blundy and Wood (1994), which links crystal/melt partitioning to the elastic properties of the crystal and to the size misfit between the trace element and host crystal lattice during cation exchange. This approach known as the lattice strain model has met considerable success, and has been refined
and inverted in various ways, such as recalculating the elastic properties of crystal sites by fitting the lattice strain model to
experimentally-derived trace element
partition coefficients (e.g. van Westrenen & Draper, 2007; Frei et al., 2008; Pickles et al., 2016). The thermodynamic expression of partitioning between a mineral and a melt or a metamorphic fluid being essentially identical, the lattice strain model should bring
useful constrains on partitioning in
metamorphic rocks and mineral assemblages (see e.g. Pickles et al., 2016), and was tested with this aim in the present study.
This article discusses the limits of the lattice strain theory after a brief review of the mathematical formulation of trace element partitioning in rocks, with and without fluids, for magmatic and metamorphic systems. From this theoretical starting point, we advance the idea that using continuum mechanics approaches is inappropriate to study trace element incorporation in minerals, due to elastic anisotropy and to the site dependency of crystal strain, consistently with previous analysis of strain fields around point defects (e.g. Eshelby, 1951; Carpenter et al., 2009). Atomistic simulations are used to study strain around trace elements incorporated in various minerals. These results illustrate why using differences in cation radii as a measure of crystal strain is inaccurate. It is further shown that the local environment of the defect-bearing sites, not only their elastic properties, plays a major role in crystal strain: “flexible” environments, such as interlayer positions in phyllosilicates and in the vicinity of vacancies, are more deformed by point defects (and therefore have higher strain energy) than stiff densely-packed crystals. Applications to prediction of partition coefficients for mineral/melt and in a classical garnet/clinopyroxene assemblage
are shown. While agreement with
experimental data is imperfect and within the order of magnitude, the theoretical approach
is validated. Further improvements are possible with more detailed studies of
ordering in minerals and of the
thermodynamics of the fluid species.
APPROACH FOR MODELLING AND THERMODYNAMIC BASIS
The approach for modelling trace element incorporation within a mineral structure is briefly reviewed below, applying general equations to examples from the literature. The aim is to show the links between minerals and fluids, the complexities arising from the numerous possible substitutions, as well as to provide rationalization and simplification methods. Throughout the text, trace element incorporation in the mineral structure is
modelled via substitution within
crystallographic sites, and expressed for cations only. Presented equations and conclusions will also broadly apply to anions such as halogens, which follow similar incorporation mechanisms. Noble gases and neutral species are not considered here, although they may follow some of these mechanisms – e.g., the filling of large pre-existing vacancies such as the ring sites of amphibole is thought to be of major importance for noble gases (Jackson et al., 2016). Other mechanisms for trace element incorporation (e.g. adsorption on surfaces, trapping in crystals within fluid inclusions) are not investigated here, although they may also be of importance in some settings for budgeting trace element contents (see e.g. Tipper et al., 2012; Kumagai et al., 2014, respectively). Incorporation of atoms within H2O-bearing crystallographic sites, such as
the interlayer sheet of clay minerals or micro-porous structures as zeolites, is not considered in this article either, because the properties of intra-crystalline H2O molecules
are difficult to model within the framework of rigid structures and atomistic modelling as carried out below cannot reproduce them. However, there is clear evidence that the
properties of water clusters in the interlayer sheet of clay minerals depend on the ionic potential of cations (e.g. Vidal & Dubacq, 2009), suggesting broadly similar trace element dependencies over charge and ionic radius, although likely different in magnitude to anhydrous crystal sites.
Mineral / liquid partitioning
The equation of trace element incorporation as defects within a host mineral structure, from a melt or from a fluid, is written as an exchange between the host crystal and the trace element initially in solution (McIntire, 1963; Banno & Matsui, 1973; Blundy & Wood, 1994, 2003, and references therein). For instance, Ni incorporation into forsterite (Fo) reads:
Mg2SiO4+2 Ni2+(L)⇔2 Mg2+(L)+Ni2SiO4
(1)
Forsterite+2 Ni2+(L)⇔2 Mg2+(L)+Ni-doped Forsterite
where (L) indicates species within a liquid phase1. The corresponding partition
coefficient D is simply 𝐷NiFo/𝐿 = 𝑥NiFo/𝑥Ni𝐿 (following Morse, 2015, for the definition of the partition coefficient D and of the distribution – or exchange – coefficient KD
below), with x the molar concentration of the element in the component (𝑥Ni𝐿 is the Ni content of the liquid and 𝑥NiFo that of the Ni-doped forsterite). The equilibrium constant
K1 of reaction 1 is: 𝐾1 = (𝑎Mg2+𝐿 )2.𝑎 Ni2SiO4 𝑎Mg2SiO4.(𝑎Ni2+𝐿 )2 (2)
1 When used in this paper, the term “liquid” refers to
melts and metamorphic fluids, even though the latter may be in supercritical form.
2Molecular end-members have often been preferred
for silicate melts to 1M ideal solute components in publications, including thermodynamic datasets (e.g.
where a denotes the activity of the thermodynamic component: aNi2SiO4 is the
activity of the Ni-olivine end-member and increases with Ni content, aMg2SiO4 in
Ni-forsterite approaching unity at low Ni content. The use of molecular end-members for the solid phase here is for simplification of notation, it is not necessarily assumed that discrete units of each end-member are found in the structure2. However the choice of
end-members impacts the relationship between the equilibrium constant K1 and the
corresponding distribution coefficient KD,
defined as: 𝐾𝐷 = (𝑛Ni/𝑛Mg) 𝑆 (𝑛Ni/𝑛Mg)𝐿 = 𝑥Ni2+𝑆 .𝑥Mg2+𝐿 𝑥Mg2+𝑆 .𝑥Ni2+𝐿 (3)
Within an ionic solution model where Ni2+ is incorporated on one site of multiplicity
m = 2, aNi2SiO4 =
(𝑥Ni2+𝑆 𝛾
Ni2+)𝑚=(𝑥Ni2+𝑆 𝛾Ni2+)2 and aMg2SiO4 =
(𝑥Mg2+𝑆 𝛾
Mg2+)2, with an activity coefficient
(Wood & Nicholls, 1978; Ganguly & Saxena, 1987; Spear, 1993; Mäder et al., 1994,
amongst others). Assuming that the
components behave ideally both in the liquid and in the solid ( = 1) leads therefore to K1 =
(KD)2. Choosing MgSi0.5O2 and NiSi0.5O2 as
end-members yields:
MgSi0.5O2+ Ni2+(L)⇔ Mg2+(L)+NiSi0.5O2
(4)
with equilibrium constant 𝐾4 =
𝑎Mg2+𝐿 .𝑎NiSi0.5O2
𝑎MgSi0.5O2.𝑎Ni2+𝐿 (5)
where K4 = KD in an ideal mixing scheme. In
natural melts or metamorphic fluids, deviation from ideal behaviour may be
Hirschmann and Ghiorso, 1994; Holland and Powell, 2011; Green et al., 2012). However the activity of a species may be equivalently expressed with both 1M components or molecular end-members provided that activity-concentrations relations are accounted for (Evans and Powell, 2006; Dubacq et al., 2013).
intuited to be larger for the host cation Mg2+(L) than for the trace element Ni2+(L) if the latter is very dilute (Henry’s law).
Dependency of partitioning on
composition and solid solutions
There is a wealth of discussion of the impact of composition on trace element partitioning, already detailed in the early review of McIntire (1963). Solid solutions lead to the exchange of cations over large proportions (≥ 1%) in the host crystal, such as incorporation of a fayalite component (Fa: Fe2SiO4) into
olivine (similar to Eq. 1). These solid solutions are linked to a change in the mineral/liquid partition coefficient, which may range over orders of magnitude even in the case of ideal mixing (e.g. Lagache & Dujon, 1987). For the olivine example, this translates as: 𝐷Niolivine/𝐿 varies because 𝐷NiFo/𝐿 ≠ 𝐷NiFa/𝐿. An exchange reaction in the form of Eq. 1 may be written for the Fa
component with equilibrium constant
𝐾1(Fa)= (𝑎Fe2+𝐿 )2.𝑎Ni2SiO4
𝑎Fe2SiO4.(𝑎Ni2+𝐿 )2. The variation of the
equilibrium constant with composition is linear in an ideal model; this is not so in the case of Ni incorporation in olivine as 𝐷Niolivine/𝐿 varies non linearly with the Fo content (Schreiber, 1979; Matzen et al., 2013): even at low Ni content where it may be argued that the activity of trace species nears ideality (e.g. Häkli & Wright, 1967),
aMg2SiO4 and 𝑎Mg2+𝐿 may not be equal to
xMg2SiO4 and 𝑥Mg2+𝐿 , so that K1 is affected. For
minor Ni contents (0.5 mol. %), Hirschmann & Ghiorso (1994) showed that aNiSi0.5O2 is not
equal to xNiSi0.5O2 and varies along the
forsterite-fayalite solid solution. Substitutions over several sites
For minerals with several crystallographic sites prone to exchange, such as forsterite which has two octahedral sites (M1 and M2) where divalent cations may be hosted, trace
element partitioning may differ between sites, in the manner of Fe-Mg ordering reactions (e.g. Rinaldi et al., 2000; Redfern et al., 2000). In forsterite the corresponding exchange reaction is:
(Ni2+)M1+(Mg2+)M2⇔(Mg2+)M1+(Ni2+)M2
(6)
with equilibrium constant 𝐾6 =𝑎Mg2+
M1 .𝑎
Ni2+M2 𝑎Ni2+M1 .𝑎
Mg2+M2 ,
which may be similarly expressed in terms of the molecular end-members NiM1MgM2SiO
4
and MgM1NiM2SiO4. Two reactions in the
form of Eq. 1 appear:
Mg2SiO4+Ni2+(L)⇔Mg2+(L)+NiM1MgM2SiO4
(7)
Mg2SiO4+Ni2+(L)⇔Mg2+(L)+MgM1NiM2SiO4
(8)
where only two out of the three reactions (Eq. 6, 7 and 8) are independent. For forsterite, small divalent cations (such as Co2+ and Ni2+) have been shown to favour the M1 site, and larger cations (such as Mn2+) the M2 site, with the consequence that K6 ≈ 10 (Rajamani
et al., 1975; Annersten et al., 1984; Miyake et al., 1987) . This approach is useful for rationalizing exchange reactions in complex minerals like phyllosilicates: the Ni2+-Mg2+
exchange in clinochlore
(Mg5Al2Si3O10(OH)8) may take place in up to
4 octahedral sites occupied by Mg (Joswig et al., 1980; Zanazzi et al., 2006), with varying bond types (4 Mg-O and 2 Mg-OH bonds in M1 and M2, 6 Mg-OH bonds in M3 and M4) and bond lengths (from ~1.98 Å to ~2.10 Å) and therefore varying bond enthalpy (e.g. Vieillard, 1994a).
Coupled substitutions and vacancies Coupled substitutions (e.g. Tschermak) as well as creation of vacancies during exchange
allow maintaining charge balance, with contrasted efficiency as discussed below.
Coupled trace element exchange: Li+ + La3+ in forsterite
Heterovalent substitutions may be achieved by simultaneous incorporation of two defects, with identical or different charges. For example trivalent REE may be swapped with
Mg2+ in forsterite concomitantly to
substitution of another Mg2+ for Li+: Mg2SiO4+Li+(L)+La3+(L)⇔
2 Mg2+(L)+LiLaSiO4 (9)
with equilibrium constant 𝐾9 =
(𝑎Mg2+𝐿 )2.𝑎 LiLaSiO4
𝑎Mg2SiO4.𝑎Li+𝐿 .𝑎La3+𝐿 . This reaction is
energetically favourable to straight La3+ incorporation into the solid (e.g. Allan et al., 2003), however its efficiency (as measured via the activity of the trace element mineral end-member LiLaSiO4) may be expected to
be small3 unless large proportions of Li are available in the liquid phase (aLiLaSiO4 is
proportional to the product of trace element activities: 𝑎Li+𝐿 . 𝑎
La3+ 𝐿 ).
Defect and substitution with a major element: Ba2+ in muscovite
The incorporation of heterovalent trace elements is therefore eased by the presence of a major element in the substitution mechanism. For example Ba2+ incorporation
in muscovite (KAl3Si3O10(OH)2) can take
place through the reaction: Ba2+(L)+Al3+(L)+KXII(Al
2,□)VI(Al,Si3)IVO10(OH)2 ⇔
K+(L)+Si4+(L)+BaXII(Al
2,□)VI(Al2,Si2)IVO10(OH)2
(10) where □ is a vacancy and IV, VI and XII are
coordination numbers (Grapes, 1993;
Hetherington et al., 2003; Ibhi et al., 2005).
3This leads McIntire (1963) to state “it is reasonable
to conclude that two or more trace elements will
Ba2+ is incorporated in interlayer position replacing K+, and Al3+ is exchanged with Si4+ in an adjacent tetrahedral site. In metamorphic fluids at equilibrium with muscovite, Al3+ is readily available (e.g. Verlaguet et al., 2006), therefore not limiting unlike Li in Eq. 9.
Vacancy creation: Ba2+ in muscovite and La3+ in forsterite
Another possibility of Ba2+ incorporation into muscovite is the creation of interlayer vacancies □XII, which by definition are not
limiting either: Ba2+(L)+2
KXII(Al2,□)VI(Al,Si3)IVO10(OH)2 ⇔
2 K+(L) + 2
(Ba0.5,□0.5)XII(Al2,□)VI(Al,Si3)IVO10(OH)2
(11)
The creation of vacancies may account for incorporation of many cations through heterovalent substitutions, such as trivalent cations like La3+ into forsterite (here expressed as Mg4Si2O8 for convenience):
Mg4Si2O8+2
La3+(L)⇔3 Mg2+(L)+La
2□MgSi2O8
(12)
The prevalence of one incorporation mechanism over the other (Eq. 10 and 11) may be concentration-dependent, with the possibility that one of the two substitutions is energetically favoured in the dilute limit but not at higher concentrations – involving short- and long-range ordering and favouring the other substitution.
Mineral / mineral partitioning
Even though fluids are major actors in redistributing species within metamorphic
partition between a liquid and a solid solution as if the other trace elements were not present” (p.1220).
rocks of all grades, remnants of fluid phases are often elusive and harder to characterize
than the minerals with which they
equilibrated. Expressing trace element partitioning between minerals is therefore important to reconstruct the trace element budget of metamorphic rocks and restite, and to verify whether equilibrium was achieved in the considered assemblage. Taking the example of Ni and Mn in forsterite MgSi0.5O2
and enstatite (En, MgSiO3 orthopyroxene), Ni
incorporation in enstatite from a liquid L is in the form of Eq. 4:
MgSiO3+ Ni2+(L)⇔ Mg2+(L)+NiSiO 3
(13) Eq. 4 and 13 combine to yield:
MgSi0.5O2+NiSiO3⇔ NiSi0.5O2+MgSiO3
(14)
which describes equilibrium between
minerals, via a solvent (melt or metamorphic fluid) now implicit. Note that the terms for liquid species disappear only if the incorporation mechanism in the mineral phases involves the same host cation. Mn incorporation leads similarly to:
MgSi0.5O2+MnSiO3⇔ MnSi0.5O2+MgSiO3
(15) Equations 14 and 15 yield:
MnSi0.5O2+NiSiO3⇔ NiSi0.5O2+MnSiO3
(16)
which is the final partition equation for both trace elements Mn and Ni in enstatite and forsterite. The corresponding distribution coefficient 𝐾𝐷(Mn Ni) Fo/En is: 𝐾𝐷(Mn Ni) Fo/En =𝑥MnFo.𝑥NiEn 𝑥NiFo.𝑥 MnEn = 𝐷MnFo/En 𝐷NiFo/En (17)
4“Deux corps étant mis en présence simultanément de
deux dissolvants se partagent entre eux comme si
where 𝑥MnFo is the concentration of Mn in forsterite and so on. 𝐷MnFo/En and 𝐷NiFo/En are individual partition coefficients for Mn and Ni, which if known can be used to calculate 𝐾𝐷(Mn
Ni) Fo/En
. Assuming that the considered trace elements behave ideally (i.e. non-ideal interactions are sufficiently small that activity equals concentration), 𝐾𝐷(Mn
Ni) Fo/En
is the equilibrium constant of reaction 16 and can be directly measured on the mineral assemblage (an assumption already described by Berthelot, 1872)4. The interest of this approach is obvious for petrology (as noted by Häkli & Wright, 1967), from melting models to lower-temperature processes such
as using tracers of equilibrium in
metamorphic rocks and quantifying
pollutants partitioning. However, accurate estimation of partition coefficients between minerals is not straightforward for reasons of precision of measurements and assumptions over equilibrium (as discussed by Zack et al., 2002, for eclogitic conditions).
A DISCUSSION OF THE LATTICE STRAIN MODEL
Role of strain energy
Distinction between the free enthalpy of fusion of the host mineral (Mg2SiO4 in Eq. 1)
and the free energy of exchange (e.g. Gr of
reaction 4) is fundamental to the description of partitioning (Blundy & Wood, 1994), through the equilibrium relation ΔGr0(4) = −R. 𝑇. ln (𝐾4) where T is temperature and R
the ideal gas constant. The free energy of exchange ΔGr0(4) is assumed to be controlled
by the energy required to deform the forsterite lattice when incorporating Ni as a defect into one of the Mg sites of forsterite. This translates as assuming that the difference in standard state chemical potentials of the
chacun de ces corps agissait isolément” (Berthelot, 1872, p. 417).
liquid species is equal to the difference in standard state chemical potentials of their solid counterpart plus strain energy of the host crystal UεNi→Fo, or in terms of Eq. 4:
𝜇Mg2+(L)0 − 𝜇 Ni2+(L) 0 = 𝜇 MgSi0.5O20 − 𝜇NiSi0.5O20 + U ε Ni→Fo (18)
Assuming first that the activity of components equals their concentration (e.g. 𝑎MgFo = 𝑥
MgFo), then that UεNi→Fo is the main
control on partitioning, combines with Eq. 5 to yield:
𝐷NiFo/𝐿 =𝑥MgFo 𝑥Mg𝐿 exp (
-UεNi→Fo
R.𝑇 ) (19)
with 𝑥MgFo the fraction5 of Mg in forsterite. In
this expression, the composition and properties of the liquid appear only through its cation concentration (here 𝑥Mg𝐿 ). This implies direct limitations, for example on modelling calcium partitioning in olivine (more sensitive to the amount of alumina, alkali and ferrous iron in the melt than to temperature, e.g. Libourel, 1999) and on modelling the effect of pressure on the melt structure (which impacts speciation and partitioning: Mysen & Kushiro, 1979; Cochain et al., 2015, amongst others). It is also noteworthy that strain energy (UεNi→Fo) is by definition a positive quantity, whether the defect is smaller than the host ion, larger, or a vacancy. Therefore in Eq. 19, 𝐷NiFo/𝐿 increases with temperature (as the term exp (-Uε
Ni→Fo R.𝑇 ) approaches unity) up to 𝑥Mg Fo 𝑥Mg𝐿 . As values larger than 𝑥Mg Fo
𝑥Mg𝐿 have been reported for 𝐷Ni Fo/𝐿
above 1000°C (e.g. Häkli & Wright, 1967; Duke, 1976; Mysen, 1976), it is arguable that the
5Concentrations of host and trace cations may be
expressed in weight or mole fractions in the bulk mineral or liquid, but not as fractions of
first assumption of ideality of the host cation may be erroneous in some systems.
For trace element partitioning
between two minerals (taking Eq. 14 as an example), similar reasoning leads to the disappearance of the terms involving liquid species. For example the Gibbs energy of reaction for Ni incorporation into enstatite (Eq. 13) is assumed to follow ΔGr0(13) = UεNi→En, and Ni partitioning between
forsterite and enstatite (Eq. 14) simplifies as ΔGr0(14) = U ε Ni→Fo-U ε Ni→En . In this view: 𝐷NiFo/En = 𝑥MgFo 𝑥MgEnexp ( -UεNi→Fo+U ε Ni→En R.𝑇 ) (20)
which is independent of the liquid species terms but still relies on assuming that the
difference in properties of melts and mineral species is subordinate to the energy of crystal strain (assumption which yielded Eq. 19 from
Eq. 18).
The lattice strain model
Following the work of Brice (1975), the model of Blundy & Wood (1994) assumes that the size difference between cations leads to a local strain in the crystal, with a strain energy depending on the Young’s modulus of the crystal, equivalent to a “local elastic pressure” (Brice, 1975). The following equation has been proposed for strain energies Uε (Brice, 1975; Blundy & Wood,
1994, 2003; Wood & Blundy, 1997, amongst others):
Uε = 4. 𝜋. 𝐸. NA(𝑟20(𝑟𝑀− 𝑟0)2+13(𝑟𝑀−
𝑟0)3) (21)
where E is the Young’s modulus of the crystal, rM the ionic radius of the defect
element M, r0 the “strain-free” radius of the
crystallographic site occupancies, to account for the multiplicity of sites in minerals.
host cation in the crystal lattice, NA
Avogadro’s constant. Brice (1975) originally calculated the strain energy (Eq. 21) resulting from replacing the host ion by an ion with similar charge, but different radius, as the work required to expand a sphere of radius r0
to rM. Injecting this expression into a
partitioning equation such as Eq. 19 allows estimating partition coefficients using only the charge and radius of the trace cations.
This expression of strain energy has been found to partly match relaxation energies. Relaxation energies are defined as the difference between the defect energy before and after relaxation, e.g. for Ni in forsterite the difference between the energetic level of the forsterite structure with one Ni atom replacing one Mg atom, and that of the altered forsterite structure with atomic positions optimized around the Ni defect to minimize the overall energy. Such relaxation energies have been calculated with semi-empirical atomistic models (Allan et al., 2003; van Westrenen et al., 2003): the shapes of the dependence of the strain energy (Eq. 21) and relaxation energies to the cation radius appear globally identical, but estimated Young’s moduli are higher by an order of magnitude than their measured equivalents for forsterite and diopside for example, and must be altered as well as the ionic radius of the host cation to improve the fit.
Differences between partition
coefficients measured and estimated with Eq. 21 have been explained by variations in optimum site radius and site valence (e.g. Wood & Blundy, 2001; Adam & Green, 2006), to account for solid solutions and sites with mixed occupancies. Hammouda et al. (2009) have shown systematic differences between calculated and experimentally-derived clinopyroxene/melt and garnet/melt partition coefficients, which they attributed to a combination of vacancies in clinopyroxene
and of the peculiarities of the structure of carbonated melts.
For minerals with several crystal sites, the assumption that the elastic properties of the bulk crystal are relevant to describe interactions on varied sites has been mitigated with the concept of “site compressibility” where using an elastic property per site has been preferred (e.g. Allan et al., 2003; Frei et al., 2008; Cartier et al., 2014), with Young’s modulus or bulk modulus depending on publications. The incorporation of ions in sites where the host cation has a different charge, involving a coupled substitution mechanism as presented above to maintain charge balance, has also been studied in the light of the lattice strain model (see Wood & Blundy, 2001), where the apparent Young’s modulus has been identified as a fundamental control on the curvature of the partition equation when plotted in Onuma diagrams.
The misfit between observables and Eq. 21 is therefore often explained by the properties of the crystal, of the exchanged cations or of the melts, however these discrepancies likely originate from the form of Eq. 21, which is questionable. Brice (1975) assumed that the strain integrates over the sphere radius as ∫ 𝜀 d𝑟𝑟∞
𝑀 = 𝑟𝑀− 𝑟0. This is
equivalent to the sum of the displacements of all particles within the strained material but inconsistent with the definition of strain, which is expressed as a dimensionless quantity, scaled to the original length (or volume) of the material: 𝜀 =𝑟𝑀𝑟−𝑟0
0 or 𝜀 = 𝑉𝑀−𝑉0
𝑉0 , with the consequence that strain such
as that due to displacement of atoms around the exchanged cation tends to zero with increasing size of the material, unlike in the definition of Brice (1975).
Figure 1. Schematic effect of homovalent cation substitution (An+⇔ Bn+) within an isotropic material symbolised by a square grid where atoms are located on the nodes. The initial grid around A (solid lines) is homogeneously radially deformed to the dotted coloured curves when the bigger B cation is substituted to A (white arrow). Black arrows (1-4) show the displacement of the nodes of the grid and decrease in length away from the centre (1 > 2 > 3 > 4). Shearing is highlighted by the curving of the originally straight grid, a consequence of radial strain.
The use of Young’s modulus as the appropriate elastic property to solve a radial
strain problem is also questionable.
Assuming that cation exchange takes place at the origin of an isotropic body of infinite size, and forcing a larger cation defined as an elastic sphere of radius (1+α)r0 into a
spherical hole of radius r0, the elastic
displacement ui along i is defined as 𝑢𝑖 =
𝛿𝑥𝑖/𝑟3, with 𝛿 = 𝛼𝑟
03(1 + 𝜈)/3(1 − 𝜈) (see
Eq. 20 of Eshelby, 1951) where ν is Poisson’s ratio. ν depends on the shear modulus µS and
on the bulk modulus BM of the material such
as 𝜈 = (3𝐵𝑀− 2 𝜇𝑆)/(2(3𝐵𝑀+ 𝜇𝑆)). This is illustrated in Fig. 1 using a square grid deforming isotropically by insertion of a larger sphere within the material: lines are deformed into curves, showing that shearing takes place even if the displacement is radial and Young’s modulus is the same in all directions. Two out of the four elastic parameters (E, µS, BM and ν) are therefore
necessary for complete description of strain in an isotropic mineral. Corresponding
equations for traction forces within inclusions and heterogeneities are given in Eshelby (1951, 1956), with the implication that forces are not identical whether α is positive (included sphere is larger than r0) or negative
(included sphere is smaller). It follows that the strain energy is not a symmetrical function of the size difference between host cation and defect. This is important when considering substitution of a series of defects larger or smaller than the host cation, such as substitution of divalent defects with Ca2+, where e.g. Ni2+ and Mg2+ are smaller, and Ba2+ larger. In other words, strain energy into isotropic material is expected to vary between substitution of Mg2+ into Ca-rich material, and substitution of Ca2+ into Mg-rich
material, as quantified below for oxides. Whether defects in minerals (and particularly oxides and silicates) may be accurately accounted for with an isotropic model is discussed below, as well as less obvious assumptions in the use of the ionic radii derived by Shannon (1976) in Eq. 21 when estimating strain due to cation exchange. These assumptions are linked to the use of a hard-sphere model with fixed size for cations and oxygen. First, atomic radii (and therefore bond lengths) of defects are assumed to be the same in the strained crystal and their oxide, second the values used for cation radii must be accurate both in absolute value and relatively to each other, as Eq. 21 depends exponentially on them. A simple
consequence is that predicted defect
incorporation will be energetically favourable to ‘soft’ crystals or sites (low Young’s modulus) at the expense of less compressible crystals or sites (high Young’s modulus), regardless of the effect of strain, when it is arguable that ‘soft’ crystals are more strained than less compressible ones.
Any of these assumptions limits the use of the lattice strain model. They are tested below using atomistic modelling and in
regard of continuum mechanics, with the conclusion that any equation based on a single elastic parameter for estimating partitioning is simplistic at best, even for minerals as simple as periclase (cubic MgO). ATOMISTIC MODELLING: LINKING STRAIN, DEFECT ENERGIES AND RELAXATION ENERGIES
In this section, strain energies are evaluated using atomistic modelling based on force field methods with the GULP code (Gale, 1997; Gale & Rohl, 2003) and empirically-derived potentials. GULP is used to find a local minimum to the lattice energy of the mineral by varying atomic positions within the crystal configuration, a method well adapted to the study of structural defects (see in particular Allan et al., 2003; van Westrenen et al., 2003) and of ordering and solid solution in silicates (Bosenick et al., 2001; Vinograd & Sluiter, 2006, amongst many others), including phyllosilicates (Sainz-Diaz et al., 2001a,b; Palin et al., 2001; Palin and Dove, 2004; Dubacq et al., 2011).
Defect energies and relaxation energies The strain energy Uε is estimated from the relaxation energy (the difference in defect energy before and after relaxation) in previously-optimized crystal structures. The defect energy is first calculated as the difference between the optimized defect-free structure and the same structure with the defect. Relaxation consists in re-optimizing the defect-bearing structure to obtain the relaxed defect energy. Therefore in exchange reactions, the relaxed defect energy, when expressed per mole of defect, may be related to the difference between the standard state chemical potential of the host end-member and that of the defect-bearing end-member. For Ni incorporation into olivine (Eq. 4), this yields 𝜇NiSi0.5O20 = 𝜇MgSi0.5O20 + UrelaxedNi→Fo; with UrelaxedNi→Fo the relaxed defect energy. It is
noteworthy that this definition of the standard
state chemical potential of the NiSi0.5O2
species is that of a Ni-doped forsterite end-member, not of liebenbergite (Ni2SiO4)
which has a different structure, different bond lengths and a different standard state chemical potential. The present definition of 𝜇NiSi0.5O20 is only valid when Ni is a trace
element in forsterite.
Simple access to defect energies is an advantage of atomistic methods as the use of defect energy is superior to that of relaxation energies in some cases, and particularly for mineral partitioning where the assumption of strain energy being the main control becomes unnecessary. For Ni incorporation into olivine:
ΔGr0(4) = 𝜇Mg2+(L)0 − 𝜇Ni2+(L)0 + UrelaxedNi→Fo
(22)
which is of limited use for mineral/melt partitioning as the 𝜇(L)0
of the melt species are poorly known yet, however yields an expression in the form of Eq. 20 for Ni partitioning between forsterite and enstatite: 𝐷NiFo/En = 𝑥MgFo
𝑥MgEnexp (
-UrelaxedNi→Fo+UrelaxedNi→En
R.𝑇 ) (23)
which this time is independent of the properties of the melt species and does not
rely on the assumption that strain energy is preponderant.
Computational method
Similarly to Allan et al. (2003), a
self-consistent collection of Buckingham
potentials derived from previous studies (Lewis & Catlow, 1985; Purton et al., 1996; van Westrenen et al., 2000; Sainz-Diaz et al., 2001a) was used assigning integral positive charges Q to cations (others than H+, such as
QFe2+ = 2, QFe3+ = 3 and so on), a core/shell
model for oxygen (QOcore = 0.86902, QOshell =
-2.86902 with a spring constant) and partial charges for hydroxyls groups (QOcore =
-1.426, QH+ = 0.426). A Morse potential is
used for hydroxyl groups (see Palin et al., 2001). Values for potentials are given in Electronic Appendix 1, with values for three-body interactions used to ensure correct cation coordination. Defect energies are calculated with the Mott-Littleton method (Mott & Littleton, 1938) with inner regions between 12 and 18 Å and outer regions between 20 and 35 Å depending on structure complexity. When assigning defects to sites with partial occupancies (such as Aliv and Siiv in the tetrahedral sheet of muscovite), cations were individually positioned within super-cells with appropriate size (for muscovite, respecting Aliv avoidance). The mean field approximation has been used for these sites when defects were assigned to other sites.
This approach is efficient for a local (in terms of energy) optimization of a given crystal structure and well adapted here where the initial configuration is known. Computed
optimized structures compare very
favourably with more sophisticated
modelling: within a few % of the calculated value at worst for bond lengths in both unstrained and strained crystals (see e.g. ab
initio studies of Freyria-Fava et al., 1993;
Orlando et al., 1994; Israel et al., 2003, on MgO, ScO, BaO, CaO), which is sufficient for the discussion in the present study. In
terms of evaluating defect energies,
comparison between e.g. the ab initio work of Orlando et al. (1994) and the present approach gives a discrepancy of ~0.15 eV for a Ca2+ defect in periclase MgO, which is about 2% of the calculated value. Comparison with more complicated structures and chemical systems is difficult because of the sparsity of ab initio data. A 15% uncertainty on defect energies would leave the discussion in this section unaffected, but estimation of partition coefficients asks for relative precision better than 5% as defect energies vary little within similar structures (see garnet-clinopyroxene example below).
A number of published room-temperature structure refinements have been selected to compare relaxation energies, starting with simple oxides with rocksalt structure (SrO, BaO, CoO, NiO, FeO, EuO, MgO, CaO, MnO: Wyckoff, 1963; Hazen, 1976; Pacalo & Graham, 1991; Fiquet et al., 1999); α-corundum (Lewis et al., 1982); eskolaite (Finger & Hazen, 1980) and Sc2O3
(Schleid & Meyer, 1989). The following room-temperature structure refinements for silicates have been used, simplified when necessary: actinolite (Evans & Yang, 1998, using their refinement with highest Mg proportion and neglecting minor Fe2+, Mn2+, Ti4+ and Al3+); almandine and pyrope (Armbruster et al., 1992); spessartine (Rodehorst et al., 2002); magnesiochloritoid (Ivaldi et al., 1988, replacing Fe2+ with Mg2+
and assigning H+ bonded to O1A
symmetrically to H+ bonded to O1B); clinochlore (Welch & Marshall, 2001); diopside (Levien & Prewitt, 1981); enstatite (Hugh-Jones & Angel, 1994); fayalite (Kudoh & Takeda, 1986); forsterite (Birle et al., 1968); grossular (Meagher, 1975); jadeite (Prewitt & Burnham, 1966); kushiroite (Okamura et al., 1974); lizardite (Mellini & Zanazzi, 1987); muscovite (Richardson & Richardson, 1982); phlogopite (Redhammer & Roth, 2002); talc (Diego Gatta et al., 2012, measured at 223 K, setting α and γ angles at 90°). Mg-celadonite (the phengite end-member as defined by Vidal & Parra, 2000) has been generated from the phlogopite structure, replacing ivAl with ivSi, M1Mg with a vacancy M1□, and filling the M2Mg2+ site
with 0.5 M2Mg2+ and 0.5 M2Al3+ for stoichiometry and following Al-avoidance. Results: Homovalent substitutions
Results are first presented in terms of structural aspects of lattice strain after incorporation of a Ca2+ defect within the Mg site of periclase MgO (Fig. 2) and forsterite (Fig. 3). In these figures the final lattice
configuration is shown, indicating both the distance and direction over which each cation is displaced with reference to the initial lattice (before defect incorporation), by comparison between initial and final coordinates. Strain is considered as terminated and the path followed by each atom between initial and
final lattice configuration is not studied here. The displacement of atoms has been linearly interpolated between atoms after each simulation to help figure readability, without altering the results on the nodes (where atoms are located).
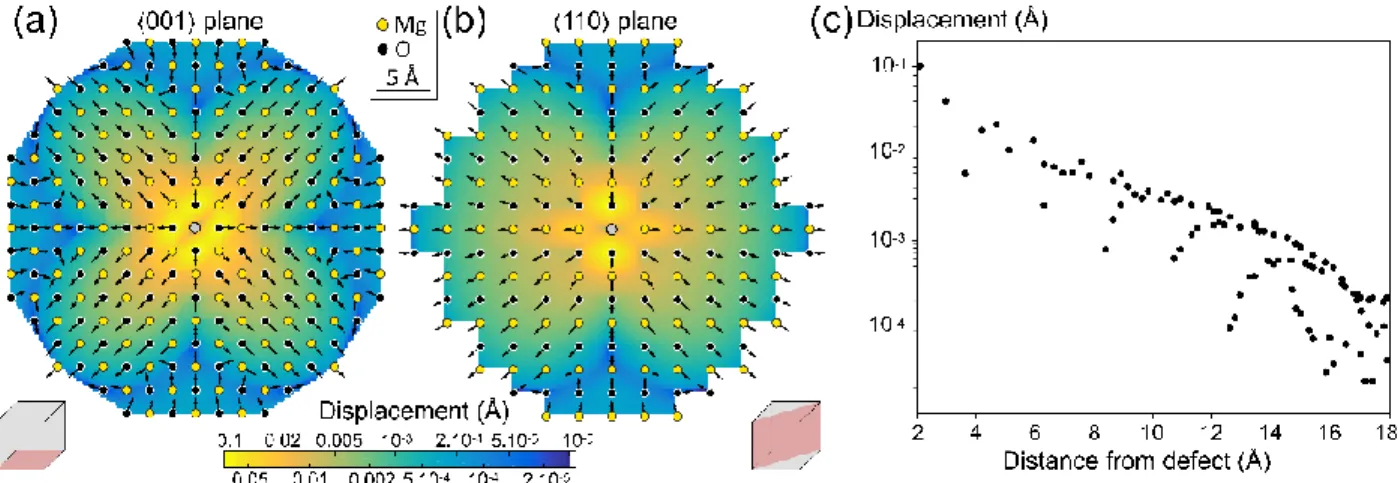
Figure 2: Displacement in periclase MgO around a Ca2+ defect (grey sphere) along the <001> plane (a) and <-110 > plane (b). Planes are shown in pink on the grey cube by the side of each drawing. Arrows show the direction of displacement, with fixed size for readability. Colours show the length of displacement on a log scale from yellow (largest displacement) to blue (negligible and within rounding on coordinates) as on the colour bar (same for a and b). Displacements lengths have been linearly interpolated between atoms. Final atom positions are shown as yellow and black dots for Mg and O. Note that neither the direction nor the length of displacement are radial. (c) Displacement on a log scale versus initial distance of all atoms from the defect. Points overlap due to symmetry (e.g. the six closest oxygen atoms around 2.1 Å from the defect all have a calculated displacement of about 0.1 Å).
Periclase MgO has cubic NaCl rocksalt structure (space group Fm-3m). In figure 2, results of Ca2+ incorporation are
presented with two cross-sections through the Ca2+ defect along different planes, and the length of displacement of each atom is plotted with respect to the initial distance of the atom to the defect. The calculated displacement is maximal for the oxygen atoms closest to the defect, then displacement decreases very rapidly with distance to the defect (Fig. 2c). The calculated displacement falls below 0.01 Å within 6 Å from the defect. Interestingly,
the displacement is anisotropic as well as the directions of displacement of atoms – which are not all pointing away from the defect, even considering only atoms within 6 Å from the defect. Subsequently there are differences between Fig. 2a and Fig. 2b, with less displacement along the axes. The same
patterns are observed with similar
implications for the other cations and in the other simple oxides investigated here, with differences in the magnitude and length of displacement as a function of defect and mineral nature.
Figure 3 (a) Displacement in forsterite around a Ca2+ defect (grey sphere) along the <001> plane. As in Fig. 2, arrows indicate the direction of displacement with fixed size; colours show the length of displacement on a log scale as on the colour bar. Displacements lengths have been linearly interpolated between atoms. (b) Bond strain (as defined in the text) in planar view around the same defect for atoms around the <001> plane. Shades of red indicate stretching and blue compression. The first octahedron (around the defect) is shown. Atomic positions are shown as dots in (a) and (b). No O and Si atoms are exactly on the <001> plane passing through the defect and therefore O and Si appear on (b), not (a).
Similar calculations have been carried out for forsterite, which has a considerably more complicated structure (orthorombic - dipyramidal, space group Pbnm). A Ca2+ ion
has been exchanged with Mg2+ in the M1 site. Figure 3a shows that the calculated displacement is strongly anisotropic, and that the Mg atoms closest to the defect have been shifted not away but towards the defect, even though Ca2+ is larger than Mg2+. Note that this displacement is small (on the order of 10-2 Å)
compared to the displacement of the closest oxygen atoms (on the order of 10-1 Å). Figure 3b shows the strain of individual bonds linking cations and oxygen around the plane shown in Fig. 3a. The Ca2+-oxygen bonds in the central octahedron show the largest amount of stretching (~9% of the original bond length). The Ca2+-oxygen bond lengths do not reach the values observed in monticellite MgCaSiO4: the smallest and
longest Ca2+-oxygen bond lengths are about 2.29 Å and 2.5 Å in monticellite (after Sharp et al., 1987), they are computed at 2.22 Å and 2.35 Å in the Ca-bearing forsterite.
Oxygen-cation bonds in the
surrounding Si4+ tetrahedra and Mg2+
octahedra are variably deformed, with individual polyhedra being variably strained. Stretching some bonds and shortening others induces tilting of the polyhedra close to the defect-bearing site, with the consequence that Mg2+ atoms move towards the defect as seen on Fig. 3a. The incorporation of other divalent defects in the M1 site of the forsterite lattice has been computed to investigate the evolution of strain intensity with defect size, as shown in figure 4. Polyhedra sharing a corner with the defect-bearing octahedron are generally more tilted (Fig. 4a), but less strained (Fig. 4b), than polyhedra sharing an edge (two oxygen atoms) with the defect site. Expansion (positive strain) of one of the edge-sharing octahedra is explained by a combination of expansion of the shared edge (following expansion of the defect site) and tilt of the surrounding polyhedra. Tilting and strain increase with the size mismatch between the swapped cations. The defect-O-cation angle appears to vary linearly with the difference in cation radii (Fig. 4a). Variations in strain of the polyhedra in contact with the
defect site (Fig. 4b) are more complicated and more site-dependent than variations in defect-O-cation angle.
Figure 4Strain of the forsterite lattice around point defects against ion radius (after Shannon, 1976), for tetrahedra (triangles) and octahedra (circles) adjacent to the defect-bearing site. The original forsterite lattice is plotted with the radius of Mg2+. Greyed and open symbols are used for polyhedra sharing one bridging oxygen atom (a corner) and two bridging oxygen atoms (an edge) with the defect site, respectively. (a) Tilt of the polyhedra around the defect (see displacement of atoms in Fig. 3). (b) Volumetric strain of the same polyhedra as (a), expressed in comparison with the forsterite lattice.
To illustrate the effect of varying mineral structure, elastic properties, cation size and charge, figure 5 presents the results of calculations carried out for eight simple oxides (SrO, BaO, CoO, NiO, FeO, EuO, MgO, CaO) with rocksalt structure where the incorporation of each divalent cation has been simulated as in figure 2. Results of similar
calculations are presented for three
isostructural sesquioxides (α-corundum
Al2O3, eskolaite Cr2O3 and Sc2O3) where the
cation has been exchanged with Al, Fe, La, Sc, Y, Nd, Eu, Cr, Gd, Ho, Yb, Lu, Pu and Mn (all in trivalent form). Computations for selected silicates are also shown in Fig.5a and b: divalent cations have been exchanged with Mg2+ into the M site of enstatite, the M1 sites of forsterite, Mg-celadonite and phlogopite, and the M1B site of chloritoid; trivalent
cations have been exchanged into the three M sites of chloritoid hosting Al3+. Results are also shown for divalent cation exchange in the X site of almandine (hosting Fe2+).
The change of the cation-oxygen bond length (bond length) in the site of defect
incorporation is plotted in figure 5a versus the difference in cation size between host and defect, using the values given by Shannon (1976). When sites are deformed (different cation-oxygen bond lengths in the same site), average bond lengths are reported. Positive values for bond length mean that the bond
length has increased due to defect
incorporation, and conversely for negative values. The generally positive correlation shows that bond lengths vary consistently with the size difference of cations. Several
trends appear, with simple oxides, sesquioxides, silicates and sites within
chloritoid forming individual trends
approaching linearity. The divergence from the 1:1 line is largest for simple oxides. This difference implies that bond length in strained crystals is not the sum of fixed atom radii for defect and oxygen - in other words that
atomic radii vary with the crystal structure. This is consistent with ab initio studies on silicates (see Gibbs et al., 2013, for a review) where the electronic structure of oxygen is shown to adapt to the bond length and type. It follows that estimating crystal strain from the difference in atomic radius is inaccurate and should be taken as a rule of thumb.
Figure 5 Links between strain, cation size mismatch and relaxation energy. (a) Variation of cation-oxide bond length within the defect-hosting polyhedron, versus the difference in cation size between host and defect from Shannon (1976), for selected oxides and silicates. Mean bond lengths are used when defect-bearing sites are deformed. Divergence from the 1:1 line shows that lattice strain is not well represented with a hard-sphere model. Correlations appear for oxides with the same structure. (b) Corresponding relaxation energy versus the variation of cation-oxide bond length within the defect-hosting polyhedron, highlighting asymmetric behaviour and differences between oxides, silicates and host site within silicates. (c) Relaxation energy versus bond length variation for Ca2+ incorporated to Mg sites only, for selected minerals, showing positive correlation and stiff minerals less strained than more deformable ones. (d) Relaxed defect energy (Urelaxedcation→host) as a function of mean bond length for divalent cations in oxides and selected silicates. See text for discussion.
Figure 5b presents the relaxation energy estimated for each substitution shown in Fig.
5a. Strikingly, simple oxides and
sesquioxides show a third-degree polynomial dependence of relaxation energy on the change in bond length, as well as silicates and sites within silicates. Relaxation energy is asymmetric with respect to the change in bond length, where the incorporation of small cations implies less strain energy than larger cations (consistently with the analysis of Eshelby, 1951). Relaxation energies within similar structures give at first order comparable dependencies on the change in bond length regardless of the elastic properties of the host mineral.
The asymmetry of Fig. 5b is explained by comparing a Ca2+ defect in MgO and a Mg2+ defect in CaO. In MgO, the initial bond length is 2.10 Å and it stretches to 2.20 Å ( = 0.10 Å) for a relaxation energy around 90kJ/mol after incorporating Ca2+. In CaO, the initial bond length is 2.40 Å and it is reduced to 2.27 Å ( = -0.13 Å) for a relaxation energy around 60 kJ/mol after incorporating Mg2+. The difference between incorporating larger and smaller cations is noteworthy in terms of energy. For crystal strain this difference explains the (second-order) divergence from a straight line of the trend observed for simple oxides in Fig. 5a.
Calculations on octahedral sites of silicates show that their response varies between silicates and between sites in the same silicate, as exemplified by chloritoid where a fourfold increase in relaxation energy
is observed between divalent cation
incorporation in the Mg2+ M1B site and trivalent cation incorporation in the Al3+ M2A or M2B site. The Al3+ M1A site appears intermediate. These relaxation energies are uncorrelated with the elastic properties of individual sites: bulk moduli for octahedral sites of chloritoid have been estimated by
Comodi et al. (1992) around 53 GPa for M1A, 63 GPa for M1B, 144 GPa for M2A and 116 GPa for M2B. However, some general trends are observed: first, OH-bearing sites are more strained (greater bond length on Fig. 5b) and
show higher relaxation energies (see M1B of chloritoid, celadonite, phlogopite). Second, defects incorporated in sites in the vicinity of vacancies are also more strained, with correspondingly higher relaxation energies (compare for example dioctahedral Mg-celadonite to trioctahedral phlogopite).
Figure 5c compares relaxation
energies to strain after incorporation of a Ca2+
defect into Mg-sites, for the Mg-bearing minerals of Fig. 5a-b to which pyrope, clinochlore (M1 and M3), lizardite, actinolite and talc have been added. Periclase MgO and pyrope are less strained and show lower relaxation energies than anhydrous silicates like enstatite and forsterite; phyllosilicates and chloritoid are more deformed and consequently have high relaxation energies. As for Mg-celadonite, defect-bearing sites are very stretched in lizardite and in the M3 site of clinochlore. In lizardite, the Mg-bearing octahedral sites are located in contact with a large interlayer space, in clinochlore the M3 site is part of the interlayer “brucite” sheet. In both these sites associated with interlayer positions, strain is greater than in their mica-like counterpart where octahedral layers are surrounded by stiff tetrahedral layers with which each octahedron shares 4 oxygen atoms (phlogopite, talc and the M1 site of clinochlore on Fig. 4c). The response to strain of the surroundings of the defect-bearing site is an important control on relaxation, which does not solely depend on the elastic properties of a given site but also on the ability of the surrounding polyhedra to deform via tilting.
Corresponding defect energies, after relaxation, are presented for simple oxides
and selected silicates in Fig. 5d. Again, defect energies correlate positively with strain (as measured by the change in bond length or by the difference in cation radius, as these two quantities scale almost linearly in oxides as shown in Fig. 5a). Comparison of defect energies for MgO and NiO, which have cations of similar radii, shows little difference in their response although they have very different elastic properties (for Young’s modulus: MgO = ~310 GPa, NiO = ~130 GPa; Soga & Anderson, 1966; Bass, 1995; de Jong et al., 2015).
These observations are summarized below:
- the use of the cation radii derived by Shannon (1976) with fixed-size oxygen is questionable in itself and particularly as a measure of crystal strain for point defects. The excellent agreement of experimentally-derived radii for Mg2+, Co2+, Ni2+, Mn2+ in
their constituent oxide of Sasaki et al. (1979) with ab initio modelling (e.g. Freyria-Fava et al., 1993; Orlando et al., 1994; Israel et al., 2003) highlights the interest of accounting for variations in the size of the oxygen atom with bond length.
- relaxation energies are poorly correlated with the bulk modulus of the defect site itself, mostly because the immediate surroundings of the defect sites are important for strain propagation.
- relaxation energies are higher in “flexible” environments (where strain is larger) than in densely-packed minerals deforming like stiff elastic wire mesh. This has the counter-intuitive consequence that relaxation energies are higher in hydrated minerals with vacancies (such as the octahedral sheet of phengite) or interlayer spaces (serpentine, chlorite) than in stiff anhydrous minerals like garnet.
- although linking continuum
mechanics and atomistic approaches on point defects has been proposed earlier (e.g. Sahoo, 1984; Garikipati et al., 2006), continuum mechanics is inappropriate to apply to study trace element incorporation in oxides and silicates because of the site dependency of the relaxation energy. Using elastic properties derived for the whole cell, even if elastic anisotropy is considered, is incorrect because the incorporation mechanism matters as well as the nature of the immediate surroundings of the defect site.
Results: Heterovalent substitutions
A difficulty in modelling and quantifying partitioning with heterovalent substitutions is that the number of possible substitutions may be very high. Heterovalent substitutions necessitate swapping of several ions or creating vacancies to maintain charge balance, which may imply considering distinct crystallographic sites and a large range of cations.
Some constraints may be identified to reduce the number of substitutions to investigate. First, defect-bearing polyhedra are thought to be distributed close to one another in order to minimize the charge imbalance distribution (see e.g. Allan et al., 2003). An example of joined Li+ and La3+ substitution in periclase MgO is given below, to compare with Ca2+. Second, as noted previously for Eq. 9, the efficiency of substitutions involving two trace elements may be expected to be small for statistical reasons. Third, the smallest number of cations involved in the substitution mechanism is likely to minimize crystal strain and therefore be energetically favourable. Atomistic simulations for Ba2+ in muscovite are used below to compare two likely substitution mechanisms.
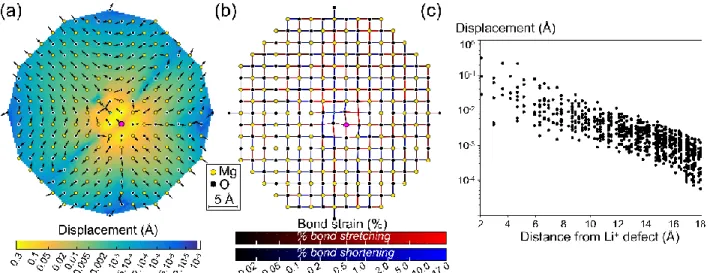
Figure 6. Joined incorporation of Li+ (small blue sphere) and La3+ (larger purple sphere) within periclase MgO. (a) Displacement of atoms along the <001> plane as in Fig. 2: fixed-size arrows indicate the direction of displacement, interpolated colours show the length of displacement from yellow (large) to blue (negligible). (b) Bond strain for bonds along the <001> plane. Stretching (red tones) is evident around La3+, compression (shades of blue) is clearest around Li+. Note that strain intensity is coloured on a log scale. (c) Displacement of atoms on a log scale versus distance to the Li+ defect (centred). Some points overlap due to symmetry. Li+ + La3+ = 2 Mg2+ in periclase MgO
Figure 6 shows the results of exchanging two Mg2+ ions with two defect cations with different charges and contrasted cation radii (Li+: rM = 0.76 Å; La3+: rM = 1.03 Å; for Mg2+:
r0 = 0.72 Å ; Shannon, 1976). The defects
have been positioned in adjacent Mg octahedra along the <001> plane. The computed displacement (Fig. 6a) is strongly anisotropic, both in terms of direction and amplitude of displacement. It is greatest in close vicinity of the defects. Bond lengths in the Li+-bearing site are compressed by a few percent (Fig. 6b). Bonds in the La3+-bearing
site are stretched up to 17% to accommodate the cation 40% larger than Mg2+. Away from the defects, displacement is greatest for atoms aligned with the defects, and decreases quickly (Fig. 6c) but less so than for Ca2+ (compare with Fig. 2). Consequently the displacement is not radial and there is a complex pattern of bond strain with many
polyhedra being twisted (Fig. 6b),
consistently with observations on homovalent substitutions.
The apparent complexity of
displacement and strain highlights the fact
that elastic deformation in minerals around atom-scale point defects differs from the radial point of view of continuum mechanics due to the structuring nature of cation-oxygen bonds: periclase is seen as deforming like a grid, not a continuous material, and far from isotropically.
Ba2+ in muscovite: vacancy creation vs. coupled substitution
Muscovite has no divalent cation in its end-member form. It is composed of two tetrahedral layers enclosing a dioctahedral layer, forming sheets separated by interlayer potassium. From the previous considerations, Ba2+ incorporation likely involves the interlayer site, where Ba2+ may substitute either 1) with K+, and charge balance is
ensured through substitution of a
neighbouring Si4+ with Al3+ (Eq. 10), or 2) with 2 neighbouring K+, keeping charge
balance via a vacancy (Eq. 11).
Using a previously-optimised
muscovite structure respecting Al avoidance in tetrahedral layers (Palin & Dove, 2004), Ba2+ and Al3+ have been exchanged with neighbouring K+ and Si4+, with a resulting