HAL Id: inserm-02527510
https://www.hal.inserm.fr/inserm-02527510
Submitted on 1 Apr 2020
HAL is a multi-disciplinary open access archive for the deposit and dissemination of sci-entific research documents, whether they are pub-lished or not. The documents may come from teaching and research institutions in France or abroad, or from public or private research centers.
L’archive ouverte pluridisciplinaire HAL, est destinée au dépôt et à la diffusion de documents scientifiques de niveau recherche, publiés ou non, émanant des établissements d’enseignement et de recherche français ou étrangers, des laboratoires publics ou privés.
Model-based estimation of left ventricular pressure and
myocardial work in aortic stenosis
Kimi Owashi, Arnaud Hubert, Elena Galli, Erwan Donal, Alfredo Hernández,
Virginie Le Rolle
To cite this version:
Kimi Owashi, Arnaud Hubert, Elena Galli, Erwan Donal, Alfredo Hernández, et al.. Model-based estimation of left ventricular pressure and myocardial work in aortic stenosis. PLoS ONE, Public Library of Science, 2020, 15 (3), pp.e0229609. �10.1371/journal.pone.0229609�. �inserm-02527510�
RESEARCH ARTICLE
Model-based estimation of left ventricular
pressure and myocardial work in aortic
stenosis
Kimi P. Owashi☯, Arnaud Hubert☯, Elena Galli, Erwan Donal, Alfredo I. Herna´ndez*, Virginie Le RolleID
Univ Rennes, Inserm, LTSI - UMR 1099, Rennes, France
☯These authors contributed equally to this work.
*Alfredo.Hernandez@inserm.fr
Abstract
This paper proposes a model-based estimation of left ventricular (LV) pressure for the eval-uation of constructive and wasted myocardial work of patients with aortic stenosis (AS). A model of the cardiovascular system is proposed, including descriptions of i) cardiac electri-cal activity, ii) elastance-based cardiac cavities, iii) systemic and pulmonary circulations and
iv) heart valves. After a sensitivity analysis of model parameters, an identification strategy
was implemented using a Monte-Carlo cross-validation approach. Parameter identification procedure consists in two steps for the estimation of LV pressures: step 1) from invasive, intraventricular measurements and step 2) from non-invasive data. The proposed approach was validated on data obtained from 12 patients with AS. The total relative errors between estimated and measured pressures were on average 11.9% and 12.27% and mean R2were equal to 0.96 and 0.91, respectively for steps 1 and 2 of parameter identification strategy. Using LV pressures obtained from non-invasive measurements (step 2) and patient-specific simulations, Global Constructive (GCW), Wasted (GWW) myocardial Work and Global Work Efficiency (GWE) parameters were calculated. Correlations between measures and model-based estimations were 0.88, 0.80, 0.91 respectively for GCW, GWW and GWE. The main contributions concern the proposal of the parameter identification procedure, applied on an integrated cardiovascular model, able to reproduce LV pressure specifically to each AS patient, by non-invasive procedures, as well as a new method for the non-invasive estimation of constructive, wasted myocardial work and work efficiency in AS.
Introduction
Aortic stenosis (AS) is characterised by a narrowing of the aortic valve opening, which induces a left ventricular (LV) pressure overload. The development of LV hypertrophy in AS is accom-panied by coronary microcirculatory dysfunction [1] that may gradually affect systolic and dia-stolic function [2]. LV ejection fraction (LVEF) is used routinely to assess LV systolic function and is an important parameter for prognosis stratification [3]. However, LVEF depends not
a1111111111 a1111111111 a1111111111 a1111111111 a1111111111 OPEN ACCESS
Citation: Owashi KP, Hubert A, Galli E, Donal E,
Herna´ndez AI, Le Rolle V (2020) Model-based estimation of left ventricular pressure and myocardial work in aortic stenosis. PLoS ONE 15 (3): e0229609.https://doi.org/10.1371/journal. pone.0229609
Editor: Ce´cile Oury, Universite de Liege (B34),
BELGIUM
Received: September 18, 2019 Accepted: February 10, 2020 Published: March 3, 2020
Peer Review History: PLOS recognizes the
benefits of transparency in the peer review process; therefore, we enable the publication of all of the content of peer review and author responses alongside final, published articles. The editorial history of this article is available here:
https://doi.org/10.1371/journal.pone.0229609
Copyright:© 2020 Owashi et al. This is an open access article distributed under the terms of the
Creative Commons Attribution License, which permits unrestricted use, distribution, and reproduction in any medium, provided the original author and source are credited.
Data Availability Statement: All relevant data are
within the manuscript and its Supporting Information files.
only upon the contractility of LV, but also on loading conditions. In fact, ejection fraction may appear to be preserved despite underlying reduced contractility The characterisation of myo-cardial dysfunction is of primary importance to identify patients with reduced contractility. Speckle-tracking echocardiography (STE) assessment of myocardial strain usually provides a better quantification of systolic function than global LVEF [4]. Although strain echocardiogra-phy can provide prognostic information in patients with AS [5], the shortening indices, calcu-lated from cardiac strains, do not reflect myocardial work or oxygen demand. As opposed to the normal LV, where all segments contract almost synchronously and myocardial energy is used effectively, regional dysfunction, that could be induced by myocardial fibrosis [6], could bring a significant loss of efficient work. For instance, the impairment of myocardial diastolic and systolic function, due to fibrosis [7], have shown to induce significant mechanical disper-sion in patients with severe AS [8].
Recently, Russell et al [9,10] have proposed a non-invasive method for LV work analysis, which is based upon an estimated LV pressure curve. As strain is largely influenced by LV afterload [11], model-based myocardial work might be a robust complementary tool, taking into account AS severity and arterial pressures values. In previous works of our team, we have shown that the non-invasive estimation of global myocardial work, when using an LV pressure curve estimation as proposed in [9], is correlated with that obtained when using the observed invasive LV pressure curve, in the context of cardiac resynchronization therapy [12]. However, the accuracy of estimated LV pressure has never been evaluated in the case of aortic stenosis, where high pressure gradients could be observed between LV and the aorta [13]. The experi-mental observation of LV pressure is notably difficult to perform clinically because it requires an invasive, intraventricular measurement. As a consequence, it is necessary to propose novel tools to assess non-invasive LV pressure and to calculate myocardial work in the case of AS.
The first objective of this paper was to propose a model-based estimation of LV pressure in the case of AS. Previous works [14,15] has already shown that lumped-parameter models of ventricular-vascular coupling are able to provide a good agreement between the estimated and the measured left ventricular and aortic pressure waveforms. Based on these papers and previ-ous works of our team [16–18], we proposed a model-based approach, including a multiform-alism model of the cardiovascular system and a parameters identification strategy using a Monte-Carlo cross-validation method, in order to: 1) estimate LV pressure waveform from experimental LV pressure curve, systolic and diastolic aortic pressure values, 2) assess LV pres-sure waveform from only systolic and diastolic aortic prespres-sure values.
The second objective of the paper was to propose a novel tool to estimate myocardial work in AS. Work indices, as proposed in [9,10] and validated in [12], were calculated from non-invasive model-based LV pressure and compared with indices evaluated from experimental signals. This article does not claim to validate the estimation of myocardial work in a cohort of AS patients but it aims to propose an original approach for the assessment of work indices based on computational modelling. The paper is organised as follows: in Section 2, the experi-mental protocol and data under study are presented, the computational model is described and the identification method is explained. In Section 3, the results of applying the described methods are presented and discussed. Discussions are finally specified in Section 4.
1 Materials and methods
1.1 Experimental data
1.1.1 Study population. We prospectively included 12 adults (�18 years old) with severe
(aortic valve area (AVA) � 1cm2, n = 11) and moderate (n = 1) aortic stenosis who underwent a coronary angiography with left heart catheterization.Table 1summarizes patients’ clinical
PLOS ONE Model-based estimation of ventricular pressure and work in aortic stenosis
Funding: This work was supported by the French
National Research Agency (ANR) (ANR-16-CE19-0008-01) (project MAESTRo) and the French Brittany council (ADvICE project).
Competing interests: The authors have declared
characteristics. We excluded patients with concomitant significant aortic regurgitation and mitral stenosis. The study was carried out in accordance with the principles outlined in the Declaration of Helsinki on research in human subjects and received specific ethical approval from of the local Medical Ethics Committee (Person Protection Committee West V—CPP Ouest V, authorization number: 2014-A01331-456). All patients were informed and a written consent was obtained.
1.1.2 Echocardiography. All patients underwent a standard Trans-Thoracic
Echocardiog-raphy (TTE) using a Vivid S6, E7 or E9 ultrasound system (General Electric Healthcare, Hor-ten, Norway). Images were recorded on a remote station for off-line analysis by dedicated software (EchoPAC PC, version BT 202, General Electric Healthcare, Horten, Norway). The analysis of aortic and mitral valve events during a complete TTE loop [mitral valve closure (MVC), aortic valve opening (AVO), aortic valve closure (AVC), mitral valve opening (MVO)] was performed in apical long-axis view and individual valvular events were manually segmented. Standard STE analysis was applied in order to extract regional myocardial strain curves. Also aortic stenosis analysis was performed to estimate the AVA (cm2).
1.1.3 Invasive experimental pressure. The left heart catheterization (LHC) was
per-formed via a retrograde access from the radial artery with a 5 French Judkin R4 catheter (ICU Medical, San Clemente, CA, USA) placed at the mid LV cavity using fluoroscopic screening. Before coronary angiography, transducers were calibrated, with a 0-level set at the mid-axillary line. In a second time, catheter was placed in the thoracic ascendant aorta to measure aortic pressure. The experimental invasive data set includes the measured ventricular pressurePexpLV,
the systolicPexp
ao;sysand diastolicP exp
ao;diasarterial pressures.
1.2 Computational model
Four main sub-models were created and coupled:i) cardiac electrical system, ii)
elastance-based cardiac cavities,iii) systemic and pulmonary circulations and iv) heart valves. The first
three submodels are strongly based on our previous works [16–21]. The model of the heart valves was adapted from [22].
1.2.1 Cardiac electrical system. The proposed model of the cardiac electrical activity, is
based on a set of coupled automata [19,20] (Fig 1). Each automaton represents the electrical activation state of a given myocardial tissue, covering the main electrophysiological activation periods: slow diastolic depolarisation (SDD), upstroke depolarization (UDP), absolute refrac-tory (ARP) and relative refracrefrac-tory (RRP). Briefly, the state of the cellular automata cycles through these four stages, sending an output stimulation signal to neighboring cells when a given cell is activated (end of UDP phase).
The whole simplified model consists of seven automata representing: the sinoatrial node (NSA), right and left atria (RA and LA), the atrioventricular node (NAV), upper bundle of His (UH) and both ventricles (RV and LV). The electrical activation of the automata is used to syn-thesize an electrocardiogram (ECG), from which the QRS peak was extracted to synchronize the experimental and simulated signals.
1.2.2 Elastance-based cardiac cavities. Although the literature offers a wide range of
car-diovascular models, elastance-based models offer a good compromise between complexity and
Table 1. Patients’ clinical characteristics.
Age
years old
Male sex
n (%)
BSA (body surface area)
NYHA class II/III,n
Patients (n = 12) 78.16± 5.50 7 (58.3%) 1.75± 0.10 8/4
number of parameters [16–18,23]. Ventricle pressures are represented by a combination of the end-systolic (es) and end-diastolic (ed) pressure-volume relationships [24]:
Pes;lvðV; tÞ ¼ Ees;lvðVðtÞ Vd;lvÞ; ð1Þ
Ped;lvðV; tÞ ¼ P0;lvðe
llvðVðtÞ V0;lvÞ 1Þ ð2Þ
InEq 1, systolic pressurePes,lvis defined as a linear relationship with the ventricular volume V, determined by the systolic elastance Ees,lvand the volume interceptVd,lv.Eq 2also describes
the nonlinear diastolic pressure defined by a gradientP0,lv, curvatureλlvand volume intercept V0,lv. The instantaneous pressure of the ventricle is then calculated as:
PlvðV; tÞ ¼ elvðtÞPes;lvðV; tÞ þ ð1 elvðtÞÞPed;lvðV; tÞ ð3Þ
whereelv(t) is the driver function that controls time-variant elastance. In this work we have
Fig 1. Left panel: State diagram of the cellular automata that represent nodal cells (yellow, botton) and myocardial
cells (orange, top) and diagrams showing the correspondence of the automata’s transition parameters with the myocardial action potential dynamics.Right panel: Closed-loop model of the cardiovascular system. E: elastance; R:
resistance; P: pressure; V: volume; pul: pulmonary; sys: systemic; pv: pulmonary vein; pa: pulmonary artery; ao: aorta; sa: systemic artery; sv: systemic veins; vc: vena cava; LA: left atrium; LV: left ventricle; RA: right atrium; RV: right ventricle. In the middle, a representation of the cardiac electrical system. On the right, a representation of the heart valve model.
https://doi.org/10.1371/journal.pone.0229609.g001
selected a “double Hill” driver function [25] that best fits our observed data: elvðtÞ ¼ k � t a1T � �n1 1 þ t a1T � �n1 2 6 4 3 7 5 � 1 1 þ t a2T � �n2 2 6 4 3 7 5 ð4Þ
The first and second terms inEq 4represent ventricle contraction and relaxation, respec-tively.k is a scaling factor that defines the maximal value of elastance, T is the heart period, α1,
α2are shape parameters, andn1,n2control the steepness of the curve.
To account for the mechanical function of the atria, the atrial pressurePlais represented as
a linear function of its instantaneous volumeVla, whose slopeElarepresents the elastic
proper-ties of the atrial wall:
PlaðVa;tÞ ¼ ElaðtÞ � ðVlaðtÞ Vd;laÞ; ð5Þ ElaðtÞ ¼ Ela;max elaðtÞ þ Ela;min Ela;max ! ð6Þ
whereela(t) is a Gaussian driving function that cycles between atrial diastole and systole: elaðtÞ ¼ expð Bla� ðt ClaÞ
2
Þ ð7Þ
UsingBlaandCla, it is possible to control the rise and peak of the atrial systole.
1.2.3 Systemic and pulmonary circulations. Concerning the circulatory models [21],
the volume change of each cardiac or vessel chamber is calculated from the net flow:
ΔV(t) =R(Qin− Qout)dt. The flows are defined by the pressure gradient across chambers and a
resistance:Q ¼DP=
R. The pressure of arterial and venous vessels are defined as an elastance
dependent linear relationship, similar toEq 1. The circulatory model allows for the simulation of systolic and diastolic aortic pressures (Pmodel
ao;sysandP model ao;dias).
1.2.4 Cardiac valves. The cardiovascular system (CVS) model was coupled to a detailed
representation of the heart valves dynamics (mitral, aortic, tricuspid and pulmonary) accord-ing to [22]. The relation between the pressure gradient (ΔP) and the fluid flow (Q) across an open valve is approximated by the Bernoulli equation (Eq 8):
DP ¼ BQjQj þ LdQ dt ; ð8Þ B ¼ r 2A2 eff ; L ¼rleff Aeff ð9Þ
whereB and L are respectively the Bernoulli resistance and the blood inertance. Parameter ρ
stands for the blood density,Aeffis the effective cross-sectional area of the valve (Eq 10) andleff
is the effective length of the valve:
AeffðtÞ ¼ ½Aeff ;maxðtÞ Aeff ;minðtÞ�xðtÞ þ Aeff ;minðtÞ ð10Þ
dx dt ¼ ( ð1 xÞKvoDP; if DP > 0 xKvcDP; if DP � 0 ð11Þ
Aeff,maxandAeff,minare the maximum and minimum effective areas. The rate of openingξ
(t) describes the dynamic of the valve position (Eq 11), in response toΔP. KvoandKvcare the
rate coefficients for valve opening and closure, respectively.
1.3 Estimation of myocardial work
Segmental myocardial work, as proposed by Russell et al [10], could be calculated from 1) the clinical strain signals, deduced from TTE, and 2) the LV pressure obtained invasively by cathe-terization (PexpLV) or the patient-specific pressure (PmodelLV ) from the model-based approach. The
instantaneous power was first obtained by multiplying the strain rate, obtained by differentiat-ing the strain curve, and the instantaneous LV pressure. Then, segmental myocardial work was calculated by integrating the power over time, during the cardiac cycle from mitral valve closure until mitral valve opening.
Positive and negative work [12] were determined as the ascending and descending parts of the curves (Fig 2), during isovolumic contraction and ejection (S phase) and isovolumic
relaxa-tion (IVR phase). Then, positive segmental work Wp(respectivelyWn) is defined as the sum of
positive (respectively negative) variations for each segmentk and for each phase (S and IVR): WS p;k¼ X i PS i;k; W S n;k ¼ X j NS j;k; ð12Þ WIVR p;k ¼ X i PIVR i;k ; W IVR n;k ¼ X j NIVR j;k ð13Þ
Fig 2. Calculation of positive and negative segmental work. Positive (Pj) and negative (Ni) work are marked
respectively as red and black. PhaseS corresponds to isovolumic contraction and ejection. IVR is the isovolumic
relaxation. S phase is defined by the time interval spanning from MVC to AVC, whereas the IVR phase is defined between AVC and MVO.
https://doi.org/10.1371/journal.pone.0229609.g002
wherePi(respectivelyNj) is the variation associated with each ascending (respectively
descending) partsi (respectively j) of the segmental work (Fig 2). The indicesi (respectively j)
are comprised between 1 and the total number of ascending (respectively descending) parts. Finally, global constructive (GCW) and wasted (GWW) work are defined as mean values over
all segments: GCW ¼1 k XK k¼1 ðWS p;kþW IVR n;kÞ; ð14Þ GWW ¼1 k XK k¼1 ðWS n;kþW IVR p;kÞ ð15Þ
whereK is the total number of segments. GCW represents segmental shortening during the
systole, i.e. effective energy for blood ejection, and lengthening duringIVR, whereas GWW
corresponds to segmental stretching during the systole, i.e. energy loss for blood ejection and shortening during the isovolumic relaxation phase. GWE is defined as the global work effi-ciency:
GWE ¼ GCW
GCW þ GWW ð16Þ
1.4 Model-based, patient-specific LV pressure estimation
1.4.1 Sensitivity analysis. The objective of the sensitivity analysis is to determine the sets
of ventricular {XLV} and circulatory {Xart} parameters that have the most important influence
on the gradient of pressure (DPmodel¼maxðPmodel
LV Þ P
model
ao;sys) between LV and aorta. Using the
Morris elementary effects method [26], the sensitivity of each parameter is estimated by repeated measurements of a simulation outputY with parameters X, while changing one
parameterXjat a time. The method consists in the generation of several random trajectories
through the parameter space; each trajectory being associated with an estimation of the Ele-mentary EffectsEE� j of a parameterXjon outputY: EE� j ¼ j YðX1; . . . ;Xj; . . .Þ YðX1; . . . ;Xjþ D; . . .Þ D j ð17Þ
whereΔ is a predefined variation. For each Xj, the mean m�j and standard deviationσjofr
ele-mentary effects (EEj) are calculated. A large value of m�j indicates a significant effect ofXionY,
whereas a largeσjvalue is related to either non-linear or strongly interacting variables. In
order to establish a global rank of importance among parameters, we calculated the Euclidean distanceDjin theμ�− σ plane, from the origin to each (m�j,σj) point:
Dj ¼ ffiffiffiffiffiffiffiffiffiffiffiffiffiffiffiffiffiffiffiffi ðm� jÞ 2 þ s2 j q ð18Þ
being parameters with high sensitivity or strong interactions those presenting the highest val-ues forDj. Analysis were performed withY = ΔPmodeland, for each parameterXj, the range of
possible values was defined as±30% of the initial values (S1 File).
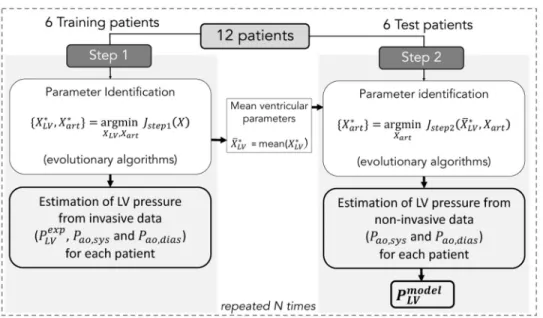
1.4.2 Parameter identification. The parameter identification process is included into a
Monte-Carlo cross-validation approach (Fig 3). For all patients, the maximum effective area
Aeff,maxparameter was fixed to the observed AVA, measured from TTE. Available data from
random selection process was appliedN times (n ⩽ N) and for each realization n a two-step
procedure was applied. The following sections provide more details on these steps.
Step 1: For each training patient, a parameter identification stage was implemented to find
the best set of parameters fX�
LV;X
�
artg that minimises the error function between simulation
outputs and experimental signals:
Jstep1¼JPLVþJPao;sysþJPao;dias ð19Þ
JPao,sys,JPao,diasandJPLVcould be defined as: JPao;sys¼jPao;sysexp P
model
ao;sysj; ð20Þ
JPao;dias¼jP exp
ao;dias Pmodelao;diasj; ð21Þ
JPLV ¼ 1 Tc XTc 1 te¼0 jPexpLVðteÞ P model LV ðteÞ j ð22Þ
wheretecorresponds to the time elapsed since the onset of the identification period andTcis
the duration of a cardiac cycle. The error functionJstep1was minimised using evolutionary
algorithms (EA). These stochastic search methods are founded on theories of natural evolu-tion, such as selecevolu-tion, crossover and mutation [27]. After this identification step, ventricular parameters were fixed equal to the average values over all the training patients (X�
LV= mean
(X�
LV)).
Step 2: For each test patient, only circulatory parameters {Xart} were identified by
minimis-ing the error function:
Jstep2¼JPao;sysþJPao;dias ð23Þ
Fig 3. Two steps of the identification process. Step 1 consists in the minimization ofJstep1for the identification of
{XLV, Xart} from invasive LV pressure and non-invasive arterial pressure. Step 2 consists in the minimization ofJstep2
for the identification of {Xart} from non-invasive arterial pressure. Finally,PmodelLV is estimated for each patient fromX � LV
andX� art.
https://doi.org/10.1371/journal.pone.0229609.g003
From the best set of parameters fX�
artg, LV pressureP model;i
LV was simulated for each test patient
and for each iterationi of the 2-step identification algorithm. Then, GCWmodel,iandGWWmodel,i
were calculated fromPmodel;iLV of each patient. Therefore, at the end of theN iterations, a set of i
simulated pressure and work indices was generated for each patient and averaged markers were determined:GCWmodel=GCWmodel;i,GCWmodel=GCWmodel;iandGWEmodel=GWEmodel;i.
1.5 Comparison between simulations and experimental data
1.5.1 Comparison of estimated and measured pressures. Inspired form [14], estimated
Pmodel
LV ,Pmodelao;sysandPmodelao;diaswere compared with measured pressures by calculating the total relative
error defined as:
e%¼ 50 kPexpLV PLVmodelk kPexpLV k � � þ 50 jP exp ao;sys P model ao;sys j jPao;sysexp j þjP exp
ao;dias Pmodelao;diasj
jPexpao;diasj
!
ð24Þ
where k.k stands for the vectorial 1-norm. A linear regression was performed on all the points from experimental and simulated pressure waveforms. The slope (β) and coefficient of deter-mination (R2) were deduced from the linear regression.
1.5.2 Comparison of estimated and measured work indices. In this paper,GCW, GWW,
andGWE were calculated in two different manners: 1) GCWexp,GWWexpandGWEexpusing the invasive experimental pressurePLVexp, and 2)GCW
model,GWWmodelandGWEmodelusing the
proposed patient-specific pressurePmodel
LV from the model-based approach. The goodness of
work estimations was evaluated by performing a linear regression using indices calculated from invasive experimental and the proposed model-based pressures. Bland-altman (BA) plots were also presented for the three work indices.
2 Results
2.1 Hemodynamic simulations
Fig 4illustrates the hemodynamic simulation results of the proposed computational model; the LV and aortic pressures in healthy and AS subjects. Concerning the healthy subject, sys-tolic LV pressure is equal to 120 mmHg, and the aortic pressure varies between 50 and 120 mmHg. AS was represented as a decrease in theAeff,maxparameter (from 2.5 to 0.75cm
2
). In
Fig 4, it is observed an important gradient pressure between LV (0-150 mmHg) and aorta (50-110 mmHg), characteristic of an AS, in which the narrowing of the aortic valve opening evokes an LV pressure overload.
2.2 Sensitivity analysis
Sensitivity results evaluated on the gradient of systolic pressure between LV and aorta (ΔPmodel),
are presented inFig 5, only showing those parameters having the highest sensitivities.Fig 5
shows the 25 most relevant parameters based on theirDjindex;μj�andσ are also represented.
The most influential parameter corresponds to the effective area of the aortic valve (Aeff,max). In
fact, a decrease of the effective area causes an increase in the ventricular systolic pressure, and consequently, on the gradient of systolic pressure between LV and aorta. Parameters related to the elastance of the LV (Ees,lvandα2) have also a high sensitivity on the gradient of systolic
pres-sures.Ees,lvcorresponds to the maximum LV elastance and is related to myocardial contractility. α2represents the shape parameter related to the LV relaxation phase.
Aeff,maxpresents the highest sensitivity. Fortunately, this parameter can be non-invasively
Fig 4. Example simulated LV and arterial pressure for a healthy (top) and an aortic stenosis subject (bottom).
https://doi.org/10.1371/journal.pone.0229609.g004
Fig 5. Most influential parameters on the gradient of systolic pressure between LV and aorta according to Morris sensitivity results. For each parameter, the distanceDi(green bars), the absolute meanμi�(purple bars) and the
standard deviationσ (yellow bars) of the elementary effects are represented.
https://doi.org/10.1371/journal.pone.0229609.g005
The ventricular and circulatory parameters with the highest sensitivities were selected for ventricular and circulatory parameter estimations: XLV= {Ees,lv,λlv,P0,lv,α1,α2,n1,n2} and
Xart= {Eao,Evc,Esa,Esv,Vdao,Vdvc,Vdsa,Vdsv,Rao,Rsys,Rvc}.
Except for {XLV, Xart}, model parameter values were selected from the publications from
which each model was originally based on: ventricular and circulatory parameters were taken from [16–18,23], heart valve parameters were adapted from [22], and cardiac electrical con-duction system from [19].
2.3 Patient-specific model-based pressure
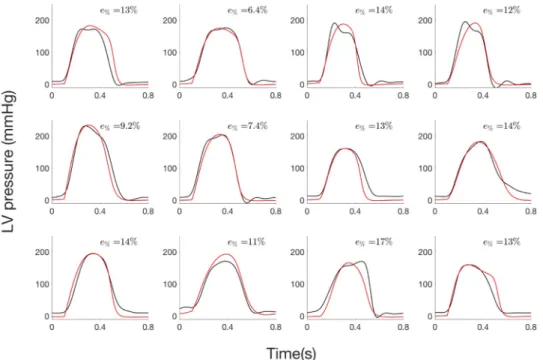
2.3.1 Step 1: Estimation of LV pressure from invasive data. Concerning step 1 of the
parameter identification, there was a good agreement between estimated and measured pres-sure waveforms (Fig 6). MeanR2
was equal to 0.96 (min: 0.91, max: 0.99). Mean slope and intercept of the regression line between the simulated and the measured pressure data were 1.04 (95% confidence interval: 1.0, 1.09) and -8.48 (-8.52, -8.44) mmHg respectively. Mean total relative error was equal to 11.9% and ranged from 6.4% to 17.3%.
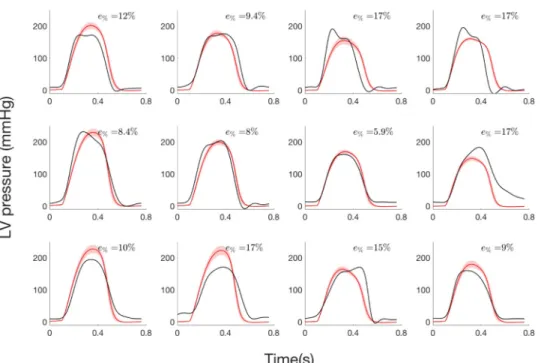
2.3.2 Step 2: Estimation of LV pressure from systolic and diastolic pressure values.
Concerning step 2 of the parameter identification, LV pressure waveforms (Fig 7) are only esti-mated from systolic and diastolic pressure values andAeff,maxhas been fixed to the AVA value
measured from TTE specifically to each patient. Slope and intercept of the regression line were 1.03 (0.92, 1.14) and—7.74 (-7.63, -7.85) mmHg respectively, and meanR2was 0.91. Total rela-tive error ranged between 5.9% and 17.40% and average value is 12.27%.
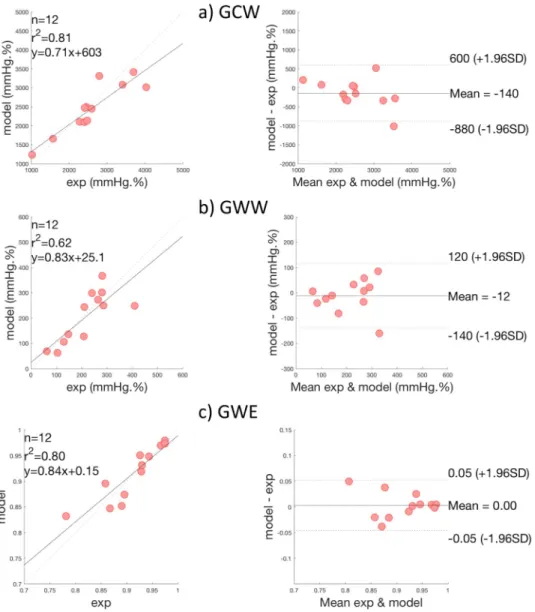
2.4 Comparison of global cardiac work indices
Fig 8presents scatter and BA plots for GCW, GWW and GWE indices. Correlations between measures and model-based estimations were respectively 0.88 (p < 0.0001) and 0.80
(p < 0.003) for GCW and GWW. When considering both constructive and wasted work
Fig 6. LV pressure of the 12 AS patients from step 1: i) experimental (black) and ii) simulated curve (red) curves.
indices, global correlation was equal to 0.96 (p < 0.0001). In BA analysis, mean bias were -140 mmHg.% and -12 mmHg.% respectively for GCW and GWW, which correspond to relative bias equal to 3.47% and 2.93% with respect to maximum GCW and GWW values. For global work efficiency, correlation was 0.91(p < 0.0001) and mean bias was equal to 0. For GWE, one patient is outside the 95% limits of agreement and corresponds to the third patient of the first row onFig 6and7. For this patient, the synchronisation, between peaks of simulated and experimental pressures, is less good, showing the importance of time corresponding to peak pressure for work evaluation.
3 Discussion
In this paper, a patient-specific model-based estimation method was proposed in order to eval-uate constructive, wasted myocardial work and global work efficiency on patients diagnosed with aortic stenosis. The main contributions of this study concern:i) the proposition of an
integrated model of cardiovascular system model,ii) the analysis of this cardiovascular model
in order to select the most sensitive parameters to be identified in a patient-specific manner,
iii) a parameter identification approach able to reproduce LV pressure specifically to each
patient andiv) the experimental validation of the proposed method through a cross-validation
technique applied on 12 AS patients, in order to quantitatively evaluate GCW, GWW and GWE indices.
The heart valve model, proposed by [22], was coupled to a CVS model that includes representations of cardiac electrical activity, cardiac cavities and the circulation, developed by our group [16–21]. The integrated model is able to predict the influence of valve motion on hemodynamics in both normal and stenosis cases. The sensitivity analysis, performed on the integrated model, highlights the importance of effective area of the aortic valve and param-eters related with LV elastance on the pressure gradient between LV and aorta. In fact,
Fig 7. LV pressure of the 12 AS patients from step 2: i) experimental curve (black), ii) average and standard deviation of simulated curve (red).
https://doi.org/10.1371/journal.pone.0229609.g007
modifications of valve effective area, observed in stenosis, lead to an increased aortic resistance and to an elevated pressure gradient across the valve [13]. When the blood flows through a narrowed aortic valve, the hemodynamic conditions could also lead to modifications of ven-tricular elastance [28].
The most influential LV and aortic parameters found after sensitivity analysis were then identified for each one of the 12 patients. One of the main originality of the approach was to apply a Monte-Carlo cross-validation approach for the patient-specific estimations of LV pres-sures. In order to build the cost function, experimental and simulated pressures were synchro-nised on QRS peaks of synthesized and experimental ECG. In the first step of the
identification process, model parameters were identified from invasive measured LV pres-sures, as well as systolic and diastolic arterial pressure values. Results show a good agreement between estimated and measured pressure waveforms. Concerning the second step of the identification, only systolic, diastolic arterial pressure values and AVA echocardiography
Fig 8. Results of global work indices comparison, on all patients. Scatter plots and Bland—Altman analysis of: a)
Global Constructive Work (GCW), b) Global Wasted Work (GWW) and c) Global Work Efficiency (GWE).
estimations were used to identify some model parameters and to estimate LV pressure wave-form. Although errors slightly increase compared to step 1, the approach has the advantage of using only non-invasive data for the estimation of LV pressure waveforms.
As shown in previous work of our team [12], although LV pressure is imprecise, the estima-tion of LV work could be accurate. In fact, even errors between model-based and measured pressures are around 12%, mean relative bias in BA analysis were 3.47%, 2.93% and 0.0% respectively for GCW, GWW and GWE. The consistency of LV work estimation could be explained by: i) the temporal integration, which induces a smoothing of the difference between measured and estimated works and ii) relative precision of the estimation of the pressure between AVO and AVC. Although the estimation of the LV pressure is imperfect, the non-invasive estimation of global myocardial work indices obtained from modelling approach strongly correlates with invasive measurements and the proposed estimation of LV myocardial work appears as clinically relevant.
Myocardial work indices are novel tools that have been validated in a variety of pathologies, including the response to cardiac resynchronization therapy (CRT) [29]. In particular, Russell et al. have shown that regional differences in myocardial work have a strong correlation with regional myocardial glucose metabolism, as evaluated using PET imaging [9]. However, the assessment of constructive and wasted work, in the case of AS is difficult because the estima-tion of peak LV pressure is complicated without any invasive measurement. To our knowl-edge, this paper presents the first method for the estimation of myocardial work, based on a physiological model, rather than a template-based estimate, such as in [9]. In this case, the model-based method allows for the integration of physiological knowledge in the evaluation of myocardial work indices.In silico assessment of clinical parameters, specifically to each
patient, has the advantage of taking into account characteristics associated with the subject and pathology. For instance, by integrating a representation of the pathophysiology of the aor-tic valves within this physiological model, it becomes adapted to the case of aoraor-tic stenosis.
Results show globally a good agreement between work index estimations from LV pressure obtained with patient-specific simulations and with experimental measurements. The evalua-tion of cardiac work, in the case of AS, is promising because it could be a simple and physio-logical alternative to more complex and costly investigations (cardiac MRI,‥) for the evaluation of myocardial contractility and residual myocardial viability [30]. The assessment of regional myocardial work might be particularly important for the prognosis of patients with severe asymptomatic AS without LV dysfunction. In fact, the timing and indications for surgi-cal intervention in this population remain controversial as the aortic-valve replacement is not recommended despite in the increased risk of cardiovascular mortality [31]. Indeed, as LVEF remains imperfect in asymptomatic AS to determine the optimal delay for the surgery, global longitudinal strain appears to have a better prognostic significance [32] and we can suppose that myocardial work will be a robust complementary index independent of afterload condi-tion. In fact, because afterload data are included in the calculation of myocardial work in the form of LV pressure, the assessment of myocardial work might represent a more robust parameter with respect to the assessment of LV strain or other strain-derived parameters [33]. Although it will be important to confirm these assumptions and to validate the approach in a cohort of AS patients, this paper is a first essential step for the proposition of work estimation based on computational modelling. The proposed methodology should be evaluated on a larger prospective clinical database in the future and we believe that model-based work indices, especially GWE, could be promising to improve the assessment of LV mechanical efficiency in AS.
One limitation of this work concerns the number of patients included in this study. Although it appears to be low, it is necessary to recognise that measurement of invasive LV
pressure is particularly difficult in AS. In fact, current guidelines discourage catheterization measurement techniques in AS before aortic valve replacement [34]. In this case, catheteriza-tion was realised for clinical reasons and all patients were informed. Another limitacatheteriza-tion is related to the estimation of LV filling pressure, which is not precisely estimated in step 2. In fact, myocardial work is considered in the period from mitral valve closure to mitral valve opening, so inaccuracies before mitral valve closure and after mitral valve opening has no impact on the results [12].
4 Conclusion
In this work, we propose an original model-based approach to assess constructive and wasted work in AS patients. The global method is based on a novel approach introducing:i) a
physio-logical model of the cardiovascular system, including heart valves andii) a 2-step identification
procedure, based on a monte-carlo cross-validation method. The proposed model-based approach was evaluated with data from 12 AS patients for which LV pressure data was acquired invasively. Results show a close match between experimental and simulated LV and aortic pressures. The model-based approach is especially efficient for the evaluation of LV pressure from non-invasive data (systolic, diastolic pressures and aortic valve area). Moreover, estimations of constructive, wasted work and global work efficiency were consistent with indi-ces calculated from measured experimental pressures, showing the model ability to produce realistic LV pressure for the calculation of work indices.
More extensive evaluations including a greater population of patients, as well as the analysis on a prospective study should be performed in the future. Furthermore, the proposed model could be enriched by including a regional description of myocardium [20]. Nevertheless, this paper presents the first model-based approach towards the evaluation of myocardial work indices in AS patients and, thus, provide a step forward the characterisation of the complex LV mechanics of patients with AS.
Supporting information
S1 Data. (XLSX) S2 Data. (XLSX) S1 File. (PDF)Author Contributions
Conceptualization: Arnaud Hubert, Elena Galli, Erwan Donal, Alfredo I. Herna´ndez, Virginie
Le Rolle.
Data curation: Kimi P. Owashi, Arnaud Hubert, Elena Galli, Virginie Le Rolle. Formal analysis: Kimi P. Owashi, Alfredo I. Herna´ndez, Virginie Le Rolle. Funding acquisition: Alfredo I. Herna´ndez, Virginie Le Rolle.
Investigation: Kimi P. Owashi, Arnaud Hubert, Erwan Donal, Alfredo I. Herna´ndez, Virginie
Le Rolle.
Project administration: Alfredo I. Herna´ndez, Virginie Le Rolle. Software: Kimi P. Owashi, Virginie Le Rolle.
Supervision: Erwan Donal, Alfredo I. Herna´ndez, Virginie Le Rolle.
Validation: Kimi P. Owashi, Arnaud Hubert, Elena Galli, Alfredo I. Herna´ndez, Virginie Le
Rolle.
Visualization: Kimi P. Owashi, Arnaud Hubert, Elena Galli, Alfredo I. Herna´ndez, Virginie
Le Rolle.
Writing – original draft: Kimi P. Owashi, Alfredo I. Herna´ndez, Virginie Le Rolle. Writing – review & editing: Kimi P. Owashi, Arnaud Hubert, Elena Galli, Erwan Donal,
Alfredo I. Herna´ndez, Virginie Le Rolle.
References
1. Rajappan K, Rimoldi O, Dutka D, Ariff B, Pennell D, Sheridan D, et al. Mechanisms of coronary microcir-culatory dysfunction in patients with aortic stenosis and angiographically normal coronary arteries. Cir-culation. 2002; 105:470–476.https://doi.org/10.1161/hc0402.102931PMID:11815430
2. Tzivoni D. Effect of transient ischaemia on left ventricular function and prognosis. Eur Heart J. 1993; 14: Suppl A:2–7.https://doi.org/10.1093/eurheartj/14.suppl_a.2PMID:8370357
3. Taniguchi T, Morimoto T, Shiomi H, et al. Prognostic Impact of Left Ventricular Ejection Fraction in Patients With Severe Aortic Stenosis. ACC Cardiovasc Interv. 2018; 11:145–157.https://doi.org/10. 1016/j.jcin.2017.08.036
4. Delgado V, Tops L, van Bommel R, van der Kley F, Marsan N, Klautz R, et al. Strain analysis in patients with severe aortic stenosis and preserved left ventricular ejection fraction undergoing surgical valve replacement. Eur Heart J. 2009; 30:3037–47.https://doi.org/10.1093/eurheartj/ehp351PMID: 19726436
5. Kearney L, Lu K, Ord M, Patel S, Profitis K, G M, et al. Global longitudinal strain is a strong independent predictor of all-cause mortality in patients with aortic stenosis. Eur Heart J Cardiovasc Imaging. 2012; 13:827–33.https://doi.org/10.1093/ehjci/jes115PMID:22736713
6. Hein S, Arnon E, Kostin S, Schonburg M, Elsasser A, Polyakova V, et al. Progression from compen-sated hypertrophy to failure in the pressure overloaded human heart: structural deterioration and com-pensatory mechanisms. Circulation. 2003; 107:984–91.https://doi.org/10.1161/01.cir.0000051865. 66123.b7PMID:12600911
7. Villari B, Vassalli G, Monrad E, Chiariello M, Turina M, Hess O. Normalization of diastolic dysfunction in aortic stenosis late after valve replacement. Eur Heart J Cardiovasc Imaging. 1995; 91:2353–8. 8. Klaeboe L, Haland T, Leren I, Ter Bekke R, Brekke P, Rosjo H, et al. Prognostic Value of Left
Ventricu-lar Deformation Parameters in Patients with Severe Aortic Stenosis: A Pilot Study of the Usefulness of Strain Echocardiography. J Am Soc Echocardiogr. 2017; 30(8):727–735.https://doi.org/10.1016/j. echo.2017.04.009PMID:28599826
9. Russell K, Eriksen M, Aaberge L, Wilhelmsen N, Skulstad H, Remme EW, et al. A novel clinical method for quantification of regional left ventricular pressure-strain loop area: a non-invasive index of myocar-dial work. European Heart Journal. 2012; 33:724–733.https://doi.org/10.1093/eurheartj/ehs016PMID: 22315346
10. Russell K, Eriksen M, Aaberge L, Wilhelmsen N, Skulstad H, Gjesdal O, et al. Assessment of wasted myocardial work: a novel method to quantify energy loss due to uncoordinated left ventricular contrac-tions. Am J Physiol Heart Circ Physiol. 2013; 305:H996–H1003.https://doi.org/10.1152/ajpheart. 00191.2013PMID:23893165
11. Donal E, Bergerot C, Thibault H, Ernande L, Loufoua J, Augeul L, et al. Influence of afterload on left ven-tricular radial and longitudinal systolic functions: a two-dimensional strain imaging study. Eur J Echocar-diogr. 2009; 10:914–921.https://doi.org/10.1093/ejechocard/jep095PMID:19666722
12. Hubert A, Le Rolle V, Leclercq C, Galli E, Samset E, Casset C, et al. Estimation of myocardial work from pressure-strain loops analysis: an experimental evaluation. Eur Heart J Cardiovasc Imaging. 2018. https://doi.org/10.1093/ehjci/jey024
13. Eleid FM, Sorajja P, Michelena IH, Malouf FJ, Scott GC, Pellikka PA. Flow-Gradient Patterns in Severe Aortic Stenosis with Preserved Ejection Fraction: Clinical Characteristics and Predictors of Survival.
Circulation. 2013; 128:1781–1789.https://doi.org/10.1161/CIRCULATIONAHA.113.003695PMID: 24048203
14. Garcia D, Barenbrug PJ, Pibarot P, Dekker AL, van der Veen FH, Maessen JG, et al. A ventricular-vas-cular coupling model in presence of aortic stenosis. Am J Physiol Heart Circ Physiol. 2005; 288(4): H1874–1884.https://doi.org/10.1152/ajpheart.00754.2004PMID:15604131
15. Koru¨rek M, Yildiz M, Yuksel A. Simulation of normal cardiovascular system and severe aortic stenosis using equivalent electronic model. Anadolu Kardiyol Derg. 2010; 10(6):471–478.https://doi.org/10. 5152/akd.2010.164PMID:21047728
16. Romero-Ugalde HM, Ojeda D, Rolle VL, Andreu D, Guiraud D, Bonnet JL, et al. Model-based design and experimental validation of control modules for neuromodulation devices. Biomedical Engineering, IEEE Transactions on. 2015; 63(7):1551–1558.https://doi.org/10.1109/TBME.2015.2498878 17. Calvo M, Le Rolle V, Romero D, Behar N, Gomis P, Mabo P, et al. Model-based analysis of the
auto-nomic response to head-up tilt testing in Brugada syndrome. Comput Biol Med. 2018; 103:82–92. https://doi.org/10.1016/j.compbiomed.2018.10.007PMID:30342270
18. Calvo M, Le Rolle V, Romero D, Behar N, Gomis P, Mabo P, et al. Recursive model identification for the analysis of the autonomic response to exercise testing in Brugada syndrome. Artif Intell Med. 2019; 97:98–104.https://doi.org/10.1016/j.artmed.2018.11.006PMID:30503015
19. Herna´ndez AI, Carrault G, Mora F, Bardou A. Model-based interpretation of cardiac beats by evolution-ary algorithms: signal and model interaction. Artificial Intelligence in Medicine. 2002; 26(3):211–235. https://doi.org/10.1016/s0933-3657(02)00078-7PMID:12446079
20. Le Rolle V, Hernàndez AI, Richard PY, Donal E, Carrault G. Model-Based Analysis of Myocardial Strain Data acquired by Tissue Doppler Imaging. Artificial Intelligence in Medicine. 2008; 44:201–19.https:// doi.org/10.1016/j.artmed.2008.06.001PMID:18722757
21. Ojeda D, Le Rolle V, Harmouche M, Drochon A, Corbineau H, Verhoye JP, et al. Sensitivity analysis and parameter estimation of a coronary circulation model for triple-vessel disease. IEEE Transactions on Biomedical Engineering. 2014; 61(4):1208–1219.https://doi.org/10.1109/TBME.2013.2296971 PMID:24658245
22. Mynard JP, Davidson MR, Penny DJ, Smolich JJ. A simple, versatile valve model for use in lumped parameter and one-dimensional cardiovascular models. Int J Numer Meth Biomed Engng. 2012; 28:626–641.https://doi.org/10.1002/cnm.1466
23. Smith BW, Chase JG, Nokes RI, Shaw GM, Wake G. Minimal haemodynamic system model including ventricular interaction and valve dynamics. Medical engineering & physics. 2004; 26(2):131–139. 24. Chung D, Niranjan S, Clark J, Bidani A, Johnston W, Zwischenberger J, et al. A dynamic model of
ven-tricular interaction and pericardial influence. American Journal of Physiology-Heart and Circulatory Physiology. 1997; 272(6):H2942–H2962.https://doi.org/10.1152/ajpheart.1997.272.6.H2942
25. Stergiopulos N, Meister JJ, Westerhof N. Determinants of stroke volume and systolic and diastolic aortic pressure. Am J Physiol. 1996; 270:H2050–H2059.https://doi.org/10.1152/ajpheart.1996.270.6.H2050 PMID:8764256
26. Morris MD. Factorial sampling plans for preliminary computational experiments. Technometrics. 1991; 33(2):161–174.https://doi.org/10.1080/00401706.1991.10484804
27. Goldberger AL, Peng CK, Lipsitz LA. What is physiologic complexity and how does it change with aging and disease? Neurobiology of aging. 2002; 23(1):23–26.https://doi.org/10.1016/s0197-4580(01) 00266-4PMID:11755014
28. Tanoue Y, Maeda T, Oda S, Baba H, Oishi Y, Tokunaga S, et al. Left ventricular performance in aortic valve replacement. Interact Cardiovasc Thorac Surg. 2009; 9(2):255–9.https://doi.org/10.1510/icvts. 2009.202309PMID:19443490
29. Galli E, Leclercq C, Hubert A, Bernard A, Smiseth O, Mabo P, et al. Role of myocardial constructive work in the identification of responders to CRT. Eur Heart J Cardiovasc Imaging. 2018; 19(9):1010– 1018.https://doi.org/10.1093/ehjci/jex191PMID:28954293
30. Galli E, Vitel E, Schnell F, Le Rolle V, Hubert A, Lederlin M, et al. Myocardial constructive work is impaired in hypertrophic cardiomyopathy and predicts left ventricular fibrosis. Echocardiography. 2019; 36(1):74–82.https://doi.org/10.1111/echo.14210PMID:30488501
31. Kang DH, Park SJ, Lee SA, Lee S, Kim DH, Kim HK, et al. Early Surgery or Conservative Care for Asymptomatic Aortic Stenosis. N Engl J Med. 2020; 382(2).https://doi.org/10.1056/NEJMoa1912846 PMID:31733181
32. Magne J, Cosyns B, Popescu B, Carstensen H, Dahl J, Desai M, et al. Distribution and Prognostic Sig-nificance of Left Ventricular Global Longitudinal Strain in Asymptomatic Significant Aortic Stenosis: An Individual Participant Data Meta-Analysis. JACC Cardiovasc Imaging. 2019; 12:84–92.https://doi.org/ 10.1016/j.jcmg.2018.11.005PMID:30621997
33. Galli E, Leclercq C, Fournet M, Hubert A, Bernard A, Smiseth OA, et al. Value of Myocardial Work Esti-mation in the Prediction of Response to Cardiac Resynchronization Therapy. J Am Soc Echocardiogr. 2018; 31(2):220–230.https://doi.org/10.1016/j.echo.2017.10.009PMID:29246513
34. Nishimura RA, Otto CM, Bonow RO, Carabello BA, Erwin JP, Guyton RA, et al. 2014 AHA/ACC guide-line for the management of patients with valvular heart disease: a report of the American College of Car-diology/American Heart Association Task Force on Practice Guidelines. J Thorac Cardiovasc Surg. 2014; 148(1):e1–e132.https://doi.org/10.1016/j.jtcvs.2014.05.014PMID:24939033