Publisher’s version / Version de l'éditeur:
Proceedings of the Gordon Research Conference on Laser Diagnostics in
Combustion, 1999, 1999
READ THESE TERMS AND CONDITIONS CAREFULLY BEFORE USING THIS WEBSITE. https://nrc-publications.canada.ca/eng/copyright
Vous avez des questions? Nous pouvons vous aider. Pour communiquer directement avec un auteur, consultez la première page de la revue dans laquelle son article a été publié afin de trouver ses coordonnées. Si vous n’arrivez pas à les repérer, communiquez avec nous à [email protected].
Questions? Contact the NRC Publications Archive team at
[email protected]. If you wish to email the authors directly, please see the first page of the publication for their contact information.
NRC Publications Archive
Archives des publications du CNRC
This publication could be one of several versions: author’s original, accepted manuscript or the publisher’s version. / La version de cette publication peut être l’une des suivantes : la version prépublication de l’auteur, la version acceptée du manuscrit ou la version de l’éditeur.
Access and use of this website and the material on it are subject to the Terms and Conditions set forth at
Improved soot volume fraction measurements with two-dimensional
imaging in laminar diffusion flames
Snelling, David; Thomson, K. A.; Smallwood, Gregory; Gulder, O. L.
https://publications-cnrc.canada.ca/fra/droits
L’accès à ce site Web et l’utilisation de son contenu sont assujettis aux conditions présentées dans le site
LISEZ CES CONDITIONS ATTENTIVEMENT AVANT D’UTILISER CE SITE WEB.
NRC Publications Record / Notice d'Archives des publications de CNRC:
https://nrc-publications.canada.ca/eng/view/object/?id=3167f5e1-652e-46ca-bc89-0faffd07f6de https://publications-cnrc.canada.ca/fra/voir/objet/?id=3167f5e1-652e-46ca-bc89-0faffd07f6de
ELSEVIER
Polymer Degradation and Stahrl~iy 57 (1997) 175-182 0 1997 Published by Elsevier Science Limited
Printed in Northern Ireland. All rights reserved zyxwvutsrqponmlkjihgfedcbaZYXWVUTSRQPONMLKJIHGFEDCBA PII: SOl41-3910(96)00183-8 0141.391O/Y7/$17.00 zyxwvutsrqponmlkjihgfedcbaZYXWVUTSRQPONMLKJIHGFEDCBA
Photo and thermal decomposition
of iPP
hydroperoxides
S, Commereuqn D. Vaillant,” J. L. Philippart,” J. Lacoste,” J. Lemaire” & D. J. Carlsson”
‘I Laboratoire de Photochimie Molkxdaire et Macromolekdaire, URA CNRS 433, Universitt Blake Pascal et ENS Chimie de Clermont-Ferrand, F-631 77 Aubiere, France
h Institute for Chemical Process and Environmental Technology, National Research Council Canada, Montrtal Road, Ottawa, Ontario, KlA 0R6, Canada
(Received 5 July 1996; revised 25 July 1996)
Products resulting from the photo and thermal decomposition under vacuum of a pre-oxidized isotactic polypropylene (iPP) containing a known content of hydroperoxide have been examined. In contrast to the case of polyethylene, few products were retained in the polymer matrix. Detailed analysis of the gas phase was performed by gas chromatography, Fourier transform infra-red spectroscopy and mass spectrometry. It was revealed that about 70% of the hydroperoxides were converted into gaseous products such as acetone, acetic acid and methanol. Mechanisms for their formation are suggested, and the consequences of such a phenomenon for the evaluation of ageing in PP are discussed. 0 1997 Published by Elsevier Science Limited
1 INTRODUCTION
Hydroperoxides are well known to be crucial products of the free radical oxidation of most polymers.‘.’ They are successively formed and then decomposed during the photo and thermal ageing of polyolefins, and their detection (by means such as iodometry” and NO titration4,‘) measures only a part of the total content involved during the course of the oxidation.
In the case of polyethylene only secondary hydroperoxides are present and we have shown6 by performing photo and thermal degradation and y-irradiation under vacuum of a pre-oxidized polyethylene, that they are decomposed mainly into macromolecular ketones, alcohols and acids. Most of these products remained in the polymer matrix and a good balance was observed between the hydroperoxide loss and the alcohol and carbonyl compounds formed.
The situation is expected to be more complex in the case of polypropylene as we know that the resulting hydroperoxides are predominantly tertiary ( - 90%) the remainder being essentially secondary ones.’ The scissions of these tertiary hydroperoxides lead directly to backbone scis-
sions, giving a complex mixture of low-molecular- weight compounds.8 We reported recently on the nature and the contribution of most of these products by studying the photo, thermal and y- initiated oxidation of isotactic polypropylene (IPP).‘.‘)
The aim of this paper is to report reults of a study on the thermal (90°C) and photo (A 2 300 nm, 35°C and 60°C) decomposition of iPP hydroperoxides under vacuum. IPP hydroper- oxides were generated by pre-oxidation of iPP either with UV or y-radiation. Breakdown products were characterized both in the polymer matrix [by means of Fourier transform infra-red spectroscopy (FTIR) and derivatization reac- tions] and in the gas phase [by using gas chromatography (GC) and mass spectrometry
&WI.
2 EXPERIMENTAL
Isotactic polypropylene (Hoechst France, zyxwvutsrqponmlkjihgfedcbaZYXWVUTSRQPONMLKJIHGFEDCBA MFI= 2-3 g/10 min. containing 120 ppm of
IRGANOX 1010 (Ciba-Geigy) as processing stabilizer) films (cu. 100 pm thick) were obtained
176 S. Commereuc et al.
- zyxwvutsrqponmlkjihgfedcbaZYXWVUTSRQPONMLKJIHGFEDCBAMS /
A V / AC
Fig. 1. Mass spectrometric analysis of volatile photoproducts derived from the photolysis of pre-oxidized PP. AC, analysis chamber; MS, mass spectrometer; TP, turbomolecular pump; RP, roughing pump; V, variable leak valve; G, ionization jauge; A, glass adapter, T, Torion@ stopcock; S, sample; C.
borosilicate tube.
by pressing pellets between two polyester sheets at 180°C for 3 min. Some of these films were pre- oxidized by UV irradiation in a SEPAP 12-24
chamber”’ (A > 300 nm, zyxwvutsrqponmlkjihgfedcbaZYXWVUTSRQPONMLKJIHGFEDCBAT = 60°C exposure time =90 h). These conditions correspond to a
compromise to obtain a polymer film which keeps its cohesion for subsequent analysis and which contains a sufficient amount of hydroperoxide (cu. 90 mmol kg-‘). A few experiments were also performed with polypropylene films (25-30 ,um, unoriented homopolymer Himont Profax) pre- oxidized by y-oxidation (10 Mrad in an AECL Gammacell 220).
The phenolic processing antioxidant present in the polymers was destroyed by exposure for 1.5 h in the SEPAP unit or extracted with acetone (48 h, Soxhlet apparatus). Pre-oxidized films were first sealed off under vacuum (lo-” mmHg) in borosilicate tubes and then exposed to the radiation of photoageing devices at 35 and 60°C (photolysis)? or at 90°C in an oven ventilated by natural convection (thermolysis).
For analysis of volatiles the borosilicate tubes were isolated from the vacuum by a Torion@ stopcock and then connected to a mass spectro- meter (see Fig. 1). Details of this analytical technique have been recently reported.12 In another experiment, the volatile decomposition products were trapped directly in methylene chloride (cu. 3 cm -‘) placed in a side arm but protected from UV irradiation by a black mask. The methylene chloride solution was then either (1) injected into a gas chromatograph (DELSI DI t Low temperature photolyses (T s 35°C) were performed in a similar unit equipped with one mercury lamp only in order to facilitate temperature control.”
700) equipped with a capillary column (model Supelco PTE 5) and a flame ionization detector or (2) analysed by FTIR spectroscopy. CC peaks were compared with the retention times of pure compounds for identification.
In order to elucidate photolytic mechanisms, another series of experiments was performed. Cumyl hydroperoxide (Aldrich) was introduced into a poly(viny1 methyl ketone) (Scientific Polymer Products) film via a methanol solution and photolysed at A 2 300 nm. The gas phase was later analysed by mass spectrometry.
Products present in the pre-oxidized film and in the film subsequently exposed under vacuum to heat or light were identified by FTIR spectro- scopy (Nicolet 5SX and 20SX) with the aid of selective derivatization reactions.’ Treatment with nitric oxide (NO) was used to follow both the loss of hydroperoxide (from the nitrate band at 1280-1300 cm-‘) and the formation of alcohols (from the nitrite band at 760 cm--‘). The loss of hydroperoxide was also followed by iodometric titration according a procedure described elsewere.’
3 RESULTS
The decomposition of iPP hydroperoxides by UV or heat can be followed directly by iodometric titration. It can be seen in Fig. 2 that exposure for 15-20 h in the SEPAP unit at 60°C is sufficient to destroy most (ca. 90%) of the hydroperoxide groups. Very similar kinetics were found upon thermolysis at 90°C. It is worth noting that hydroperoxide decomposition was only detected
y” t ‘Y ‘\ \ \ \ \ .i \ ‘\ *. ‘..+ -- --I --___ I- I I I I 0 5 I 0 IS 20 UV exposure (hr)
Fig. 2. Hydroperoxide loss upon photolysis of pre-oxidized PP film (iodometric titration).
Photo and thermal decomposition of iPP hy droperoxides 177
after thermolysis at 60°C or above, proving that the decomposition seen in Fig. 2 is really a photodecomposition.
The nature of the products resulting from hydroperoxide decomposition can be revealed by FTIR spectroscopy. The direct spectral changes of pre-oxidized iPP films after and before irradia- tions are reported in Fig. 3 for both photolysis at 60°C and thermolysis at 90°C. From the IR changes in Fig. 3, the following points can be made.
1. A clean but not complete decrease is observed in the hydroxyl region, proving that all the hydroperoxides (mainly associated) are not fully converted into alcohols because both absorption bands (frequency and absorption coefficient) are very similar. If we assume that 90% of hydroperoxides are destroyed (see Fig. 2) the residual hydroxyl band is consistent
with a conversion of only 10% into alcohols (if zyxwvutsrqponmlkjihgfedcbaZYXWVUTSRQPONMLKJIHGFEDCBA
EROOH = EROH = 90 mol PI 1 cm -‘). This can be
confirmed by NO treatment (see Fig. 4); the
(Al)
2.
0.6
strong decrease of nitrate band (derived from hydroperoxide) at 861 and 1290 cm-’ contrasts with the small increase of the nitrite band (derived from alcohol) at 760 cm-‘. By the use of conventional absorption coefficients,’ the conversion of hydroperoxide into alcohols again represents only 8-10%. This figure was previously suggested by Carlsson et ~1.‘~ based on kinetic considerations.
Surprisingly, no increase in the carbonyl band is observed in the 1500-1900 cm-’ region after either photolysis or thermolysis; on the contrary, a slight decrease is revealed at 1702 and 1750 cm-‘. It is recalled that the same kind of experiment in the case of linear low- density polyethylene (LLDPE)” resulted in a large increase in the carbonyl region, corre- sponding to about 70% of the initial hydro- peroxide content, compared with carbonyl species. That means that most of the hydro- peroxides present in photooxidized PP are decomposed into compounds that are volatile under our experimental conditions (irradiation
3800 0.6 - 3600 3400 3200 3000 3800 3600 3400 3200 3000 Wavenumber (cm-‘) Wavenumber (cm-‘) (A21 (B2) 0.6 - I 0.2 I zyxwvutsrqponmlkjihgfedcbaZYXWVUTSRQPONMLKJIHGFEDCBAI I I 1900 1800 1700 1600 1500 1900 1800 1700 1600 1500
Wavenumber (cm-‘) Wavenumber (cm-‘) zyxwvutsrqponmlkjihgfedcbaZYXWVUTSRQPONMLKJIHGFEDCBA
Fig. 3. IR changes upon (A) photolysis (A >300 nm, 6O”C, 20 h) and (B) thermolysis (9O”C, 20 h): (a) pre-oxidized PP before reaction; (b) after photolysis or thermolysis under vacuum.
178 S. zyxwvutsrqponmlkjihgfedcbaZYXWVUTSRQPONMLKJIHGFEDCBACommereuc et al.
I I I I I I
I100 I200 II00 Inno 900 x00 700
Wavenumber (cm-‘)
Fig. 4. IR changes after NO treatment following the photolysis at 35°C of pre-oxidized PP. Difference spectra of pre-oxidized film subtracted from that of the pre-oxidized
film after photolysis.
under vacuum at 60 and 9O’C) and cannot be retained in the polymer matrix.
Similar results were obtained by using a Y-pre- oxidized polypropylene.The photolysis experi- ment was repeated by decreasing the temperature from 60 to 35°C. The IR changes after 3 h exposure (corresponding to a 50% hydro- peroxides loss) are reported in Fig. 5. It is now possible to observe the formation of carbonyl compounds [absorbing at 1720. 1731 (shoulder) and 1774 cm-‘] resulting from the photo- decomposition of PP hydroperoxides. However, their content is much less than that expected from the total conversion of hydroperoxides.In summary, the FTIR and iodometry measurements indicate that photolysis and thermolysis of iPP hydroperoxides result in the formation of alco- hols (cu. S--10%) and low levels of carbonyl
0.02 ,
I900 I850 I ROO 1750 1700 I650 I600 I550 I SOl1
Wavenumber (cm-‘)
Fig. 5. Spectral increase in the carbonyl region after photolysis at 35°C (difference spectrum: spectrum after
photolysis minus spectrum before photolysis).
compounds which can only be retained in the polymer matrix by performing photolysis at a moderate temperature (35°C). Consequently, most of the photolysis and thermolysis products must be present in the gas phase.
3.1 Gas phase zyxwvutsrqponmlkjihgfedcbaZYXWVUTSRQPONMLKJIHGFEDCBAanalysis by CH,Cl, trapping
Volatile photoproducts were trapped in methylene chloride (-3 cm-‘). Both the GC chromatogram and FTIR spectra are shown in Fig. 6. They are consistent with the presence of acetone, acetic acid and methanol.
3.2 Gas phase analysis by mass spectrometry
The gas phase resulting from photolysis (h 2 300 nm, 35°C) was injected into a mass spectrometer (M < 200 g mall’) and the products were identified by typical peaks (parent and daughter peaks). Acetone (mle=58), acetic acid (m/e = 60) and methanol (daughter peak. mle=31) were clearly identified while other products such as H20. CO and CO?. which are also present (detected by FTIR in the gas cell), could not be separated by this technique.
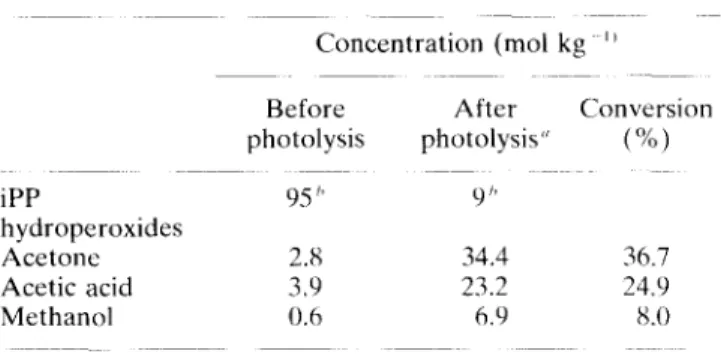
We then focused our attention on the quantita- tive analysis of acetone, acetic acid and methanol, and its correlation with the hydroperoxide loss. A calibration of the instrument was first performed by injecting known concentrations of each component. The best correlation (peak area versus concentration) was obtained by heating the borosilicate tube (from 20 to SOY?) to ensure that all components (especially acetic acid) were introduced into the mass spectrometer. The same procedure was applied to the gas phase resulting from the photolysis; it gave the results shown in Table 1 for hydroperoxide levels before and after photolysis.
However, this procedure also quantifies com- ponents initially present (adsorbed) in the starting, pre-oxidized iPP film. These amounts can be evaluated by performing the analysis after a short heating time (few min) under vacuum, a time too short to involve a significant hydro- peroxide thermolysis. The values are reported in Table 1.
From Table 1, it can be seen that about 70% of the PP hydroperoxides are converted into volatile products such as acetone, acetic acid and methanol. The residual 30% can be attributed to other volatile compounds (CO, CO,. etc.) and/or
Photo and thermal decomposition of iPP hy droperoxides 179
to higher molecular weight compounds remaining 4 DISCUSSION AND CONCLUSION in the polymer matrix but not absorbing in the
carbonyl region of the IR spectra (such as The contrasting behaviour of pre-oxidized PE macromolecular alcohols. ethers, peroxides, etc.). and PP exposed to photolysis or thermolysis is
(4 I I 0 zyxwvutsrqponmlkjihgfedcbaZYXWVUTSRQPONMLKJIHGFEDCBA4 I 8 I 1 2 I 1 6 I I I I I 2 0 2 4 2 8 3 2 3 6 zyxwvutsrqponmlkjihgfedcbaZYXWVUTSRQPONMLKJIHGFEDCBA Minutes
k9
1850 1800 1 1 5 0 1 1 0 0 1650 1600 1550 1500 Wavenumber (cm-‘)Fig. 6. Gas phase analysis after vacuum photolysis of pre-oxidized PP ( conditions: 15 h, 35°C). (A) GC chromatogram and (B) IR spectrum of a methylene dichloride solution.
180 S. Commereuc et al. zyxwvutsrqponmlkjihgfedcbaZYXWVUTSRQPONMLKJIHGFEDCBA
Table 1. Quantitative analysis of gas-phase products and correlation with hydroperoxide loss
Concentration (mol kg ”
Before After Conversion
photolysis photolysis” (X) iPP 95 ” 9” hydroperoxides Acetone 2.8 34.4 36.7 Acetic acid 3.9 23.2 24.9 Methanol 0.6 6.9 8.0 “Irradiation conditions: IS h at 35°C. “Determined by iodometry.
probably due to structural differences between the hydroperoxides. In oxidized PE secondary hydroperoxides prevail, and their decomposition leads to in-chain ketones and alcohols and chain- end carboxylic acids. In the case of photolysis, chain scissions of ketones by Norrish reactions also occur but they can be minimized by using a short exposure time (just sufficient to photolyse the hydroperoxide).6,” As a result. most of the decomposition products are retained in the polymer matrix.
Conversely, in oxidized PP, there are tertiary hydroperoxides which are probably associated in sequences deriving from a back-biting process [reaction (l)]:“.“~‘” 7H3 7’3 CH3 CH3 “y-CH2-y + m&CH,-L- O-0. H &OH ’ d 02 +.~LcH,-&CH,--~ CH3 CH3 CH3 (1) &-OH &O* ii
Their decomposition results in a p-scission (following the O-O bond scission) which, accord- ing Mayo and co-workers,” leads preferentially to methyl (chain-end) ketones [reaction (2)]:
743 7’ ‘3 wCHZ-C-CH2m -a &OH +2HZ---CHZ~ 0. mCH2- C; CH3 / 0 + ’ CH2w (2) p zyxwvutsrqponmlkjihgfedcbaZYXWVUTSRQPONMLKJIHGFEDCBA-scission \ 4H2---CHy + CH3’ (3) 0
This was confirmed recently by “C NMR analysis of an oxidized polypropylene.”
4.1 Origin of acetone
If we consider the presence of 1. 3, 5. . . . tertiary hydroperoxide groups,? the primary radical resulting form reaction (2) will be adjacent to another hydroperoxide group and can lead to the formation of acetone after a second p-scission of the resulting 1~ I-dimethyl hydroperoxide [reac- tion (4)]: (73 PH P’ 743 * cHZ-y-cHy- s CH3---cH2m O-OH O-OH y3 /’ CH3- y-CH2* c P. PH O-O’ b-sc’ss’o; cH,-_C:CH3 + ’ CH,* ._. (4)
The same kind of reaction can occur on the methyl ketone moities formed in reaction (2) [reaction (5)]: 73 0 4H,--y-CH,-CT jj-scission, _CH2_c,CH3 O-OH CH3 ‘b + ‘CH2-C--H3 8 ) CH,-C-CH, (5) PH P’
Thus acetone can be formed by p-scissions occurring on adjacent hydroperoxide sequences, which can explain the large quantities of acetone detected by mass spectrometry.
Acetone can also be derived from a Norrish 11 process on chain-end ketones of PP:‘”
73 0 N II wCH,-Cl+CH2-Cz - CH3 CH3-C-CH3 + ~Cl-kCH-CH3 & (6) + *CH2-CH=CH2
Photo and thermal decomposition of iPP hy droperoxides 181
However, as suggested before, Norrish reactions can be considered as minor reactions in our experimental conditions. In support of this, vinyl and vinylene groups were not detected by FTIR spectroscopy on our vacuum-photolysed samples.
4.2 zyxwvutsrqponmlkjihgfedcbaZYXWVUTSRQPONMLKJIHGFEDCBAOrigin of acetic acid The formation of carboxylic acids in the absence
of oxygen must result from the recombinations of functional groups containing oxygen. In the case of hydroperoxidized PE, a mechanism involving abstraction of the labile hydrogen atom of a secondary hydroperoxide followed by a p- scission has been suggested?
7
.
*C-CH2# 60H - -CC-CH2* radical &-OH attack PE-OOH p-scission ti 4:: 0 + l Cb-(7)
OHHowever, such a mechanism cannot occur in the case of tertiary hydroperoxide groups.
Another possibility is the action of ‘OH radical on the carbonyl double bond of a ketone as suggested by Geuskens and Kabamba:”
R,
C==O R’
+
‘OH -
-cf
0+
R’ (8)OH
This reaction did not occur when we performed photolysis of a low-molecular-weight ketone/se- condary hydroperoxide mixture.‘* However, the situation may be different in the case of tertiary hydroperoxide where ‘OH radicals may react outside the cage. Acetic acid can then be produced from attack on methyl ketones:
-co ‘OH CH3 - Cl- l,- _Cz 0 + w uw * (9) OH
-co
+ CH3’ OH (IO>The existence of such a mechanism has been confirmed by a complementary experiment based on the brief photolysis of cumyl hydroperoxide (a tertiary hydroperoxide acting as a donor of ‘OH radicals) adsorbed in a poly(viny1 methyl ketone)
film (acting as a macromolecular methyl ketone). Acetic acid was effectively detected in the gas phase together with photolytic products of both cumyl hydroperoxide and poly(viny1 methyl ketone):23
h > 300 nm
* CH,-co + . . . (11) ‘OH
Moreover, no acetic acid was detected when the experiment was repeated in the presence of only one of the components.
4.3 Origin of other compounds
According Carlsson and Wiles,13 most of the ‘OH radicals coming from the O-O bond scissions of hydroperoxides are converted into water by hydrogen abstraction. However, the high reac- tivity of the ‘OH radical present in close proximity to other radicals can also explain the formation of minor products by radical annihila- tion: for example, methanol (detected in this work) or acetol:13 PH + ‘OH - H20 + P’ CH3’ + ‘OH - CH30H CH3-C:’ + ‘OH - zyxwvutsrqponmlkjihgfedcbaZYXWVUTSRQPONMLKJIHGFEDCBA 0 CH; CH,-C:: CH,OH
In conclusion, vacuum decomposition (thermal or photolytic) of the hydroperoxides present in PP results, to a large extent, in the formation of gaseous products such as acetone and acetic acid. Only low levels of macromolecular alcohols can be detected by FTIR as new products present in the polymer matrix. This can be explained by the presence of 1, 3, 5,... hydroperoxide sequences whose decomposition results in a number of scissions. Consequently these chain scissions would not be statistically distributed in the polymer chain (as may be the case for poly- ethylene) but rather localized in highly oxidized domains.
182 S. Commereuc et zyxwvutsrqponmlkjihgfedcbaZYXWVUTSRQPONMLKJIHGFEDCBAal. These results raise at least two important
questions: (1) What is the contribution of these reactions to the oxidation process? and (2) What is the best way to follow the oxidation of PP?
Concerning the first point, the decomposition mechanism of polypropylene hydroperoxide under vacuum may well be slightly different from that of oxidation in air since the polymer has a low oxygen permeability and a low dissolved oxygen content.‘” However, under vacuum we can expect that more alkyl radicals may be formed? than under oxygen, where they arc rapidly converted into peroxy radicals. In addi- tion, the contribution of volatile products may be slightly overestimated in our case since the experiments were performed under vacuum. Moreover, similar products were recently detected during the photooxidation of polypropylene.”
Concerning the second point, polypropylene oxidation can indeed be followed experimentally by the oxygen consumption, or by the analysis of low-molecular-weight compounds migrating out of the matrix or functional oxidized groups still bound to the macromolecular chains. However, these methods give different, but complementary. information.
Oxygen consumption gives the best quantita- tive indication of the oxidation level: however. this macroscopic evaluation does not afford any indication of the conversion of molecular oxygen into the various oxidized groups and does not necessarily correlate with the variation of physical properties. The analysis of low- molecular-weight compounds, with the exception of CO,. CO and H,O, gives information about the relative importance and the fate of highly oxidized segments. The accumulation of the functional groups bounds to the matrix. and especially the inert functional groups resulting from a chain scission and usually observed by FTIR spectroscopy (like acidic groups), can be
t For example. by hydrogen abstraction by ‘OH and RO’ radicals.
correlated with the variations of macroscopic physical properties and with the lifetime of the
material under different conditions.“’ zyxwvutsrqponmlkjihgfedcbaZYXWVUTSRQPONMLKJIHGFEDCBA
REFERENCES
I Amin. M. U.. Scott, G. and Tillikerainc. 1,. M. K.. Errr:
Polvn1. .I. 1975. 11. x5
Gr&sie. N. and Scott, G., Polymer Degradation mti
Stabilization. Cambridge University Press. Cambridge.
19X5. 2. 3. 4. 5. 6. 7. 8. Y. IO. Il. 12. 13. 14. 1s. 16. 17. IX. IY. 20. 21. 22. 23. 24.
Mair. R. D. and Graupner. A. J.. Arzn&. Chcrn. lY64, 36. 194
Carlsson. D. J., Brousseau. R., Zhang. C. and Wiles. D.
M., Polynz. Degrad. Stab. 1987. 17, 303
Carlsson. D. J.. Brousseau, R.. Zhang. C. and Wiles. D.
M.. ACS S’ymp. Ser. 1988, 364. 376
Lacoste, J.. Carlsson, D. J.. Falicki. S. and Wiles. D. M..
Polyn7. Dqfycui. Stab. 1 Y91. 34, 309
Lacoste. J.. Vaillant, D. and Carlsson. D. J.. ./. I’o!,,r,~. Sc,i.
A, PO/W. ~‘hU??. 1993, 31. 71s
C’arlsson. D. J. and Wiles. D. M., J. Macrond. Sci.. Rev.
Mocrorwl. C’her~. 1976. C14. 65
Vaillant. D.. Lacoste. J. and Dauphin, G.. Polynl. Drgrd. Sttrh. lYY4. 45. 155
Penot. G.. Arnaud. R. and Lemairc. J.. Angnr:.
Mrrkronzol. Chenz. 1983, 117, 7 I
Adam. C.. Lacoste, J. and Lemaire. J.. Polyrr~. zyxwvutsrqponmlkjihgfedcbaZYXWVUTSRQPONMLKJIHGFEDCBADcgrrrtl. Strrh. lY91. 32. 51
Philippart. J. jr L, Posada. F. and Gardette. J. L.. Po/ynr.
L)qrrrd. Stab. 1995. 49, 285
Carlsson, D. J. and Wiles, D. M.. Macrcrnlo1wuie.s 1969. 2. 5Y7
Teissedre, G.. Pilichowski. J. F.. Commereuc. S. and Lacoste. J.. Pdyn~. Degrad. Stab. 1996. 51, 14.1
Chien. J. C. W, and Boss. C. R., _I. Pdyn. Sci. A-l 1967. 5. 3OY I
(‘hien. J. C. W. and Boss. C. R.. ./. I’ol~~rr~. 5i. /I-/ 1968. 6. 3X1
Carlsson. D. J.. Brousseau. R. and Wiles. D. M.. t’olw 7.
Dqyarl. Stab. 1986. 15, 67
Tatarenko, L. A. and Pudov. V. B.. V~sokomol Soerlin B
1968. 10, 2X7
Mill. T.. Richardson, H. and Mayo. F. R.. ./. /‘14w 7. Sci.,
I’01yn1. Cl1ern. Edn 1973. 11. 2899
Carlsson. D. J. and Wiles. D. M., MncroMlo/cc,lllrs I Y6Y, 2. 5x7
Geuskcns, G. and Kabamba, M. S.. Po/vrrr. Dcgrtrrl. Strrh.
1982. 4. 6Y
Teisscdre. G., Pilichowski. J. E and Lacoste, J.. Po/ym. Degrrrtl. Stab. lYY4. 45. 145
Walling. C‘. and Gihian. M. J.. J. An,. C‘hcnl. Sock. IY65. 87. 15 3413
Lemaire. J.. Gardette. J. L. , Lacostc. J.. Delprat. P. and Vaillant. D.. Adv. Chen7. Ser. IY95. 249. 576