1
Supporting Information
Supporting Figure Legends
Figure S1. Crossing scheme for isolating isochromosomal 3R lines. Wild-type males were
crossed to females of a double balancer stock (SMB6; TM6B), marked with a dominant tubby (Tb1) and a recessive ebony (e1) mutation. F1 pupae exhibiting Tb were selected and
backcrossed to the balancer. In the next generation, pupae showing Tb but not the ebony phenotype were selected and allowed to interbreed. Finally, wild-type pupae were selected to clear the balancer chromosome, resulting in isochromosomal 3R homokaryon isolates. See Materials and Methods section for further details.
Figure S2. Details of wing morphology. Designations and locations of wing cells in red (A:
Anal cell, Al: Alula, Ax: Axillary cell, B1: Basal cell 1, B2: Basal cell 2, C: Costal cell, D: Distal cell, M: marginal cell, 1P: 1st posterior cell, 2P: 2nd posterior cell, 3P: 3rd posterior cell, S: Submarginal cell) and wing veins in white (a-cv: Anterior cross-vein, L1: Vein L1, L2: Radial vein, L3: Medial vein, L4: Cubital vein, L5: Distal vein, L6: Vein L6, p-cv: Posterior cross-vein), following the nomenclature of Chyb & Gompel (2013). Blue arrows indicate landmarks used for fitting spline functions with Wings4. See Materials and Methods section for further details.
Figure S3. Effects of In(3R)P on allometry. Size ratios of femur/tibia, femur/wing and
wing/tibia, averaged across line means for the groups differing in In(3R)P karyotype: “Florida inverted” (FI), “Florida standard” (FS) and “Maine standard” (MS). Error bars show standard errors. Letters above bars indicate differences according to Tukey HSD post-hoc tests, carried out for each sex separately: groups not containing the same letters are significantly different (p<0.05). See Materials and Methods and Results section for further details.
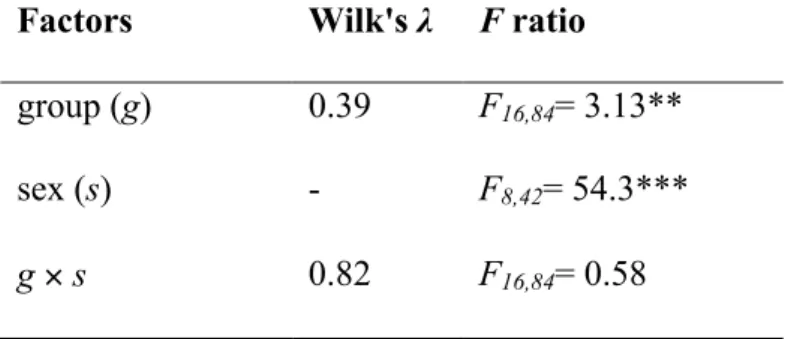
Table S1. MANOVA of multivariate phenotype based on line averages of all measured traits
(except wing shape and size ratios). Contrasts between the three groups (FI versus FS; FI versus MS; FS versus MS) revealed significant differences, indicating that both karyotype and geography have an effect on multivariate phenotype. ** p < 0.01; *** p < 0.001.
Factors Wilk's λ F ratio
group (g) 0.39 F16,84= 3.13**
sex (s) - F8,42= 54.3***
3
Table S2. Cohen’s standardized effect sizes d for the differential effects of the two In(3R)P
karyotypes (inverted versus standard arrangement) on wing size for Queensland (Australia; data from Rako et al., 2006) and Florida (our study), calculated based on line means and standard deviations. See the Materials and Methods and Results sections for further details.
Australia Mean SD
Queensland inverted 2.72 0.03
Queensland standard 2.77 0.02
Cohen's d 1.65
North America Mean SD
Florida inverted (FI) 1.71 0.06
Florida standard (FS) 1.82 0.06
Cohen's d 1.74
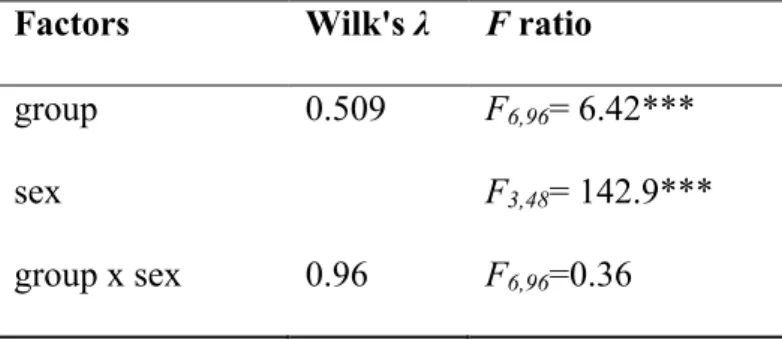
Table S3. MANOVA of multivariate size phenotype (i.e., a linear combination of wing area,
femur length and tibia length). Contrasts between the three groups (FI versus FS; FI versus MS; FS versus MS) revealed significant differences, indicating that both karyotype and geography have an effect on multivariate wing shape phenotype. *** p < 0.001.
Factors Wilk's λ F ratio
group 0.509 F6,96= 6.42***
sex F3,48= 142.9***
5
Table S4. MANOVA of multivariate wing shape, based on Jacobian determinants of 122
(females) and 124 (males) pseudo-landmarks. Contrasts between the three groups (FI versus FS; FI versus MS; FS versus MS) revealed significant differences, indicating that both karyotype and geography have an effect on multivariate wing shape phenotype. *** p < 0.001.
Sex Factors Wilk's λ F ratio
Female group (g) 0.23 F244,832= 3.67***
line(group) (l(g)) 1.9 x 10⁻⁸ F3538,12059= 3.1***
Male group (g) 0.23 F248,760= 3.26***
7
9
References
Chyb, S. & Gompel, N. 2013. The Atlas of Drosophila Morphology. Wild-type and Classical Mutants. 1st edition. Academic Press, London.
Cohen, J. 1988. Statistical power analysis for the behavioral sciences. Lawrence Erlbaum Associates, Hillsdale.
Rako, L., Anderson, A.R., Sgrò, C.M., Stocker, A.J. & Hoffmann, A.A. 2006. The association between inversion In(3R)Payne and clinally varying traits in Drosophila melanogaster.