ARTICLE
Genetic relationship between silver
–lead–zinc mineralization
in the Wutong deposit, Guangxi Province and Mesozoic
granitic magmatism in the Nanling belt, southeast China
Pilar Lecumberri-Sanchez&Rolf L. Romer&Volker Lüders&Robert J. Bodnar
Received: 8 March 2013 / Accepted: 30 September 2013 / Published online: 22 October 2013 # Springer-Verlag Berlin Heidelberg 2013
Abstract More than 50 % of the world's total reserves of tungsten are in China and most tungsten deposits are located in the Nanling range in southeast China. This study explores the potential genetic relationship between tungsten–tin (W–Sn) mineralization and shallower Ag–Pb–Zn deposits in the Nanling range based on data from the Wutong deposit, Guangxi Province. The lead, oxygen, carbon, sulfur, and strontium isotopic compositions of minerals at Wutong indi-cate that a single crustal-derived fluid was responsible for mineralization. Wutong likely formed at relatively low tem-peratures (∼200–300 °C) and low pressures, as indicated by the similarity between homogenization temperatures of fluid inclusions and those estimated from S isotopic compositions of minerals. The hübnerite age (92.3–104.4 Ma) indicates that the Wutong mineralization is likely related to nearby Late Yanshanian (Cretaceous) S-type granites derived from Proterozoic crust. This mineralization event coincides with the last W–Sn mineralization event and the Cretaceous peak of mineralization in the Nanling range.
Keywords Cathaysia . Yanshanian . Hübnerite dating . Chalcopyrite disease . Fluid inclusions . Isotopes
Introduction
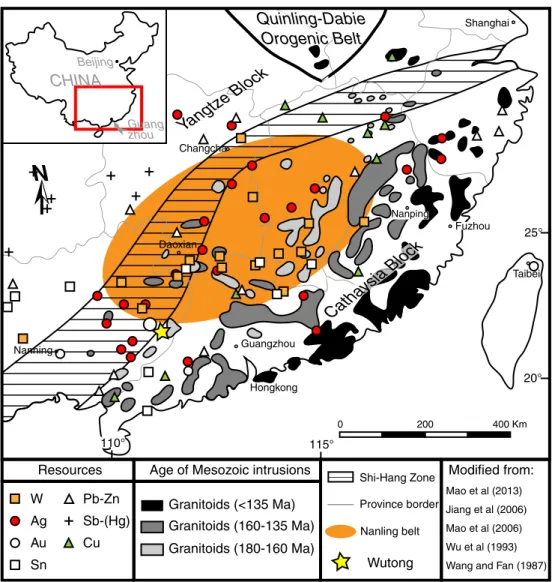
The Nanling range (southeast China) is the largest tungsten– tin (W–Sn) metallogenic province in the world (Sun et al. 2012). Tungsten-tin deposits in the Nanling range (Fig.1) are typically hosted in low-grade metasedimentary rocks (shales or sandstones) and commonly related to Mesozoic granitoids (Qi et al. 2012). In general, granitoids in southeast China become younger towards the east (Fig.1) possibly reflecting an increase in the angle of subduction of the Pacific plate from 180 to 90 Ma (Li et al.2012). Relatively young granites with age and geochemical characteristics similar to the coastal granites occur also within the South China Block (Geng et al.2006). The genetic relationships between outcropping plutons and ore deposits as well as between spatially related ore deposits are not always clear due to the complex tectonic evolution and the multiple magmatic and metallogenic events in the Nanling region.
Hydrothermal silver–lead–zinc deposits in the Nanling range broadly overlap in distribution with tungsten deposits and are typically associated with metasomatic processes (Wu et al.1993). Their genetic link to specific magmatic episodes or other mineralizing events, however, is not well constrained. Our understanding of the spatial extent of specific minerali-zation and magmatic events is based on outcropping plutons and associated magmatic–hydrothermal systems. However, clarifying the relationship between shallow hydrothermal de-posits and deeper magmatic-hydrothermal systems may ex-pand our understanding of magmatism and related minerali-zation at depth.
Wutong, located in Guangxi Province, is a Ag–Pb–Zn deposit within a major metallogenic province (Nanling range) that was previously exploited for Ag–Pb–Zn before it became a world class producer of gem-quality rhodochrosite. The Wutong deposit was discovered in 1958 and originally mined for metals. Reserves at the deposit were estimated at 4,800 Editorial handling: G. Beaudoin
P. Lecumberri-Sanchez (*)
:
R. J. BodnarDepartment of Geosciences, Virginia Tech, 4044 Derring Hall, Blacksburg, VA 24061, USA
e-mail: pilar@vt.edu R. L. Romer:V. Lüders
Helmholtz Centre Potsdam, Deutsches GeoForschungsZentrum (GFZ), Telegrafenberg, 14473 Potsdam, Germany
Present Address: P. Lecumberri-Sanchez
Department of Earth Sciences, ETH Zurich, Clausiusstrasse 25, 8092 Zürich, Switzerland
tons of lead, 3,600 tons of zinc, and 6.65 tons of silver (Lees et al.2011). Tungsten was mined as a by-product. Over the last 10 years most of the exploitation has focused on the extraction of mineral specimens. Cross-sections of the mine workings as of 2006 are provided by Lees et al. (2011) but distribution of metal grades is not available since the current mining at Wutong is focused in rhodochrosite gemstone min-ing. Wutong is characterized by the presence of hübnerite– rhodochrosite veins with associated phyllic–argillic alteration. The vein and alteration mineralogy at Wutong, as well as its location within a major metallogenic province with abundant magmatic events, suggests that Wutong may represent the shallow expression of a deeper magmatic–hydrothermal sys-tem, analogous to the distribution of polymetallic (Ag–Pb– Zn–Cu)–Mn–W vein deposits associated with porphyry–mo-lybdenum deposits in the Colorado Mineral Belt (Lüders et al. 2009; Seedorff and Einaudi 2004). In this study, the age, mineral chemistry, and fluid characteristics of the Wutong deposit have been studied to constrain the metallogenic
processes leading to the formation of the Wutong deposit, and to investigate possible relationships between Wutong and other magmatic–hydrothermal systems in southeastern China. Geologic setting
The Wutong deposit is located in the southern region of the Nanling granite belt (Fig. 1) within the Cathaysia block (which is the southeast unit of the broader South China Block (SCB)). The basement in the Cathaysia block consists of gneisses, amphibolites, and migmatites of Precambrian age (mostly Proterozoic with locally some Archean rocks). The cover consists of volcanic and sedimentary rocks of late Neoproterozoic to Mesozoic age (Charoy and Barbey2008; Chen and Jahn1998; Wang et al.2011). Within the Cathaysia block, granites constitute about 30 % of the outcrop area (Charoy and Barbey2008) and about 90 % of the exposed igneous rocks are Mesozoic (Sun et al. 2012). Within this
Mao et al (2013) Jiang et al (2006) Mao et al (2006) Wu et al (1993) Wang and Fan (1987)
Yangtz
e Bloc
k
Changcha Guangzhou Hongkong Nanning Nanping Fuzhou Shanghai Guang zhou BeijingCHINA
Taibei 0 200 400 KmN
DaoxianCatha
ysia Bloc
k
Quinling-Dabie
Orogenic Belt
W Ag Au Sn Pb-Zn Sb-(Hg) Cu Wutong Province border Age of Mesozoic intrusionsGranitoids (180-160 Ma) Granitoids (160-135 Ma) Granitoids (<135 Ma) Resources
Shi-Hang Zone Modified from:
Nanling belt
25°
115°
20°
110°
Fig. 1 Regional geologic map of the South China Block (SCB) showing the location of major geologic features and major ore deposits, as well as the
distribution of different groups of Mesozoic granitoids. Compiled from Sun et al. (2012), Jiang et al. (2006), Mao et al. (2006), Wu et al. (1993), and Wang and Fan (1987)
group, granitoids formed mostly in two periods: during the Triassic Indosinian orogeny and during the mid-Jurassic to Cretaceaous Yanshanian orogeny (Zhou et al.2006).
Indosinian granites (245–205 Ma) are S-type granites de-rived from Paleoproterozoic crust and typically show no evi-dence of mantle input (Chen and Jahn 1998). In contrast, Yanshanian granites are geochemically more diverse and fall into two age groups. They show variable and significant mantle input as indicated by their range of ε-Nd values (Chen and Jahn 1998). Early Yanshanian magmatism (Jurassic, 180–142 Ma) shows bimodal magmatism charac-teristic of post-orogenic suites and is dominated by calc– alkaline I-type granites, with some A-type granites (Zhou et al.2006). Late Yanshanian magmatism (Cretaceous, 142– 67 Ma) consists of I-type granites and S-type granites scattered throughout the Cathaysia block and volcanism that exhibits increasingly younger ages to the southeast (Zhou et al.2006). As a result, only some Late Yanshanian granites are identified in the interior of Cathaysia and these intrusions, which are associated with tungsten-tin mineralization, com-monly are related to extensional basins that developed at the western limit of the Cathaysia block (Feng et al.2013). The Late Yanshanian granites from the interior of the Cathaysia block and coastal granites of the same age are petrographically similar and their Sr isotopic signatures indicate that both were likely derived from melting of the Proterozoic basement (Geng et al.2006).
W–Sn mineralization in the Nanling belt developed in several time periods, including 90–100, 134–140, 144–162, and 210–235 Ma, with the most important mineralization in the interval between 150–160 Ma (Qi et al.2012; Mao et al. 2007). Jurassic (Early Yanshanian) mineralization is typically W–Sn vein type, peaks around 150–160 Ma, and occurs mainly within the Nanling belt (Mao et al.2013; Mao et al. 2007; Qi et al. 2012). In contrast, Cretaceous (Late Yanshanian) mineralization is dominantly polymetallic Sn– W–Cu–Pb–Zn–Au–Ag–U (Mao et al. 2013), peaks around 100–90 Ma, and is typically related to the development of basins and strike-slip faults in extensional tectonic settings (Mao et al.2013).
The local geology of the Wutong area presented here is based on Misantoni (personal communication) and Lees et al. (2011). The Wutong deposit is located in variably dipping Cambrian siltstones and shales likely belonging to the Shuikou Group (Zhong et al.2010). Intrusions in the region fall in two age groups, 110–90 Ma (Late Yanshanian) and 460–415 Ma (Geng et al.2006; Fig. 2). A granite/rhyolite porphyry of unknown age outcrops at the mine (Lees et al. 2011) within the mine fracture zone and within 30 m of the intersection of the mine fracture zone with a well-developed tungsten vein.
Within the deposit, siltstones, shales, and the fault zone largely strike N45W and systematically dip steeply towards
the northeast. The mineralization runs subparallel to this ori-entation although locally early, subhorizontal quartz veins with hübnerite and sulfides are present. There are at least three distinct movement periods: (1) premineralization faulting along bedding, (2) syn-quartz-hübnerite subhorizontal vein-ing, and (3) syn-sulfide–rhodochrosite–fluorite faulting, vein-ing, and brecciation. These sets of structures occur within the fault zone but not away from it. The location of the structures is probably due to the presence of a competent unit (e.g., a chert) surrounded by less competent units (e.g., shales) where the fault zone is observed. Alteration is widespread within the fault zone and consists of sericite–pyrite–quartz and the fault is locally silicified.
The general paragenetic sequence shown in hand sample and described by Lees et al. (2011) distinguishes three main stages (Fig. 3). The first stage consists of early quartz– hübnerite–pyrite associated with horizontal veining. The sec-ond stage consists of early purple fluorite–rhodochrosite–ga-lena–sphalerite with the late addition of chalcopyrite–barite– apatite–acanthite–quartz. The latest stage consists of uncom-mon silver wires in base metal–rhodochrosite pods, typically coated by clay, and accompanied by green fluorite and quartz.
Methods
Samples from the Wutong mine with the most complete para-genetic sequences were provided by Bryan Lees (Collector's Edge Inc, Golden, CO, USA) for the development of this study. The specific coordinates where the samples were col-lected are unknown to the authors. Fluid inclusion assemblages (Goldstein and Reynolds1994) in quartz, rhodochrosite, sphal-erite, and fluorite from the first and second hydrothermal stages were measured using conventional microthermometry in a USGS gas-flow freezing/heating stage mounted on an Olympus BX50 microscope (Table 1). Synthetic fluid inclu-sions supplied by Synflinc (Sterner and Bodnar 1984) were used to calibrate the stage thermocouple. Salinity in equivalent weight percent NaCl (eqwt % NaCl) was interpreted from low-temperature phase changes using HokieFlincs_H2O-NaCl (Steele-MacInnis et al.2012; Bodnar1993).
Gas- and solid-bearing inclusions were analyzed using a Jobin–Yvon Raman spectrometer attached to an Olympus optical microscope with 50× and 80× long-working-distance objectives. The laser source used was an air-cooled 514 nm argon laser set at 100 mW at the source. The solids were scanned in three 30-s cycles within a scanning range of 100– 4,000 cm−1. The gas bubbles were scanned in three 30-s cycles within a scanning range of 800–1,800 cm−1. The den-sity of CO2in the fluid inclusions has been estimated from the splitting of the Fermi diad (Kawakami et al.2003; Fall et al. 2011) and the bulk composition was calculated by assuming
the inclusions contain 20 vol.% vapor, as estimated optically based on Fig.4.10 in Roedder (1984).
The composition of fluid inclusions in quartz, rhodochro-site, and sphalerite as well as the composition of the host minerals was determined by laser ablation inductively coupled plasma mass spectrometry (LA-ICP-MS). The LA-ICP-MS system consists of a 193 nm GeoLasPro Laser Ablation sys-tem coupled to an Agilent 7500ce inductively coupled plasma
mass spectrometer. Hydrogen gas was used in the reaction cell to prevent isobaric or molecular interferences. NIST 610 glass was used as a standard and analyzed at least twice at the beginning and end of each session to provide a drift correc-tion. Host minerals were analyzed using a laser spot diameter of 60μm while the diameter used for fluid inclusion ablation varied depending on fluid inclusion size. Fluid inclusions were ablated as described by Halter et al. (2002) when neces-sary to optimize the ablation behavior and prevent fluid inclu-sion decrepitation. The typical fluid incluinclu-sion analysis consisted of collecting 60 s of background, then the laser was turned on and signal was collected from the host until the fluid inclusion was opened to produce signal from the inclusion. The data resulting from irregular opening of FI have been discarded. The raw data were processed using AMS software (Mutchler et al. 2008). When the fluid inclusions were hosted in sphalerite or rhodochrosite a host correction was required (Halter et al.2002) and the internal standard used in these cases was the equivalent weight percent NaCl obtained from microthermometry. To allow host correction, only FI in hosts of homogeneous compositions were analyzed. Therefore, fluid inclusions with halos of“chalcopyrite disease”
10 20 Km Wuzhou Liubao Wutong Jinzhuang Yunan 444±6 My (1) 104±3 My (1) 101±7 My (1) 100±1 My (1) 99±2 My (1) 461±35 My (1) 443 My (2) 447 My (2) 446 My (2) Guangping Tiaocun Zhougongding Deqing Xinghua Maanshan Wulong Shidong GU ANGXI PR OVINCE GU ANGDONG PR OVINCE
Paleozoic sandstones, siltstones and shales Cretaceous granitoids
Ordovician granitoids Granitoids of unknown age
Guang zhou Beijing CHINA Reverse fault Anticlinorium 95±1 My (4*) 157±4 My (3*) Yuanzhuding Pb-Zn deposit Sn-W deposit Au deposit Cu-Au deposit 23° 30’ N 23° 10’ N 111° 20’ E
Fig. 2 Regional geologic map in the vicinity of Wutong. Modified from Geng et al. (2006), Zhong et al. (2010), Wang et al. (2011) and map provided by Prof. Chen Maohong. Ages from Geng et al. (2006) (1), Wu and Zhang (1986) (2), Zhong et al. (2010) (3), and this study (4) Quartz Pyrite Hübnerite Fluorite Rhodochrosite Galena Sphalerite Apatite Chalcopyrite Barite Kutnohorite Acanthite Native silver Calcite Clays Purple/pink Green 1st hydrothermal stage 2nd hydrothermal stage 3rd hydrothermal stage
(Fig.4; Barton and Bethke1987) were not analyzed. Note that Ag-, Cu-, and Fe-bearing sulfides of varying origin have been detected in fluid inclusions in sphalerite. Due to the lack of information concerning the origin of those sulfides, the time interval used to process LA-ICP-MS data excludes those sul-fides and therefore the actual Ag, Cu, and Fe concentration of the fluid has likely been underestimated.
Hübnerite samples were processed following the procedure described by Romer and Lüders (2006) to determine the Pb isotopic composition and the Pb and U contents. Fresh hübnerite samples were washed in 7N HNO3, H2O, and ace-tone. The sample mixed with a205Pb-235U tracer was dissolved overnight in 40 % HF at 160 °C. The resulting solution was slowly dried at 90 °C, transformed into chloride using 6 N HCl, and finally loaded in 3 N HCl on columns with a Biorad AG1-X8 anion exchange resin (Romer et al.2005). Pb and U were separated using HCl-HBr and HCl-HNO3ion exchange chem-istry, respectively. Pb and U were then loaded with phosphoric acid and silica gel on individual Re filaments and analyzed by static multicollection at 1,200–1,260 and 1,300–1,360 °C, re-spectively, using the scanning electron microscope and Faraday collectors of a Finnigan MAT262 multicollector mass spectrometer. The analytical results are listed in Table2.
The Pb isotopic compositions of galena, apatite, rhodochro-site, and fluorite and the Sr isotopic composition of apatite, rhodochrosite, fluorite, and sphalerite (occurring with galena) were determined. Galena, sphalerite, and apatite were dissolved in 7N HNO3, fluorite in H2SO4, and rhodochrosite in 6N HCl. Lead from rhodochrosite, apatite, and fluorite was
separated using HCl-HBr ion exchange chemistry (Romer et al.2005). For some of the apatite samples, the concentration of Pb and U was determined in addition to the Pb isotopic composition using the same analytical procedures as described for hübnerite. Lead from galena was not further purified. Pb was loaded and analyzed as described for hübnerite. The analytical results are listed in Tables 3and4. Strontium was separated by cation exchange chromatography using Biorad AG50 W-X8 resin in 2.5 N HCl medium, loaded on single Ta filaments, and analyzed on a Triton multicollector thermal ionization mass spectrometer using dynamic multicollection. The reported ratios are normalized to 86Sr/88Sr=0.1194 and their uncertainties are given as 2σmerrors. Strontium reference material NBS987 gave 87Sr/86Sr=0.710249±5 (2σ, n =22). The analytical results are listed in Table3.
Carbon and oxygen isotopic compositions of rhodochrosite were obtained by reacting rhodochrosite with 10.3 % phospho-ric acid at 70 °C to extract carbon dioxide. The resulting solution was analyzed on a MAT253 ThermoFisher mass spectrometer operated by a Gasbench 2 in continuous He flow mode. The C and O isotopic ratios were then calculated assuming a fraction-ation factorα for phosphoric acid of 1.00812 (Böttcher1993) and expressed asδ values relative to VPDB for carbon and to VSMOW for oxygen. The analytical precision of these mea-surements is <0.04 forδ13C and <0.06‰ for δ18O and the total accuracy and precision are estimated at ±0.1‰.
Sulfur isotopic compositions were determined for pyrite, sphalerite, acanthite, galena, and chalcopyrite. Sulfide minerals were mixed with V2O5and run through an Elemental Analyzer
Table 1 Thermometric and Raman results from fluid inclusions along the paragenesis at the Wutong deposit
Host Hydrothermal stage FI typea Description Solid inclusions Th range (°C) Salinity range (eq wt% NaCl) XCO2
Quartz 1b First P Irregular None 205–225 0.6–1 Nc
Quartz 1b First S None 280–290 1.6–3.6 <0.01
Quartz 1b First U None 246–294 1.9–7.2 <0.01
Sphalerite Second P NCS 302–322 4.3–6.7 <0.01
Rhodochrosite Second P 280–283 2.8–5.5 <0.01
Sphalerite Second S1 NCS Cpy disease Cpy 206–293 2.3–6.1 <0.01
Rhodochrosite Second S 229–293 0.5–6.4 Nc
Sphalerite Second S2 Irregular None 188–204 0.2–0.4 Nc
Quartz 2d Second P Undet. 1e 195–225 0–0.5 Nc
Fluorite Second P Undet. 1e 143–157 6.5–8 Nc
Fluorite Second S 90–137 0–0.1 Nc
NCS negative crystal shape
a
FI type indicates whether the FI is primary (P), secondary (S), or of unknown origin (U). Two generations of secondary inclusions have been identified in sphalerite: early (S1) and late (S2)
bHübnerite-related quartz cCO
2Raman peaks were not identified indicating absence or very low concentrations of CO2 d
Fluorite-related quartz
e
connected to a ThermoFinnigan Delta Plus mass spectrometer to determine the sulfur isotopic composition. The resulting S iso-topic composition is expressed as per mil difference relative to the VCDT standard. The reproducibility of these measurements is better than 3‰.
Results
Mineral composition
Sphalerite analyzed in this study includes two main types: an early clear sphalerite with 97–99 wt% ZnS, 0.5–1 wt% CdS,
0.5–1 wt % FeS, 1–5 ppm CuS, and up to 0.4 ppm Ag2S and a later sphalerite with abundant chalcopyrite disease (chalcopyrite blebs in sphalerite; Barton and Bethke 1987) in which the bulk composition including the chalcopyrite blebs has similar Cd and Fe contents but up to 0.3 wt% CuS and up to 50 ppm Ag2S. Chalcopyrite disease occurs com-monly surrounding secondary fluid inclusions in sphalerite (Fig.4b, c) and the composition of sphalerite surrounding the inclusion is roughly similar to the composition of the second generation of sphalerite (Fig.4g, h).
Rhodochrosite consists of nearly pure manganese carbon-ate (mostly above 90 wt% MnCO3 and typically above 97 wt% MnCO3for gem-quality rhodochrosites) with minor
Fig. 4 Photomicrographs of Wutong samples. a Primary fluid inclusion assemblage in hübnerite-related quartz. b Chalcopyrite blebs in sphalerite (chalcopyrite disease) surrounding an early fluid inclusion. The darker regions of the FI correspond to a vapor bubble and chalcopyrite. c Secondary fluid inclusion assemblages in early clear sphalerite with and without chalcopyrite disease. d Post-hübnerite fluid inclusion associated to hübnerite needle in quartz. The hübnerite needle triggered the formation of the FI and therefore, in this case, hübnerite precipitation precedes FI formation. e Fibrous hydrous-silicate grown on the surface of quartz 2. d Fibrous hydrous-silicate trapped in fluid inclusion in quartz 2. f, g First and second generation of sphalerite represented in the same crystal in transmitted and reflected light. The early generation of sphalerite is clear (does not show
chalcopyrite disease) while the second generation shows chalcopyrite disease
amounts of FeCO3(up to 3 wt% ∼0.6 atomic wt% Fe) and CaCO3(up to 3 wt%∼0.5 atomic wt% Ca).
Fluid inclusions
Fluid inclusions (FI) at Wutong are systematically of low salinity and are liquid-rich. Fluid inclusions classified as pri-mary, secondary, and unknown origin have been observed in the system. Primary fluid inclusions are distributed along growth zones (Fig. 4a) and represent the fluid from which the host mineral precipitated. Secondary fluid inclusions (Fig.4b, c) occur along fracture planes and represent fluids trapped after host–mineral precipitation. Fluid inclusions whose origin is not clearly primary or secondary have only been incorporated in the paragenesis when they show specific features that constrain the time of trapping (i.e., such as when a fluid inclusion forms around a hübnerite needle, indicating that the inclusion and hübnerite are coeval; Fig.4d).
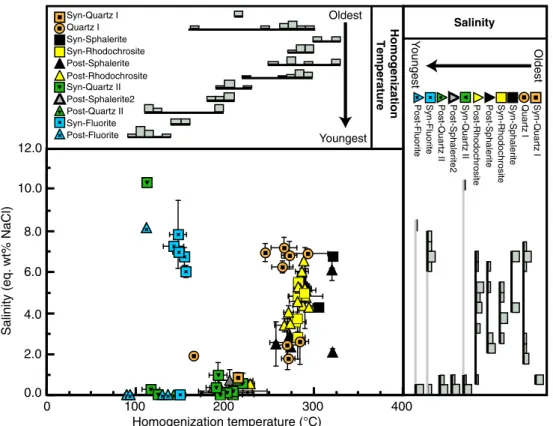
Fluid inclusion paragenesis and microthermometric data indicate that an early fluid evolved from ∼200 °C and ∼1 eq wt% NaCl in the Early Quartz–Hüebnerite stage to >320 °C and ∼5 eq wt% NaCl in the sulfide-rhodochrosite stage (Fig. 5, Table 1). The temperature and salinity of the fluids then systematically decreased to∼100 °C and salinities <1 eq wt% NaCl in the later quartz– fluorite stage. An important exception to the general trend of decreasing salinity is represented by primary inclusions in fluorite with salinities between 6.5 and 8 eq wt% NaCl (Fig.5, Table1).
CO2-bearing fluids are common in the early stages of the system, are less common during rhodochrosite precipitation, and have not been found in quartz-2 or fluorite. When CO2is present, the CO2concentrations estimated from Raman anal-ysis and vapor volume in the FI are systematically below 0.01 mol fraction.
Fluid inclusions containing chloride daughter minerals (such as halite or sylvite) have not been observed in this system. Some solids other than chlorides are common in the FI. Early, negative crystal-shaped dark inclusions in sphalerite (Fig.4c, dand S1 type inclusions in Table1) are commonly surrounded by blebs of chalcopyrite and potentially other sulfides (so-called chalcopyrite disease; Barton and Bethke 1987). Solid phases in these FI were not observed during petrographic examination but Raman analyses indicate the presence of chalcopyrite in the FI, and LA-ICP-MS data indicate that other sulfide phases may be present as well (Fig. 6). Fluid inclusions in fluorite and quartz-2 have frequently trapped a fibrous mineral (Fig. 4e, f) with distinct Raman peaks at 545, 670, 3,560, and 3, 630 cm−1 and peaks of variable intensity at 2,850 and 2,880 cm−1. The peaks at 670 and in the range 3,500–3, 700 cm−1 suggest that the fibrous mineral is a hydrous silicate, and laser ablation data indicate that the phase contains sodium.
Cesium concentrations in FI increase uniformly from the early to the late stages. In contrast, K/Rb ratios in FI decrease significantly in the first hydrothermal stage and remain ap-proximately constant during the second hydrothermal stage (Fig.7). The metal contents of the fluids (Pb, Zn, Cu, and Ag) Table 2 U-Pb analytical results for hübnerite from the Wutong Mine, Wuzhou, Guangxi Province, China
Weight (mg) Concentrations (ppm) 206 Pb/204Pb 238U/204Pb Radiogenic Pb (at%)c
Atomic ratiosc Apparent ages
(Ma)d U Pb Measured ratiosb 206Pb 207Pb 208Pb 206Pb/238U 207Pb/235U 207Pb/206Pb 206Pb/238U 207Pb/235U H1a 1.548 72.2 2.19 77.04 3910 92.73 4.89 2.78 0.01488 (6) 0.0992 (20) 0.0484 (9) 95.2±0.4 96.1±1.8 H2 2.465 85.0 2.51 76.71 4020 92.77 4.43 2.80 0.01443 (28) 0.0950 (27) 0.0478 (8) 92.3±1.8 92.2±2.5 H3 3.420 155.6 4.25 91.44 4840 92.36 4.48 3.16 0.01502 (8) 0.1004 (12) 0.0485 (5) 96.1±0.5 97.2±1.1 H4 5.627 134.0 4.01 90.61 4400 92.11 4.43 3.46 0.01632 (9) 0.1082 (13) 0.0481 (5) 104.4±0.5 104.3±1.2 H5 2.892 128.7 3.66 84.06 4410 91.89 4.39 3.72 0.01408(10) 0.0975 (28) 0.0478 (11) 94.6±0.6 94.4±2.6 H6 4.382 135.9 4.08 89.33 4340 92.34 4.44 3.22 0.01625 (19) 0.1076 (19) 0.0480 (6) 103.9±1.2 103.8±1.7 H7 3.319 79.5 2.50 71.94 3620 92.68 4.39 2.93 0.01468 (9) 0.0959 (19) 0.0474 (8) 93.9±0.6 92.9±1.7 H8 3.333 87.63 2.63 81.06 4080 92.47 4.45 3.08 0.01504 (16) 0.0997 (22) 0.0481 (8) 96.2±1.0 95.6±2.0 a
Hübnerite samples are fragments from a single crystal
b
Lead isotope ratios corrected for fractionation and isotopic tracer
cLead corrected for fractionation, blank, isotopic tracer, and initial lead with 206Pb/204Pb = 18.80 ± 0.05; 207Pb/204Pb = 15.79 ± 0.03, and 208Pb/204Pb= 39.2 ± 0.1 (cf. Table3). The ratios were corrected for 15 pg Pb and 1 pg U. Uncertainties at 2 sigma level (brackets refer
to last digits) were calculated using Monte Carlo modeling (for details see Schmid et al.2003; Romer and Lüders2006) and include uncertainties for the
205
Pb/235U ratio of the tracer
dApparent ages were calculated using the decay constants for238U and235U recommended by IUGS, i.e., 1.55125×10⁻¹⁰year−1and 9.8485×10⁻¹⁰year−1,
increase in the early stages of the hydrothermal system and slightly decrease after the sulfide stage (Fig.7). Note that the
Cu and Ag concentrations in early secondary FI in sphalerite are likely to be underestimated, as sulfides (solids) in the Table 3 Lead and Sr isotope
composition of vein minerals from the Wutong Mine, Guangxi, PR China
a
Sample numbers as in Table4 b
Lead isotope analyses were performed at Deutsches GeoForschungsZentrum, Pots-dam, Germany, using a Finnigan MAT262 multicollector mass spectrometer. The lead isotopic composition is corrected for mass discrimination with 0.1 %/a.m.u. 2σ reproducibility is better than 0.1 %
c
Strontium isotope analyses were performed at Deutsches GeoForschungsZentrum, Potsdam, Germany, using a Triton multicollector mass spectrometer Samplea 206Pbb/204Pb 207Pbb/204Pb 208Pbb/204Pb 87Src/86Sr Galena, pyrite 1 G1 (ga) 18.825 15.810 39.277 2 G1 (py) 18.840 15.855 39.422 3 Ga-1 (ga) 18.785 15.786 39.202 4 Ga-2 (ga) 18.833 15.847 39.403 5 Galena 18.790 15.801 39.257 Rhodochrosite, sphalerite 6 Big-X 0.728907±73 7 Rhodo 0.731380±53 8 Rhodo-20-1 0.730782±5 9 Rhodo-3 0.731408±5 10 Rh 18.782 15.789 39.215 0.729291±7 11 V5-R 18.785 15.771 39.193 0.731227±8 12 V6R 18.773 15.783 39.173 0.731940±59 13 R-Spha 0.728960±15 Fluorite 14 Fluorite 18.834 15.772 39.348 0.730309±3 15 F1 0.730410±5 16 V1-F 18.792 15.785 39.252 0.730608±17 17 V2-F 18.761 15.780 39.168 0.732602±5 18 V4-F 18.663 15.744 38.405 0.731155±22 19 V6F 0.728692±8 20 V7R 18.766 15.776 39.161 0.733052±6 Apatite 21 Ap-1 18.842 15.817 39.309 0.731904±4 22 AP-2 18.844 15.845 39.436 0.731685±4 23 Ap-3 0.731664±4 24 Ap-4 0.731716±4 25 Ap-2a 18.850 15.806 39.315 0.731784±4 26 Ap-4h 0.731185±5 27 Ap-4i 0.730814±4
Table 4 Lead isotope composi-tion and Pb and U contents of ap-atite from the Wuzhou Mine, Wutong, Guangxi Province, China
a
Sample numbers as in Table3 bLead isotope analyses were
performed at GeoForschungsZen-trum Potsdam, Germany, using a Finnigan MAT262 multi-collector mass spectrometer. The lead isotopic composition is corrected for mass discrimina-tion with 0.1 %/a.m.u. 2σ uncer-tainties are less than 0.1 %. For details, see Table3
Samplea Pb [ppm] U [ppm] 206Pbb/204Pb 207Pbb/204Pb 208Pbb/204Pb 238Ub/204Pb Apatite 1 2a 50.17 2.718 18.850 15.806 39.315 3.51 2 2b 43.12 1.992 18.837 15.799 39.277 2.99 3 2c 10.65 1.186 18.852 15.833 53.779 1.51 4 4a 31.47 5.924 18.971 15.812 39.339 12.22 5 4b 35.80 2.451 18.841 15.789 39.373 4.44 6 4c 40.41 6.857 18.927 15.787 39.249 11.00 7 4d 60.03 4.075 18.843 15.791 39.249 4.39 8 4f 37.66 3.275 18.851 15.783 39.190 5.62 9 4g 81.68 3.607 18.820 15.784 39.201 2.86 10 4h 35.92 1.215 18.803 15.780 39.227 2.19
inclusions have been excluded during data processing. The lowest Cu and Ag concentrations obtained when the sulfides are included in the data processing are similar to those of Na (i.e., spectrum in Fig.6c). Therefore, it is quite possible that the concentration of Cu and Ag in the fluid is the same order of magnitude as sodium.
Chalcopyrite disease
The occurrence of chalcopyrite blebs in sphalerite has been reported from hydrothermal ore deposits worldwide (i.e., Sinclair et al.2006; Marcoux et al. 1996) and is typically interpreted as the result of Cu diffusion through sphalerite, sphalerite replacement, or chalcopyrite–sphalerite co-precipitation (Barton and Bethke1987; Kojima1992; Bente and Doering 1993; Bente and Doering 1995). While the second stage of sphalerite at Wutong (which has abundant chalcopyrite disease) may be the result of any of these pro-cesses, the occurrence of chalcopyrite disease radially distrib-uted around fluid inclusions suggests a diffusion origin, re-ferred to as“diffusion-induced segregation” (DIS) by Bente and Doering (1995). The solubility and diffusivity of Cu through sphalerite decrease with decreasing temperature. Therefore, for this process to take place, the temperature has
to be sufficiently high to allow Cu diffusion through sphalerite within a reasonable amount of time.
Two diffusion processes are necessary to produce the chal-copyrite disease in this system: the diffusion of Cu from the fluid inclusion into the surrounding sphalerite and the diffu-sion of iron to each chalcopyrite bleb from the surrounding sphalerite. Diffusion of copper through sphalerite takes place through interstitial sites and is favored by zinc vacancies (Nelkowski and Bollman1969). The time required to diffuse Cu through the sphalerite around the fluid inclusions has been calculated from t =l2/D where t is time, l is the maximum distance from the fluid inclusion at which chalcopyrite blebs are observed (∼100 μ), and D is the diffusion coefficient of Cu through sphalerite calculated from Nelkowski and Bollman (1969). At 300 °C, Cu can diffuse 100μ within a few days, while at 400 °C Cu can diffuse 100μ in less than a day. The rate of diffusion of Fe through sphalerite towards the chalco-pyrite blebs is slower than the diffusion of Zn out of the chalcopyrite blebs towards sphalerite and, according to the experimental data from Nelkowski and Bollman (1969), cop-per diffuses faster than iron through sphalerite. Therefore, Fe diffusion through sphalerite is the limiting factor in the for-mation of individual chalcopyrite blebs (Mizuta and Scott 1997). Chalcopyrite blebs surrounding fluid inclusions range from submicron to ten microns in diameter (Fig. 4c). The
Syn-Sphalerite Post-Sphalerite Syn-Rhodochrosite Post-Rhodochrosite Syn-Quartz II Post-Sphalerite2 Post-Quartz II Syn-Fluorite Post-Fluorite Oldest Youngest 0.0 2.0 4.0 6.0 8.0 10.0 12.0 0 100 200 300 400 Homogenization temperature (°C) Salinity (eq. wt% NaCl) Quartz I Syn-Quartz I Syn-Sphalerite Post-Sphalerite Syn-Rhodochrosite Post-Rhodochrosite Syn-Quartz II Post-Sphalerite2 Post-Quartz II Syn-Fluorite
Post-Fluorite Quartz I Syn-Quartz I
Oldest
Y
oungest
Homogenization
Temperature Salinity
Fig. 5 Evolution of homogenization temperature and salinity of individ-ual fluid inclusion assemblages (FIA) during the paragenesis. Each data point corresponds to the average homogenization temperature and salinity for the fluid inclusion assemblage and the error bars represent the
standard deviation of values within the FIA. The histograms represent the relative proportion of FIA Thand salinities within a given stage in the
diffusion of Fe from sphalerite to the chalcopyrite blebs is much slower than the diffusion of Cu, but the diffusion distance is much shorter as well. The minimum distance for Fe to diffuse to form a chalcopyrite bleb has been calculated from mass balance and is on the order of a few microns for a bleb of chalcopyrite with a radius of 1μ, and a few tens of
microns for a bleb of chalcopyrite with a radius of 10μ (size of the larger blebs observed). With Fe diffusivity through sphalerite of 10−16cm2/s at 400 °C (Mizuta and Scott1997), it would require about a hundred years to diffuse Fe about 10μ from the sphalerite to the chalcopyrite bleb.
Age of hübnerite mineralization
The hübnerite samples have U concentrations ranging from 72.2 to 156 ppm and Pb contents between 2.2 and 4.2 ppm (Table 2). Common Pb contents range between 1.2 and 2.1 ppm, and are distinctively higher than values reported for hydrothermal hübnerite from the Sweet Home Mine, CO, USA (0.076–0.155 ppm; Romer and Lüders2006). As there are no suitable sites for the large Pb ion in hübnerite (Pb is too large to substitute for Mn and Fe; for discussion, see Romer and Lüders 2006), the relatively high contents of common Pb, i.e., the Pb present in the hübnerite as it precipitates, may be hosted in micro-inclusions of minerals that have higher compatibilities for Pb or may be dissolved in fluid inclusions in hübnerite. The Pb isotopic composition of the various hübnerite samples 102 103 104 105 106 107 Zn Fe K Na Ag Cu Cs
Counts per second
Host Host LFluid inclusionSolid
102 103 104 105 106 107 Zn Fe K Na Ag Cu Cs
Counts per second
Host Host Fluid inclusionL Solid
102 103 104 105 106 107 Zn Fe K Na Ag Cu Cs
Counts per second
Time Host Solid L Fluid inclusion
a
b
c
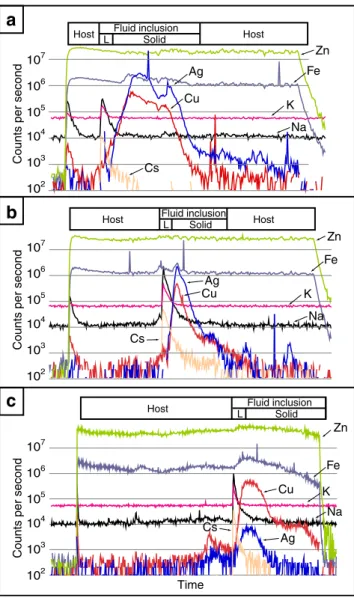
Fig. 6 LA-ICP-MS signal from ablation of three secondary fluid inclu-sions in sphalerite with similar Th and Tm and with no associated chalcopyrite disease halos. The signals shown in the image consist of a short background interval followed by the ablation of the host (which sometimes shows an early peak corresponding to surface contamination). The counts per second are rather constant during the ablation of the host until the fluid inclusion is reached. Once the fluid inclusion is reached there is an early sharp peak corresponding to the fluid within the fluid inclusion (which is typically rich in K, Na, and Cs) and a later softer peak corresponding to solids within the fluid inclusion (which are in this case rich in Cu and Ag). The concentration of silver indicated in Fig.6ais about an order of magnitude above sodium indicating that this fluid inclusion likely trapped a solid. The silver contents shown in the fluid inclusion from Fig.6bare high relative to sodium contents and, therefore, are likely to reflect solid inclusions. The copper and silver signals from the fluid inclusion in Fig.6cindicate that there is a solid in the inclusion but it is unclear whether the solid represents a daughter or trapped mineral
Primary FI Qtz-Huebnerite Secondary FI Qtz-Huebnerite Secondary FI Rhodochrosite Primary FI Rhodochrosite Secondary FI Sphalerite Primary FI Sphalerite 0 10 20 30 40 50 60 70 0 100 200 300 400 500 600 700 800 K/Rb (ppm) Cs (ppm) Metal concentr ation (ppm) Pb Zn Cu Ag 10-1 100 101 102 103 104 105
Fig. 7 Evolution of K/Rb and metal concentration (Pb, Zn, Cu, and Ag) as a function of Cs concentration
defines a linear trend on the206Pb/204Pb–207Pb/204Pb diagram (Fig. 8a). Using the Pb isotopic composition of low-μ (μ =238U/204Pb) minerals (e.g., galena, rhodochrosite, fluorite, and apatite) from the Wutong mineralization to constrain the Pb line (Table3), and assuming that hübnerite had the same initial Pb isotopic composition as the other minerals, the slope of the Pb line corresponds to an age of 109±23 Ma (2σ; MSDW=1.9). The relatively large uncertainty in the age is not due to the scatter of the data, but due to the limited growth of207Pb in geologically young samples. The slight scatter of the Pb isotope data in the 206Pb/204Pb–208Pb/204Pb diagram reflects contrasting Th and U distribution in hübnerite (Fig. 8b). Using the Pb isotopic composition and age of Wutong hübnerite yields232Th/238Uatomicratios ranging from 0.0096 to 0.013. These low values reflect the lower mobility of Th in comparison to U in aqueous fluids and these values are typical for hydrothermal minerals.
On the207Pb/235U–206Pb/238U diagram, all hübnerite samples are concordant, but show a wide range of apparent206Pb/238U ages (92.3–104.4 Ma) and possibly define two groups (Fig.8c, Table2). This range may have several causes including (1) Pb loss, (2) U loss, and (3) heterogeneous isotopic composition of initially incorporated Pb. Lead loss, for instance during sample handling in the laboratory, decreases the apparent206Pb/238U ages and would imply that the two samples with the oldest 206
Pb/238U ages represent the best age estimate (104.3±0.5 Ma, 2σ). In contrast, U loss would increase the apparent206
Pb/238U age, and the four overlapping samples of the group with the youngest apparent206Pb/238U ages would yield the best age estimate (95.2±1.0 Ma; 2σ; MSWD=9.9) for the 206
Pb/238U age. Isotopically heterogeneous initial Pb would shift the appar-ent206Pb/238U age along the concordia curve (for examples, see Romer2001; Romer and Roetzler2011). Radiogenic initial Pb shifts the apparent206Pb/238U age towards older values. As the Pb isotopic composition of rhodochrosite, fluorite, and galena shows only very little variation (Table3), it seems unlikely that heterogeneous initial Pb is the cause of two groups of apparent 206
Pb/238U ages. This is also consistent with the absence of a correlation in the Pbcommoncontent with206Pb/238U ratio. As the fractionation of U and Pb during sample handling does not affect the slope of the lead line in the206Pb/204Pb–207Pb/204Pb diagram, the207Pb/206Pb age from the Pb line may be the most robust age estimate, although less precise than the other age estimates. The apparent206Pb/238U ages define more precise ages (95.2±1.0 and 104.3±0.5 Ma, respectively), which, however, are not nec-essarily more accurate. Therefore, here we use the less precise age defined by the lead line.
Lead and strontium isotopic composition of galena, fluorite, and rhodochrosite
The Pb isotopic compositions of galena, fluorite, rhodochrosite, and apatite fall in a narrow field at relatively high206Pb/204Pb,
207
Pb/204Pb, and 208Pb/204Pb values (Tables3 and 4). In the 206
Pb/204Pb vs. 207Pb/204Pb diagram (Fig.9), the Pb isotope data from the Wutong deposit define three slightly separated groups that fall above the lead growth curve for average upper crust and in the206Pb/204Pb vs.208Pb/204Pb diagram (Fig.9), the Pb isotope data fall between the Pb curves for upper and lower crust (Zartman and Doe1981). In both diagrams, the Pb isotopic composition of the vein minerals falls in the field of felsic rocks from Cathaysia (Fig.9). As most235U decayed early in Earth's history, high207Pb/204Pb values are only obtained for rocks that had acquired high U/Pb (i.e.,238U/204Pb=μ) values
19 20 17 18 15 16 0 20 40 206Pb/204Pb 207 Pb/ 204 Pb 60 80 207Pb/206Pb age = 109±23 Ma (2σ) MSWD = 1.9 100 Hübnerite Wutong Mine Guangxi, China
a
0.0135 0.0145 0.0155 0.0165 0.088 0.092 0.096 0.100 0.104 0.108 106 102 98 94 90 0.112 207Pb/235U 206 Pb/ 238 Uc
Weighted 206Pb/238U age 95.1 ± 1.0 Ma (2σ; MSWD = 9.9) 40 41 42 43 39 0 20 40 206Pb/204Pb 208 Pb/ 204 Pb 60 80 100b
Th/U atom ic = 0.013 Th/Uatom ic = 0 .0096Fig. 8 Pb isotopic composition and U-Pb systematics of hübnerite. For discussion, see text
in the Palaeoproterozoic or Archaean. Similarly, metamorphism results in the preferential loss of U, and to some extent Pb, relative to Th, which with time results in high208Pb/204Pb at
moderate or low 206Pb/204Pb ratios, which is reflected in the contrasting Pb growth curves for upper and lower crust (Fig.9). The field of Cathaysia and Wutong Pb is typical for Pb derived from old continental crust that in part had been variably meta-morphosed. Note, the Pb isotopic composition reflects the old age of the Pb source, but does not constrain the position of the Pb source at the time the Wutong mineralization formed or the processes that mobilized the Pb. For instance, the Pb associated with Wutong mineralization may be derived from a granitic intrusion that melted Cathaysian crustal rocks or it may have been leached from the wallrocks of the deposit. The strontium isotopic composition of all samples from the Wutong deposit is relatively radiogenic with87Sr/86Sr ranging from 0.728 to 0.734 (Table3). Such radiogenic Sr is consistent with an old crustal source as inferred from the Pb isotopes.
The measured Pb isotopic compositions fall into three groups: (1) one fluorite sample with a distinctly lower 206
Pb/204Pb value than for all other samples; (2) galena, fluorite, and rhodochrosite samples that plot at intermediate206Pb/204Pb values; and (3) galena and apatite at206Pb/204Pb values above 18.8 (Fig.9). As in situ Pb growth may modify the initially present Pb isotopic composition of minerals with relatively low Pb contents, the Pb and U contents of some apatite samples has been determined. Recalculating the Pb isotopic composition of apatite to 100 Ma shifts the Pb isotopic composition of the apatite samples into one coherent group (black squares in Fig.9). Although it is unclear whether in situ Pb growth also affects the Pb isotopic composition of rhodochrosite and fluorite to a similar extent, the subdivision into three compositionally different groups persists, as the two groups with higher 206
Pb/204Pb values also contain galena, whose isotopic compo-sition is not changed by in situ Pb growth. The correction of the apatite Pb for in situ growth, however, indicates that most of the Pb falls in a very narrow compositional range.
The overall variation of the Pb and Sr isotopic composition of minerals from the Wutong deposit is small, indicating that the Pb and Sr are dominantly derived from one single source. The small variation may reflect variable contributions through fluid–rock interaction between the hydrothermal fluids and the wall rocks. Nonetheless, in comparison with mineralogically comparable deposits such as the Sweet Home Mine (Lüders et al.2009), the variation in the Pb and Sr isotopic composition is small.
Carbon and oxygen isotopic composition of rhodochrosite
Rhodochrosite samples from Wutong show δ13C andδ18O values between −8.8 and −12.5‰ and 7.4 and 13.1‰, re-spectively. Individual samples show no significant variation in carbon and oxygen isotopic compositions (Lees et al.2011; Fig.10). The narrow range ofδ18O values may be related to small temperature variations during rhodochrosite formation. The majority of the δ18O values scatter around +10±2‰. Using the oxygen isotope fractionation between rhodochrosite 15.8 207 Pb/ 204 Pb 87 Sr/ 86 Sr 206Pb/204Pb 18.50 18.75 19.00 15.7 38.0 39.0 39.5 208 Pb/ 204 Pb 38.5 0.725 0.730 0.735 UC LC 2σ b c b O Wutong Mine Galena Rhodochosite Apatite (measured) Apatite (initial) Fluorite Spalerite a UC
Fig. 9 Lead and Sr isotopic composition of gangue and ore minerals from the Wutong mine (data from Tables3 and4). For some apatite samples, the contents of U and Pb have been determined, allowing us to recalculate the initial206Pb/204Pb and 207Pb/204Pb values (open mea-sured, filled initial). Arrow in c indicates that the initial Pb isotopic composition of apatite plots at lower206Pb/204Pb values. Sphalerite in c
combines the Sr isotopic composition of sphalerite with the Pb isotopic composition of intergrown galena. Reference curves for Pb from Zartman and Doe (1981). UC upper crust, LC lower crust, O orogenic trend (mantle curve in a and b and LC and O not shown in a, as too low
208
Pb/204Pb and 207Pb/204Pb, respectively). Shaded field typical Cathaysia basement lead (Min et al.2003; e.g., Zhang et al.2002)
and water (Böttcher1993) and fluid inclusion homogenization temperatures between 250 and 300 °C, aδ18Owatervalue of about +5‰ is predicted. Such an isotopically heavy water could represent a magmatic source or a hydrothermal fluid of any origin that has fully equilibrated with silicate rocks at high temperatures and low water–rock ratios. An input of meteoric water into the hydrothermal system can be excluded because mixing of ore fluids with meteoric water would have led to less positiveδ18O values in rhodochrosite at the tem-peratures derived from fluid inclusion studies.
Theδ13C values of rhodochrosite between−8.8 and −12.5 ‰ are rather uniform, suggesting a single fluid source derived from felsic magmas or other crustal source. However, the observed small fractionation in carbon isotopes in rhodochro-sites is likely related to fractionation between carbonates and apparent H2CO3(=dissolved H2CO3 and CO2) in the fluid with decreasing temperature (Ohmoto and Rye1979).
Sulfur isotopes
Sulfur isotopes were measured in nine samples from the sulfide stage. Theδ34S values range between−0.6 and 3.3 ‰ (Table5). The measured range in sulfur isotopic composi-tion is consistent with a felsic magmatic sulfur source (e.g., Hoefs1987). Temperatures estimated for coexisting sulfide pairs using the equilibrium fractionation factors from Ohmoto and Rye (1979) yield temperatures between 250 and 290 °C, which is in good agreement with measured homogenization temperatures of fluid inclusions in sphalerite. Thus, the ob-served variation inδ34S values can be interpreted to be a result of sulfur isotope exchange during sulfide formation under (nearly) equilibrium conditions from a homogenous magmatic sulfur source.
Discussion
Genesis of the Wutong deposit
The homogeneous carbon, oxygen, sulfur, strontium, and lead isotopic signatures at Wutong indicate that a single fluid was responsible for the development of the Wutong hydrothermal system, and the Pb isotopic signature points to the Proterozoic upper crust as the major source of that fluid. The age of formation of the Wutong deposit (apparent 206Pb/238U ages of 92.3–104.4 Ma) derived from hübnerite overlaps with the development of intrusion-related tungsten-tin mineralization in the interior of the Cathaysia block during the Late Yanshanian (Cretaceous). Mineralization-related Late Yanshanian intru-sions in the Cathaysia interior (and particularly in the western limit of the Cathaysia block) are typically S-type granites with negative Eu anomalies derived from Proterozoic continental crust (as indicated by Sr–Nd isotopes) by partial melting (Feng et al.2013; Qi et al.2012; Mao et al.2007; Geng et al.2006). Several intrusions of similar age to the Wutong deposit (e.g., Xinghua and Deqing; Fig.2) are exposed to the east of the deposit and are uplifted with respect to the Wutong deposit through reverse faults of unknown age and amount of displacement. The Xinghua (101 Ma) and Deqing (99 Ma) intrusions (Fig. 2) are coeval with the Wutong hübnerite– rhodochrosite mineralization. Geochemically similar intru-sions of presumably similar age near the Wutong deposit (Misantoni, personal communication), or buried intrusions, are the likely source of the fluids that led to the formation of the Wutong deposit. Tungsten deposits within the Nanling range having ages similar to that of the Wutong mineralization (e.g., Damingshan and Wangshe; Mao et al.2013) may rep-resent a deeper expression of the same metallogenic event.
Manganese-rich minerals occur commonly as the distal expression of magmatic hydrothermal systems (e.g., Sweet Home is the distal expression of the Climax Mo deposit, cf. Lüders et al.2009; and the distal Pb–Zn–Ag veins associated Table 5 Sulfur isotopic composition of ore minerals from main sulfide stage at Wutong. Model temperatures are derived using the equilibrium equation for ZnS–PbS from Ohmoto and Rye (1979)
Sample no. Mineral δ34S [‰] Model temperatures
W #1 Akanthite 0.1 W #5 Sphalerite 2.1 Sphalerite-Galena W #5 Galena −0.6 ≈250 °C W #9 Pyrite 3.1 W #11 Pyrite 3.3 W #13 Chalcopyrite 2.2 W #14 Galena 1.0 W #18 Sphalerite 2.8 Sphalerite-Galena W #18 Galena 0.5 ≈290 °C -15 -12.5 -10 -7.5 0 5 10 15 18O [‰ ] VSMOW 13 C [‰ ] VPD B Profile A Profile B Profile C Profile D Rhodochrosite (diverse)
Fig. 10 Carbon and oxygen isotopic compositions of rhodochrosite from various parts of the Wutong mine and profiles measured along traverses of large individual crystals of rhodochrosite
with the Shizhuyuan skarn are rich in manganese-bearing minerals, cf. Mao et al. 1996a, b). In this sense, Wutong represents yet another example of a distal magmatic-hydrothermal system characterized by the presence of relative-ly abundant manganese-bearing minerals, which seems to be an indicator of potential deeper mineralization in the system.
Pressure, temperature, and fluid composition during the formation of Wutong mineralization
Homogenization temperatures of fluid inclusions provide the minimum trapping temperature. Therefore, the first hydrother-mal stage at Wutong took place at temperatures above 210 °C. The increase in homogenization temperatures during the first hydrothermal stage may be due to an increase in the temper-ature of the fluids to above 300 °C, a decompression event or combinations thereof.
Temperatures during the early part of the second hydro-thermal stage (corresponding to the sulfide stage) were above 300 °C. Chalcopyrite disease likely developed at temperatures similar to the homogenization temperature of fluid in-clusions in sphalerite, indicating a low pressure of trapping. Homogenization temperatures during the second hydrother-mal stage gradually decreased to just above 100 °C, suggest-ing continuous and regular coolsuggest-ing of the system over time.
The salinity of the fluids at Wutong follows a trend similar to the temperature, with an early increase during the first hydrothermal stage followed by a continuous decrease during the second hydrothermal stage. The CO2content of the fluid is fairly low in the early stages (<0.01 molar fraction) and undetectable in the late stages of mineralization.
The latest fluids trapped in fluorite are characterized by an increase in salinity (relative to the stages that immediately precede fluorite in the paragenesis) and a decrease in CO2 concentration. This salinity increase may be the result of mixing, boiling, pressure changes, mineral precipitation, or combinations thereof. The relatively homogeneous Pb isoto-pic compositions in the different minerals along the parage-netic sequence suggest that a single fluid was responsible for mineralization and therefore eliminates mixing as a likely explanation. Decompression (without boiling) would lead to a decrease in the salinity of the fluid exsolving from the magma (Cline and Bodnar1991), which is inconsistent with our observations. Mineral precipitation/dissolution may ex-plain a decrease in CO2but is an unlikely explanation for the increase in salinity. While the trends in fluid composition and isotopic composition of minerals through the paragenesis as well as the PTX conditions registered in the system would be compatible with boiling we did not find direct petrographic evidence of boiling or vapor-rich inclusions. Therefore, al-though we suspect that boiling is responsible for the evolution of salinity and CO2in the late fluid, we cannot conclusively prove it.
The variation of cesium concentrations over time may reflect the compositional evolution of a fluid derived from a magma that becomes successively more fractionated or alter-natively may reflect the significantly lower salinity of early fluids. The temporal variation of the K/Rb ratio indicates that the second hydrothermal stage precipitated from a fluid de-rived from a more fractionated magma than the fluid precip-itating minerals of the first hydrothermal stage. The metal contents (Pb, Zn, Cu, and Ag) of the fluid increased during the first hydrothermal stage, reaching their maxima during the second hydrothermal stage (sulfide stage) and decreasing by the end of the second hydrothermal stage. This decrease in Ag, Zn, Cu, and Pb in the fluid during the late second hydrother-mal stage may reflect the precipitation of sphalerite, galena, chalcopyrite, argentite, and silver during this stage, thus de-pleting the fluid in its metal content.
Origin of chalcopyrite disease
We propose the following model for the formation of chalco-pyrite disease in sphalerite at Wutong: (1) an early low-Cu fluid precipitated the early, clear Cu-poor sphalerite; (2) a subsequent fluid enriched in Cu precipitated the late Cu-rich sphalerite and healed fractures in the early, clear Cu-poor sphalerite, leading to the trapping of secondary/ pseudosecondary Cu-rich fluid inclusions. (3) Due to the gradient in chemical potential between the fluid inclu-sions (∼1 wt% Cu) and the Cu-poor sphalerite (∼5 ppm Cu), Cu diffused radially from the fluid inclusions into sphalerite. (4) As the concentration of Cu in sphalerite increased due to diffusion, and because the solubility of Cu in sphalerite is very low, Cu interacted with Fe and S from sphalerite to form chalcopyrite blebs and pro-moted the continued diffusion of Cu out of the inclu-sion. This hypothesis is supported by (a) the distribution of Cu in sphalerite, (b) the paragenetic order (chalcopy-rite does not precipitate in the early stages of sphale(chalcopy-rite mineralization but both chalcopyrite and sphalerite co-precipitate in later stages), (c) the evolution of the fluid composition reported from LA-ICP-MS analysis of fluid inclusions, and (d) experimental studies that show that a high-Cu fluid in contact with sphalerite forms chalcopy-rite disease at similar conditions (Eldridge et al. 1988). Furthermore, according to the experimental data on sol-ubility of copper in sphalerite from Hutchison and Scott (1981), the minimum temperature at which the observed 0.3 wt% bulk Cu could have been originally dissolved in sphalerite is around 500 °C. Therefore, it is likely that the amount of Cu observed as chalcopyrite blebs was never completely dissolved in sphalerite and that, as Cu was diffus-ing out of the fluid inclusion and the concentration of Cu in sphalerite increased, chalcopyrite progressively exsolved as a separate phase.
Based on the differing amounts of time required to diffuse Fe and Cu through sphalerite at given temperatures, the lim-iting step for the formation of chalcopyrite disease surround-ing the fluid inclusions is the diffusion of Fe from sphalerite to the chalcopyrite blebs, and not the diffusion of copper out of the inclusion. The time required to diffuse Fe through sphal-erite at the minimum trapping temperatures obtained from fluid inclusions (homogenization temperature) and to form chalcopyrite blebs of the sizes observed fit within the lifespan of hydrothermal ore deposits, which is typically considered to be on the order of 105years (von Quadt et al.2011).
The lack of chalcopyrite disease associated with fractures along which there are Cu-rich secondary fluid inclusions indicates that the fluid flowing through those fractures was likely at temperatures not much higher than 300 °C. At 400 °C Cu would have diffused 50–100 μ from the mineral fracture into sphalerite in a matter of hours. For a fluid at temperatures above 350 °C one would expect to see chalcopyrite disease throughout the fracture, unless these microfractures become sealed completely within a few hours. Because of the low diffusivity of Fe through sphalerite, chalcopyrite blebs formed at these conditions (350–400 °C), however, should not be visible under the microscope, but would be detectable as irregularities in the LA-ICP-MS signal across the fracture. Such irregularities, however, are not observed.
Conclusions
Wutong is a tungsten-bearing Ag–Pb–Zn deposit located in the Nanling range in Guangxi Province in southeast China. The lead and strontium isotopic compositions of minerals indicate that Wutong formed from a magmatic–hydrothermal fluid derived from Proterozoic crust at 92.3–104.4 Ma during the peak of the Cretaceous mineralization event in the Nanling range.
The homogeneous carbon, oxygen, lead, and strontium isotopic compositions indicate that a single major fluid con-tributed during the development of the system. The evolution in the K/Rb ratio in the fluid possibly indicates that the fluid evolved from a progressively more fractionated magma. Mineralization at Wutong formed at temperatures of around 300 °C and relatively low pressures (as indicated by the rough equivalence of Th and temperatures obtained from S isotopes, and the temperatures required for the occurrence of chalcopy-rite disease as observed). Wutong is interpreted to represent a relatively shallow magmatic–hydrothermal system, and it is inferred that deeper mineralization related to magmatism at 90–100 Ma likely occurs in this region.
Mineralization at 90–100 Ma in inner Cathaysia is classi-cally associated with basins formed during the Cretaceous postsubduction extension. Those extensional basins are devel-oped typically along detachment faults commonly located
close to the edge of the Cathaysia block. Other Cretaceous deposits described in this region occur typically over a hun-dred kilometers away from Wutong, towards the southwest edge of the Cathaysia block and are associated with exten-sional features (e.g., the Longtoushan gold deposit is related to normal faults, Mao et al.2013). Wutong shows all the features of deposits formed during the Cretaceous mineralization peak in the Nanling range and occurs further to the east than other deposits of this age in Cathaysia. Wutong may be related to an extensional basin currently not described or may be associated with intrusives that were emplaced at deeper levels due to the lack of structures that facilitated magma ascent. Most Pb–Zn– Ag deposits in this region are classically attributed to the Late Jurassic mineralization. However, some of the Pb–Zn–Ag deposits in this region (such as the Wutong deposit) are associated with the Cretaceous mineralization event and likely represent the shallow expression of the deeper W–Sn or porphyry deposits equivalent to those intruded in extensional basins closer to the western limit of the Cathaysia.
Acknowledgments We would like to thank Bryan Lees (Collector's Edge Inc., Golden, CO, USA) for providing the samples used in this study, Mark Caddick for valuable discussions on diffusion rates and mechanisms, Jamie Wilkinson and Martin Appold for providing addi-tional MS processing software and for their input on LA-ICP-MS data processing and expertise on fluid inclusions in sphalerite, and Matthew Steele-MacInnis for his readiness to discuss geology in general and fluid phase equilibrium in particular. Birgit Plessen (GFZ Potsdam) and Harald Strauß (University Münster) are thanked for stable isotope analysis of rhodochrosite and sulfide samples. We are also indebted to Dean Misantoni for information about the local geology in the Wutong area and to Prof. Chen Maohong and Mr. Zheng Wei for providing access to regional maps of the Dayaoshan-Yunkai area. This manuscript benefit-ted from the reviews, comments, and suggestions from Prof. Jingwen Mao and Prof. Bernd Lehmann. This paper is based upon work supported by the US National Science Foundation under grant no. EAR-1019770 to RJB.
References
Barton PB Jr, Bethke PM (1987) Chalcopyrite disease in sphalerite; pathology and epidemiology. Am Mineral 72:451–467
Bente K, Doering T (1993) Solid-state diffusion in sphalerites—an ex-perimental verification of the chalcopyrite disease. Eur J Mineral 5: 465–478
Bente K, Doering T (1995) Experimental studies on the solid-state diffusion of Cu + In in ZnS and on disease, DIS (diffusion-induced segregations), in sphalerite and their geological applica-tions. Miner Petrol 53:285–305. doi:10.1007/bf01160153 Bodnar RJ (1993) Revised equation and table for determining the
freez-ing point depression of H2O-NaCl solutions. Geochim Cosmochim
Acta 57:683–684. doi:10.1016/0016-7037(93)90378-A
Böttcher ME (1993) Die experimentelle Untersuchung Lagerstätten-relevanter Metall-Anreicherungen aus wäßrigen Lösungen unter besonderer Berücksichtigung von Rhodochrosit (MnCO3). Disser-tation, University of Göttingen, pp 237
Charoy B, Barbey P (2008) Ferromagnesian silicate association in S-type granites; the Darongshan granitic complex (Guangxi, south China). B Soc Geol Fr 179:13–27. doi:10.2113/gssgfbull.179.1.13 Chen J, Jahn B (1998) Crustal evolution of southeastern China; Nd and Sr
isotopic evidence. Tectonophysics 284:101–133
Cline JS, Bodnar RJ (1991) Can economic porphyry copper mineraliza-tion be generated by a typical calc-alkaline melt? J Geophys Res 96: 8113–8126
Eldridge CS, Bourcier WL, Ohmoto H, Barnes HL (1988) Hydrothermal inoculation and incubation of the chalcopyrite disease in sphalerite. Econ Geol 83:978–989
Fall A, Tattitch B, Bodnar RJ (2011) Combined microthermometric and Raman spectroscopic technique to determine the salinity of H2O-CO2-NaCl fluid inclusions based on clathrate melting. Geochim Cosmochim Acta 75:951–964
Feng J, Mao J, Pei R (2013) Ages and geochemistry of Laojunshan granites in southeastern Yunnan, China: implications for W-Sn polymetallic ore deposits. Miner Petrol 107:573–589. doi:10.1007/ s00710-012-0253-3
Geng H, Xu X, O'Reilly SY, Zhao M, Sun T (2006) Cretaceous volcanic-intrusive magmatism in western Guangdong and its geological significance. Sci China: Ser D 49:696–713
Goldstein RH, Reynolds TJ (1994) Systematics of fluid inclusions in diagenetic minerals. SEPM Short Course Notes 31:199–199 Halter WE, Pettke T, Heinrich CA, Rothen-Rutishauser B (2002) Major
to trace element analysis of melt inclusions by laser-ablation ICP-MS; methods of quantification. Chem Geol 183:63–86. doi:10. 1016/S0009-2541(01)00372-2
Hoefs J (1987) Stable isotope geochemistry. Springer, Berlin
Hutchison MN, Scott SD (1981) Sphalerite geobarometry in the Cu-Fe-Zn-S system. Econ Geol 76:143–153
Jiang Y-H, Jiang S-Y, Zhao K-D, Ling H-F (2006) Petrogenesis of Late Jurassic Qianlishan granites and mafic dykes, southeast China; implications for a back-arc extension setting. Geol Mag 143:457– 474
Kawakami Y, Yamamoto J, Kagi H (2003) Micro-Raman densimeter for CO2 inclusions in mantle-derived minerals. Appl Spectrosc 57: 1333–1339
Kojima S (1992) The nature of chalcopyrite inclusions in sphalerite: exsolution, coprecipitation, or "diseased"? A discussion. Econ Geol 87:1191–1192
Lees B, Behling S, Misantoni D, Lueders V, Romer RL, Sanchez PL, Cory P (2011) The Wutong Mine; Guangxi Zhuang Autonomous Region, China. Mineral Rec 42:521–544
Li Z-X, Li X, Chung S-L, Lo C-H, Xu X, Li W (2012) Magmatic switch-on and switch-off along the south China continental margin since the Permian; transition from an Andean-type to a western Pacific-type plate boundary. Tectonophysics 532–535: 271–290
Lüders V, Romer RL, Gilg H, Bodnar RJ, Pettke T, Misantoni D (2009) A geochemical study of the Sweet Home Mine, Colorado Mineral Belt, USA: hydrothermal fluid evolution above a hypothesized granite cupola. Miner Deposita 44:415–434. doi: 10.1007/s00126-008-0221-3
Mao J, Guy B, Raimbault L, Shimazaki H (1996a) Manganese skarn in the Shizhuyuan polymetallic tungsten deposit, Hunan, China. Resour Geol 46:1–11
Mao J, Li H, Shimazaki H, Raimbault L, Guy B (1996b) Geology and metallogeny of the Shizhuyuan skarn-greisen deposit, Hunan prov-ince, China. Int Geol Rev 38:1020–1039
Mao J, Xie G, Li X, Zhang C, Wang Y (2006) Mesozoic large-scale mineralization and multiple lithospheric extensions in South China. Acta Geol Sin 80:420–431
Mao J, Cheng Y, Cheng M, Pirajno F (2013) Major types and time-space distribution of Mesozoic ore deposits in South China and their geodynamic settings. Miner Deposita 48:267–294
Mao JW, Wang YT, Lehmann B, Yu JJ, Du AD, Mei YX, Li YF, Zhang WS (2007) Large-scale tungsten–tin mineralization in the Nanling region, South China: metallogenic ages and corresponding geodynamic processes. Acta Petrol Sin 23:2329–2338
Marcoux E, Moelo Y, Leistel JM (1996) Bismuth and cobalt minerals as indicators of stringer zones to massive sulphide deposits, Iberian Pyrite Belt. Miner Deposita 31:1–26
Min MZ, Luo X-Z, Li X-G, Yang Z, Zhai L-Y (2003) Geochemical constraints on the petrogenesis of the Middle Miaoershan granitoids, South China. Geochem J 37(5):603–625
Mizuta T, Scott SD (1997) Kinetics of iron depletion near pyrrhotite and chalcopyrite inclusions in sphalerite: the sphalerite speedometer. Econ Geol 92:772–783
Mutchler SR, Fedele L, Bodnar RJ (2008) Appendix A5; analysis man-agement system (AMS) for reduction of laser ablation ICP-MS data. Short Course Ser Mineral Assoc Can 40:318–327
Nelkowski H, Bollman G (1969) Diffusion of indium and copper in zinc sulfide single crystals. Z Naturforsch A24:1302–1306
Ohmoto H, Rye RO (1979) Isotopes of sulfur and carbon. In: Barnes HL (ed) Geochemistry of hydrothermal ore deposits, 2nd edn. Wiley, New York, pp pp 509–pp 567
Qi H-W, Hu R-Z, Wang X-F, Qu W-J, Bi X-W, Peng T (2012) Molyb-denite Re-Os and muscovite 40 Ar/39Ar dating fo quartz vein-type W-Sn polymetallic deposits in Northern Guangdong, South China. Miner Deposita 47:607–622
Roedder E (1984) Fluid inclusions. Rev Mineral 12:644
Romer RL (2001) Lead incorporation during crystal growth and the misinterpretation of geochronological data from low-238U/204Pb metamorphic minerals. Terra Nova 13:258–263. doi:10.1046/j. 1365-3121.2001.00348.x
Romer RL, Heinrich W, Schroeder-Smeibidl B, Meixner A, Fischer C-O, Schultz C (2005) Elemental dispersion and stable isotope fractionation during reactive fluid-flow and fluid immiscibility in the Bufa del Diente aureole, NE Mexico; evidence from radiographies and Li, B, Sr, Nd, and Pb isotope systematics. Contrib Mineral Petr 149:400–429. doi: 10.1007/s00410-005-0656-9
Romer RL, Lüders V (2006) Direct dating of hydrothermal W mineral-ization; U/Pb age for huebnerite (MnWO4), Sweet Home Mine,
Colorado. Geochim Cosmochim Acta 70:4725–4733. doi:10.1016/ j.gca.2006.07.003
Romer RL, Roetzler J (2011) The role of element distribution for the isotopic dating of metamorphic minerals. Eur J Mineral 23:17– 33
Schmid R, Romer RL, Franz L, Oberhänsli R, Martinotti G (2003) Basement-cover sequences within the UHP unit of the Dabie Shan. J Metamorph Geol 21:531–538
Seedorff E, Einaudi MT (2004) Henderson porphyry molyvdenum sys-tem, Colorado: I. Sequence and abundance of hydrothermal mineral assemblages, flow paths of evolving fluids, and evolutionary style. Econ Geol 99:3–37
Sinclair WD, Kooiman GJA, Martin DA, Kjarsgaard IM (2006) Geology, geochemistry and mineralogy of indium resources at Mount Pleas-ant, New Brunswick, Canada. Ore Geol Rev 28:123–145. doi:10. 1016/j.oregeorev.2003.03.001
Steele-MacInnis M, Lecumberri-Sanchez P, Bodnar RJ (2012) HokieFlincs_H2O-NaCl: a Microsoft Excel spreadsheet for interpreting microthermometric data from fluid inclusions based on the PVTX properties of H2O-NaCl. Comput Geosci 49:334–337 Sterner SM, Bodnar RJ (1984) Synthetic fluid inclusions in natural quartz; 1, Compositional types synthesized and applications to experimental geochemistry. Geochim Cosmochim Acta 48: 2659–2668
Sun W-D, Yang X-Y, Fan W-M, Wu F-Y (2012) Mesozoic large scale magmatism and mineralization in South China: preface. Lithos 150: 1–5
von Quadt A, Erni M, Martinek K, Moll M, Peytcheva I, Heinrich CA (2011) Zircon crystallization and the lifetimes of ore-forming magmatic-hydrothermal systems. Geology 39:731–734
Wang F, Ling M, Ding X, Hu Y, Zhou J, Yang X, Liang H, Fan W, Sun W (2011) Mesozoic large magmatic events and mineralization in SE China; oblique subduction of the Pacific Plate. Int Geol Rev 53:704– 726. doi:10.1080/00206814.2010.503736
Wang Y, Fan B (1987) In: Guo W (ed) Metallogenic map of endogenic ore deposits of China 1:4000000. Cartographic, Beijing
Wu CY, Bai G, Xu LM (1993) Types and distribution of silver ore deposits in China. Miner Deposita 28:223–238
Wu G, Zhang Y (1986) The geochronology of Guangning granitic complex. Guangdong Geol 1:1–22
Zartman RE, Doe BR (1981) Plumbotectonics—the model. Tectonophysics 75:135–162
Zhang Q, Liu J-J, Shao S-X, Liu ZH (2002) An estimate of the lead isotopic compositions of upper mantle and upper crust and implica-tions for the source of lead in the Jinding Pb-Zn deposit in Western Yunnan, China. Geochem J 36:271–287
Zhong L, Liu L, Xia B, Li J, Lin X, Xu L, Lin L (2010) Re-Os geochronology of molybdenite from the Yuanzhuding porphyry Cu-Mo deposit in south China. Resour Geol (Tokyo 1998) 60: 389–396. doi:10.1111/j.1751-3928.2010.00143.x
Zhou X, Sun T, Shen W, Shu L, Niu Y (2006) Petrogenesis of Mesozoic granitoids and volcanic rocks in south China; a response to tectonic evolution. Episodes 29:26–33