HAL Id: hal-00296492
https://hal.archives-ouvertes.fr/hal-00296492
Submitted on 17 Mar 2008
HAL is a multi-disciplinary open access
archive for the deposit and dissemination of
sci-entific research documents, whether they are
pub-lished or not. The documents may come from
teaching and research institutions in France or
abroad, or from public or private research centers.
L’archive ouverte pluridisciplinaire HAL, est
destinée au dépôt et à la diffusion de documents
scientifiques de niveau recherche, publiés ou non,
émanant des établissements d’enseignement et de
recherche français ou étrangers, des laboratoires
publics ou privés.
Aerosol distribution over Europe: a model evaluation
study with detailed aerosol microphysics
B. Langmann, S. Varghese, E. Marmer, E. Vignati, J. Wilson, P. Stier, C.
O’Dowd
To cite this version:
B. Langmann, S. Varghese, E. Marmer, E. Vignati, J. Wilson, et al.. Aerosol distribution over Europe:
a model evaluation study with detailed aerosol microphysics. Atmospheric Chemistry and Physics,
European Geosciences Union, 2008, 8 (6), pp.1591-1607. �hal-00296492�
www.atmos-chem-phys.net/8/1591/2008/ © Author(s) 2008. This work is distributed under the Creative Commons Attribution 3.0 License.
Chemistry
and Physics
Aerosol distribution over Europe: a model evaluation study with
detailed aerosol microphysics
B. Langmann1,*, S. Varghese1, E. Marmer2, E. Vignati2, J. Wilson2, P. Stier3, and C. O’Dowd1
1School of Physics and Centre for Climate & Air Pollution Studies, Environmental Change Institute, National University of
Ireland, Galway, Ireland
2Climate Change Unit, Joint Research Centre, Ispra, Italy
3Atmospheric, Oceanic and Planetary Physics, University of Oxford, Oxford, UK *present affiliation: Institute of Geophysics, University Hamburg, Hamburg, Germany
Received: 22 November 2007 – Published in Atmos. Chem. Phys. Discuss.: 13 December 2007 Revised: 22 February 2008 – Accepted: 25 February 2008 – Published: 17 March 2008
Abstract. This paper summarizes an evaluation of model simulations with a regional scale atmospheric climate-chemistry/aerosol model called REMOTE, which has been extended by a microphysical aerosol module. Model results over Europe are presented and compared with available mea-surements in surface air focusing on the European distribu-tion and variability of primary and secondary aerosols. Ad-ditionally, model results obtained with detailed aerosol mi-crophysics are compared to those based on an aerosol bulk mass approach revealing the impact of dry deposition fluxes on atmospheric burden concentration. An improved determi-nation of elevated ozone and sulfate concentrations could be achieved by considering a diurnal cycle in the anthropogenic emission fluxes. Deviation between modelled and measured organic carbon concentrations can be mainly explained by missing formation of secondary organic aerosols and defi-ciencies in emission data. Changing residential heating prac-tices in Europe, where the use of wood is no longer restricted to rural areas, need to be considered in emission inventories as well as vegetation fire emissions which present a dominant source of organic carbon.
1 Introduction
Tropospheric aerosols have significant effects on human health (e.g. WHO, 2002), environment (e.g. Stoddart et al., 1999) and climate (e.g. Haywood and Boucher, 2000). An improved understanding of anthropogenic and natural emis-sion sources, secondary aerosol formation, modification of the aerosol chemical composition and size distribution is
es-Correspondence to: B. Langmann
sential for efficient emission reduction policies to improve air quality (e.g. Solmon et al., 2006). The aerosol effects on climate due to direct and indirect aerosol radiative forcing are mainly determined by the atmospheric aerosol burden, chemical composition and size distribution (e.g. Dusek et al., 2006). Due to the relative short residence times, tropospheric aerosol undergoes considerable spatial and temporal variabil-ity with inter-annual variabilvariabil-ity strongly dependent on the prevailing meteorological conditions (e.g. Marmer and Lang-mann, 2007).
Until recently, three-dimensional climate models deter-mined mainly aerosol bulk mass distributions with prescribed aerosol size distributions and mixing state (e.g. Feichter et al., 1996; Koch et al., 2006; Marmer and Langmann, 2007) with different degrees of complexity concerning ox-idant availability, aqueous phase chemistry, dry and wet de-position. Major efforts have been made in recent years to improve atmospheric aerosol modeling on the global and re-gional scale. New efficient approaches to determine aerosol chemical composition, size distribution and microphysical interactions with a modal concept (e.g. Ackermann et al., 1998; Vignati et al., 2004) have been incorporated in cli-mate models (e.g. Grell et al., 2005; Lauer et al., 2005; Stier et al., 2005). Sectional aerosol models used in 3-D stud-ies (e.g. Jacobson, 2001, Gong et al., 2003) reach gener-ally a higher accuracy compared with the modal approach (Zhang et al., 1999) but are computationally more demand-ing. We have chosen the modal aerosol microphysical ap-proach of M7 (Vignati et al., 2004) to extend the regional on-line climate-chemistry/aerosol model REMOTE (Langmann, 2000; Marmer and Langmann, 2007). Beside the computa-tional efficiency of the modal approach, the motivation was to develop a regional climate-chemistry/aerosol model com-parable to the global ECHAM5-HAM model (Stier et al.,
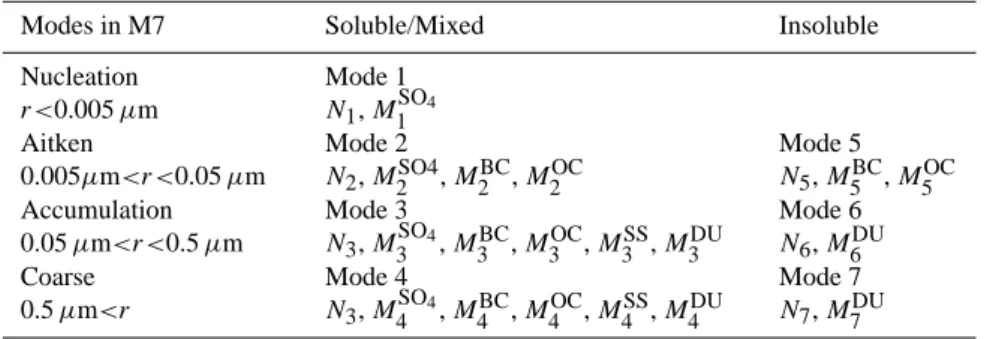
Table 1. Modal structure and properties of M7. Nidenotes the aerosol number of mode i, Mijdenotes the mass of component j in mode i, and r the dry radius.
Modes in M7 Soluble/Mixed Insoluble
Nucleation r<0.005 µm Mode 1 N1, M1SO4 Aitken 0.005µm<r<0.05 µm Mode 2 N2, M2SO4, M2BC, M2OC Mode 5 N5, M5BC, M5OC Accumulation 0.05 µm<r<0.5 µm Mode 3 N3, M3SO4, M3BC, M3OC, M3SS, M3DU Mode 6 N6, M6DU Coarse 0.5 µm<r Mode 4 N3, M4SO4, M4BC, M4OC, M4SS, M4DU Mode 7 N7, M7DU
2005) to be applied for higher resolution studies over specific limited areas of interests. Here we use REMOTE to simulate European wide distributions of sulfate, sea salt, black carbon and primary organic carbon (POC) over Europe. Section 2 describes the model set-up. Model results over Europe, eval-uations against available measurements and discussions are provided in Sect. 3. Section 4 provides conclusions and gives an outlook.
2 Model set-up
The regional three-dimensional on-line climate-chemistry/aerosol model REMOTE (Regional Model with Tracer Extension, http://www.mpimet.mpg.de/en/ wissenschaft/modelle/remote.html) (Langmann, 2000; Marmer and Langmann, 2007) is one of the few regional climate models that determines the physical, photochemical and aerosol state of the model atmosphere at every model time step, thus offering the possibility to consider trace species effects on climate (e.g. Langmann, 2007). The dynamical part of the model is based on the former regional weather forecast system of the German Weather Service (Majewski, 1991). Beside the German Weather Service physical parameterisations, those of the global climate model ECHAM-4 (Roeckner et al., 1996) have been implemented in REMOTE and are used for the current study. After being released in the atmosphere, gas phase and aerosol phase species undergo transport processes (horizontal and vertical advection (Smolarkiewitz, 1983), transport in convective clouds (Tiedtke, 1989), vertical turbulent diffusion (Mellor and Yamada, 1974)) and are removed from the atmosphere by sedimentation, dry and wet deposition.
For the determination of aerosol dynamics and thermody-namics, we implemented the M7 module, which is described in detail in Vignati et al. (2004) and Stier et al. (2005), so that we only provide a brief description here. The aerosol dynamical processes in M7 include nucleation, coagulation and condensation. The aerosol size spectrum is represented
by the superposition of seven log-normal distributions sub-divided into soluble and insoluble coarse, accumulation and aitken modes and an additional soluble nucleation mode (Ta-ble 1). The five aerosol components considered in M7 are sulfate (SO4), black carbon (BC), organic carbon (OC), sea
salt (SS) and mineral dust (DU). These components have ei-ther negligible or low solubility or are treated as an internal mixture of insoluble and soluble compounds. Mixed parti-cles are formed from insoluble partiparti-cles by coagulation and condensation. Each mode can be described by three mo-ments: aerosol number N , number median radius r, and stan-dard deviation σ . Stanstan-dard deviations are prescribed in M7 (Vignati et al., 2004), so that the median radius of each mode can be calculated from the corresponding aerosol number and aerosol mass, which are transported as 25 tracers (Table 1). Thus, the total number of transported trace species in RE-MOTE is 63, with 38 of these participating in photochemical transformations (Langmann, 2000). Photochemical produc-tion and loss in REMOTE is determined by the RADM II chemical scheme (Stockwell et al., 1990) by 163 chemical reactions in the gas phase including a wide range of hydro-carbon degradation reactions. Photolysis rates are calculated as described by Madronich (1986) and Chang et al. (1987). Aqueous phase chemistry processes is implemented accord-ing to Walcek and Taylor (1986). Sulfate production in the aqueous phase is determined dependent on pH via oxidation by H2O2, O3, methylhydrogenperoxide, peroxyacetic acid
and catalysed by Fe3+ and Mn2+. Cloud water pH is de-termined solving iteratively an ion balance which is contin-uously maintained (Walcek and Taylor, 1986). Nitrate and ammonium are not yet considered in the M7 version applied here, however, M7 is flexible to be extended to more com-ponents. Nitrate aerosols are expected to become more im-portant in the future atmosphere due to increase in nitrate precursor emissions and the decline of (NH4)2SO4aerosols
in wide regions of the Earth (Bauer et al., 2007).
Anthropogenic emissions of SOx, NOx, NH3, CO, VOC’s
and PM2.5 obtained from the EMEP emission inventory
as described in Marmer and Langmann (2007). NOx
emis-sions are split into NO (96%) and NO2(4%) emissions.
To-tal VOC emissions are split into VOC classes according to Memmesheimer et al. (1991). For primary anthropogenic aerosol emissions, number mean radius and number concen-tration of the respective size mode is related to the mass con-centration based on Stier et al. (2005). Chemical speciation of PM2.5 emissions into POC (primary organic carbon) and
BC is based on Andersson-Skold and Simpson (2001). We assume 96% of SOxbeing released as SO2 and 4% as
sul-fate from which 50% are attributed to the accumulation and coarse mode, respectively. BC emissions are assumed insol-uble and POC emissions solinsol-uble. Secondary organic aerosol formation is not considered in the current study. In addi-tion to anthropogenic emissions, terrestrial biogenic terpene and isoprene emissions from forests are considered based on Guenther et al. (1991, 1993). For coarse mode sea salt, we use the same approach as described in Stier et al. (2005) with a table look-up for wind speeds between 1 and 40 m/s. The net accumulation sea-spray flux is based on Geever et al. (2005) and is used as an organic-inorganic source func-tion for the mixture of POC and sea salt aerosols. Recent measurements at the Mace Head station at the Atlantic coast of Ireland (O’Dowd et al., 2004; Yoon et al., 2007) have shown that OC contributes a considerable fraction to sea-spray during periods of increased biological activity of the ocean. Further details are given in O’Dowd et al. (2008). For the current application of the REMOTE model over Europe, mineral dust emissions have not been considered.
Dry deposition fluxes for gaseous compounds are deter-mined after Wesley (1989). For aerosol particles, the same size-dependent parameterizations as in the ECHAM5-HAM model (Stier et al., 2005) are used for dry deposition and sedimentation, which are based on Ganzeveld et al. (1998) and Seinfeld and Pandis (1998). Wet deposition is com-puted according to Walcek and Taylor (1986) by integrating the product of the grid-averaged precipitation rate and the mean cloud water concentration which is determined from cloud base (first layer above the surface containing more than 0.001 g/kg liquid water) to cloud top (highest level exceeding an amount of 0.001 g/kg liquid water) for fair weather clouds and from the surface to cloud top for raining clouds. Scav-enging efficiencies are based on Kasper-Giebl et al. (2000) distinguishing between soluble and insoluble aerosols depen-dent on cloud liquid water content. Size dependepen-dent scaveng-ing has not been taken into account until now. In-cloud pro-duced sulfate is distributed to the available pre-existing accu-mulation and coarse mode aerosol particles according to the respective number concentration (Stier et al., 2005).
REMOTE is applied with a time step of 5 min in 0.5◦ hori-zontal resolution and 20 vertical layers of increasing thick-ness between the Earth’s surface and the 10 hPa pressure level using terrain following hybrid pressure-sigma coordi-nates. The prognostic equations are written on an Arakawa-C-grid (Mesinger and Arakawa, 1976). The height of the
lowest layer with prognostic trace species concentration is approximately 40 m, dependent on surface pressure. The model domain covers Europe and the Northeast Atlantic Ocean. REMOTE is initialised at the first time step us-ing meteorological analysis data of the European Centre for Medium Range Weather Forecast (ECMWF), which are up-dated at the lateral boundaries every 6 h and used for nudging the model in the outer 8 grid cells. Trace species concen-tration at the lateral boundaries are prescribed (Langmann, 2000) and held constant throughout the simulation period. Here we analyse results for January and June 2003 to take into account the seasonal variability of meteorological con-ditions, emissions and photochemistry. Beside the standard model simulation, four sensitivity studies have been con-ducted: for June 2003 a) a day-night variability has been in-troduced for the anthropogenic emissions, b) biogenic sions have been increased by a factor of 5, c) forest fire emis-sions have been taken into account and d) a sensitivity study with the aerosol bulk mass approach has been out carried for January and June 2003.
3 Model evaluation and discussion 3.1 Meteorological conditions
Meteorological conditions have a major influence on the dis-tribution of the modelled atmospheric trace species and need to be evaluated carefully. Previous studies with the RE-MOTE model have evaluated the meteorological model sim-ulation results against available measurements (T2m, wind speed and direction, precipitation). The diurnal variability of the meteorological and chemical processes in the plane-tary boundary layer as well as the planeplane-tary boundary layer height and spatial variability could be reproduced by RE-MOTE pretty well over Europe (Langmann, 2000; Lang-mann and Bauer, 2002; LangLang-mann et al., 2003). Two re-cent papers (Marmer and Langmann, 2007; Marmer et al., 2007) investigate the inter-annual variability of aerosol dis-tributions over Europe by using a bulk mass approach. In Fig. 1a monthly precipitation interpolated from satellite and rain gauge measurements by GPCP (www.dwd.de/en/FundE/ Klima/KLIS/int/GPCC/) is shown in 2.5◦ for comparison with REMOTE model results in 0.5◦(Fig. 1b) for approxi-mately the same area. The REMOTE model is able to re-produce the measured precipitation magnitude, spatial pat-tern and seasonality over Europe and the Atlantic Ocean. Note that close to the western lateral model boundary where the major inflow occurs, simulated precipitation is underes-timated. The reason is the missing information about liquid water content in the ECMWF analysis data, which serve as lateral boundary information. The prevailing dry conditions during summer 2003 (e.g. Hodzic et al., 2007) are visible in particular over Southern Europe. The REMOTE model is also able to reasonably determine precipitation measured
January 2003 June 2003
(a)
(b)
(c)
Figure 1: (a) Measured and (b) simulated precipitation by REMOTE during January and
June 2003 in mm/month. (c) REMOTE monthly precipitation at EMEP stations against January 2003: Precipitation 0 50 100 150 200 250 0 50 100 150 200 250 EMEP [m m /m onth] R E M O T E [m m /m o n th ] June 2003: Precipitation 0 50 100 150 200 250 0 50 100 150 200 250 EMEP [m m /m onth] R E M O T E [m m /m o n th ]
Fig. 1. (a) Measured and (b) simulated precipitation by REMOTE during January and June 2003 in mm/month. (c) REMOTE monthly precipitation at EMEP stations against EMEP measurements.
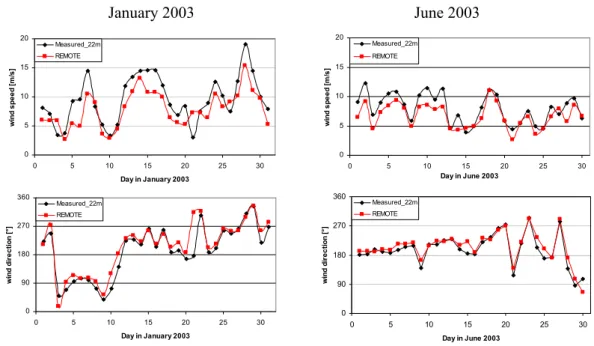
at stations from the EMEP network (http://www.nilu.no/ projects/ccc/emepdata.html), which are located on land ar-eas only (Fig. 1c). Measured and simulated wind speed and direction at the Mace Head observation station (53.1◦N, 9.3◦W) at the Atlantic coast of Ireland are presented in Fig. 2 and show nearly perfect agreement. This is not astonishing as it is not that demanding for the model to reproduce the wind components at a coastal site close to its western and major inflow boundary. (For further Mace Head data see Fig. 6). Slightly lower simulated wind speeds are due to the model
resolution of 0.5◦and a land fraction of approximately 50% in the grid box where the Mace Head site is located, induc-ing more surface friction than over open ocean areas. In the beginning of January 2003, a blocking situation with easterly winds occurred whereas westerly winds prevail during June 2003. During January significantly higher wind speeds were reached compared to June.
January 2003
June 2003
0 90 180 270 360 0 5 10 15 20 25 30 Day in June 2003 w in d d ir e c ti o n [ °] Measured_22m REMOTE 0 90 180 270 360 0 5 10 15 20 25 30 Day in January 2003 w in d d ir e c ti o n [ °] Measured_22m REMOTE 0 5 10 15 20 0 5 10 15 20 25 30 Day in January 2003 w in d s p e e d [ m /s ] Measured_22m REMOTE 0 5 10 15 20 0 5 10 15 20 25 30 Day in June 2003 w in d s p e e d [ m /s ] Measured_22m REMOTEFig. 2. Measured and modeled wind speed and direction at Mace Head (53.1◦N, 9.3◦W) during January and June 2003. Model results out of the first layer in approximately 30 m height are shown.
Table 2. European monthly mean burden, lifetime and sinks.
Species Month 2003 Atmospheric Lifetime Wet Dry Sedimentation
burden deposition deposition
[mg/m2] [days] [mg/m2/month] [mg/m2/month] [mg/m2/month]
[%] [%] [%]
Sea salt Jan 7.9 0.15 1201.9 262.9 129.6
75.4 16.5 8.1 Jun 4.4 0.47 147 24.2 108.4 52.6 8.6 38.8 POC Jan 0.17 0.71 7.1 0.28 0.013 96 3.8 0.2 Jun 0.36 1.5 6.9 0.43 0.058 93.4 5.8 0.8 Sulfate Jan 0.87 0.38 68 0.87 1 97.3 1.3 1.4 Jun 2.3 1.9 34.4 0.91 0.8 95.3 2.5 2.2 BC Jan 0.087 0.98 2.6 0.15 0.003 94.6 5.3 0.1 Jun 0.15 2.9 1.4 0.11 0.003 92.2 7.6 0.2
3.2 Atmospheric burden and lifetime
Atmospheric column burden, lifetime and percentage contri-bution of the three removal processes (wet deposition, dry de-position and sedimentation) are given in Table 2 for January and June 2003, respectively. A pronounced seasonal variabil-ity is determined with considerably shorter life times during
winter with lower column burden for sulfate, BC and OC accompanied by more removal than during summer. Only the winter atmospheric burden of sea salt exceeds the sum-mer burden, while more removal leads to a shorter lifetime than during summer. Compared with the global annual mean lifetimes of aerosols (e.g. Stier et al., 2005), aerosol life-times over Europe during summer are about half. However,
January 2003
June 2003
(a)
(b)
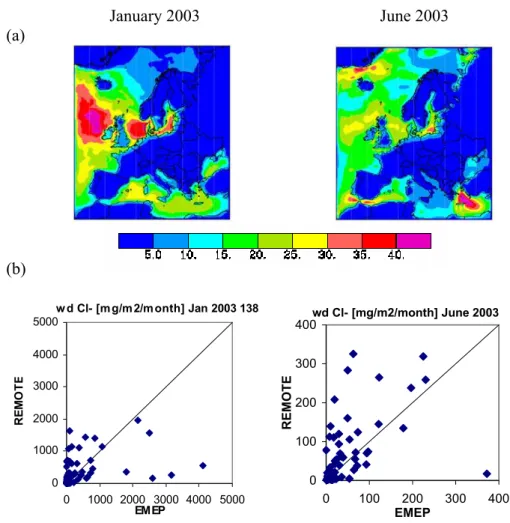
w d Cl- [m g/m 2/m onth] Jan 2003 138 0 1000 2000 3000 4000 5000 0 1000 2000 3000 4000 5000 EMEP R E M O T E wd Cl- [mg/m2/month] June 2003 0 100 200 300 400 0 100 200 300 400 EMEP R EM O T EFig. 3. Sea salt: (a) REMOTE modeled sum of near surface coarse and accumulation mode sea salt in µg/m3during January and June 2003. (b) REMOTE monthly wet depositions of chloride at EMEP stations against EMEP measurements in mg/m2/month with different intervals for January and June 2003 (measured [mg/l] is converted to [mg/m2/month] by multiplication with measured precipitation in [mm/month]).
European mean conditions cannot be directly compared with globally averaged data where over 70% of the total area is made up of ocean and with prominent contributions of the tropical regions. Note that transport across the lateral bound-aries is another removal / source process for limited area models which has not been taken into account here.
3.3 Sea salt
The spatial distribution of modelled sea salt in surface air is illustrated in Fig. 3a as the sum of accumulation and coarse mode sea salt, with the accumulation mode contribut-ing about 10%. Durcontribut-ing January 2003, the highest sea salt concentrations occur over the Northeast Atlantic, west of Ire-land and ScotIre-land, the North Sea and the Baltic Sea. During June 2003, elevated sea salt concentrations are found over the Mediterranean Sea, nearby Greenland and over the Baltic Sea. Transport of sea salt from the ocean to continental ar-eas is relatively small but coastal arar-eas are affected consider-ably. Wet deposition of chloride (Fig. 3b) is approximately
one order of magnitude higher in January compared to June 2003. The REMOTE model fairly well reproduces this sea-sonal variability as well as the variability from low deposi-tion fluxes at inland EMEP sites to the higher ones at the coastal sites. Elevated wet deposition fluxes of NaCl in the Alpine region occur during the winter season because of the use of salt for melting snow on the roads. This source of NaCl is not considered in the model. At the few Norwe-gian and Danish EMEP sites where sodium and/or chloride aerosol concentrations in surface air are measured, the RE-MOTE model overestimates the measured concentrations by a factor of 2–6. It should be emphasized again that this is caused mainly by the coarse mode sea salt particles. 3.4 Sulfur species
In Fig. 4, modelled and measured concentration of SO2and
sulfate and the wet deposition fluxes of sulfate are compared. For modelled sulfate, the contribution of all size modes are considered with the accumulation mode containing the major
January 2003
June 2003
(a)
(b)
(c)
Figure 4: Sulfur species: REMOTE monthly concentration of (a) SO and (b) Sulfate
SO2 [ugS/m3] Jan 2003 RUN138
0 2 4 6 8 0 2 4 6 8 EMEP R EMO T E wd Sulf [mgS/m2/month] June 2003 RUN138 0 50 100 150 200 0 50 100 150 200 EMEP R EM O T E wd Sulf [mgS/m2/month] Jan 2003 138 0 50 100 150 200 0 50 100 150 200 EMEP R EM O T E
Sulf [ugS/m3] June2003 RUN138
0 0.5 1 1.5 2 2.5 0 0.5 1 1.5 2 2.5 EMEP R EM O T E
SULF [ugS/m3] Jan 2003 138
0 0.5 1 1.5 2 2.5 0 0.5 1 1.5 2 2.5 EMEP R EM O T E
SO2 [ugS/m3] June 2003 RUN138
0 2 4 6 8 0 2 4 6 8 EMEP R EM O T E
Fig. 4. Sulfur species: REMOTE monthly concentration of (a) SO2 and (b) Sulfate in [µgS/m3], and (c) sulfate wet deposition in
[mgS/m2/month] at EMEP stations compared against EMEP measurements.
amount of mass. In January, only the elevated SO2
concen-trations are underestimated by the REMOTE, whereas during June a principle overestimation is found. Simulated sulfate is underestimated during both seasons, in particular the ele-vated concentrations. As the wet deposition fluxes of sulfate are reasonably reproduced by REMOTE and enough SO2is
available, sulfate formation in particular during the summer season is supposed to be oxidant limited. To analyse this dependency, we compare modelled and measured concentra-tions of photo-oxidants.
January 2003
June 2003
(a)
(b)
(c)
Figure 5: Photo-oxidants: REMOTE daily concentrations of ozone (a) at noon and (b)
NO2 [ugN/m3] June 2003 RUN138 0 2 4 6 8 10 0 2 4 6 8 10 EMEP R EM O T E
O3 [ug/m3] Jan 2003 12 UTC 138
0 50 100 150 200 0 50 100 150 200 EMEP R EMO T E
O3 [ug/m3] June 2003 12 UTC 138
0 50 100 150 200 0 50 100 150 200 EMEP R EMO T E
O3 [ug/m3] June 2003 0UTC 138
0 50 100 150 200 0 50 100 150 200 EMEP R EMO T E
O3 [ug/m3] Jan 2003 0 UTC 138
0 50 100 150 200 0 50 100 150 200 EMEP R EM O T E
NO2 [ugN/m3] Jan 2003 RUN138
0 2 4 6 8 10 0 2 4 6 8 10 EMEP R EM O T E
Fig. 5. Photo-oxidants: REMOTE daily concentrations of ozone (a) at noon and (b) at midnight in [µg/m3] and (c) monthly concentration of NO2in [µgN/m3] at EMEP stations compared against EMEP measurements.
3.5 Photo-oxidants
Daily noon and midnight ozone concentrations reflect the pronounced diurnal cycle of ozone which is captured well by the REMOTE model simulation (Fig. 5a, b). The mod-elled ozone concentrations during January are in good agree-ment with the measured ones. During June, the elevated O3
concentrations are underestimated by the model. Modelled
NO2concentrations agree reasonably well with the
measure-ments at the EMEP sites (Fig. 5c). Either the availability of VOC limits O3 and sulfate production during summer
or photolysis of NO2 is underestimated resulting in an
in-sufficient catalysis of the NO/NO2 cycle accompanied by
lower photo-oxidant formation. The use of monthly emission data without diurnal variability offers one explanation for the underprediction of elevated ozone concentration during
January 2003 June 2003 (a)
(b)
(c)
BC [ug/m3] Jan 2003 RUN138
0 1 2 3 0 1 2 3 EMEP R E MO T E
BC [ug/m3] June 2003 RUN138
0 1 2 3 0 1 2 3 EMEP R EM O T E 0 0.2 0.4 0.6 0.8 1 0 5 10 15 20 25 30 Day in January 2003 B C [ u g /m 3 ] AE9 REMOTE 138 b t t l ld 0 0.05 0.1 0.15 0.2 0.25 0.3 0 5 10 15 20 25 30 Day in June 2003 B C [ u g /m 3 ] AE9 REMOTE 138 b t t l ld
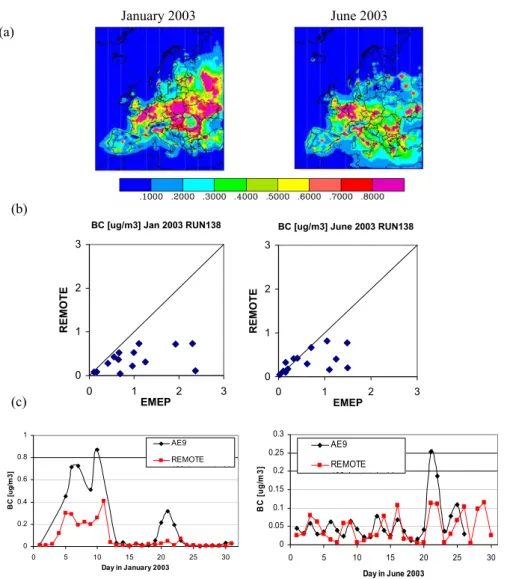
Fig. 6. BC: (a) REMOTE modeled total BC concentration in µg/m3in surface air during January and June 2003. (b) REMOTE monthly BC concentration at EMEP stations against EMEP measurements in µg/m3. (c) Time series of modeled (in red) and measured (in black) BC concentrations at Mace Head.
summer. In a sensitivity study, a simple diurnal variability was included by scaling emissions from 07:00–18:00 UTC by a factor of 1.5 and those from 19:00–06:00 UTC by 0.5, respectively. The resulting ozone concentrations in surface air at noon during June 2003 are modified by max ±5% at the EMEP locations, whereas near surface sulfate concentra-tions are systematically increased at all EMEP staconcentra-tions by 5–12%. These results emphasize that the diurnal variabil-ity of anthropogenic emission fluxes should be considered to reproduce measured photo-oxidants concentrations and the oxidation capacity of the troposphere more realistically. An-other sensitivity study for June 2003 investigates the impact of biogenic VOC emissions. Due to the considerable uncer-tainty (e.g. Simpson et al., 1999) biogenic VOC emissions have been increased by a factor of 5. At noon, near surface ozone concentrations are mainly increased, at several EMEP stations more than 20%. However, near surface sulfate
con-centrations are slightly reduced indicating that under these conditions photo-oxidation formation becomes NOxlimited.
Another possible explanation is that lateral boundary con-centrations are held constant throughout the simulation. By applying a global to mesoscale model chain, Langmann et al. (2003) showed for ozone concentration that the global model dominates the nested higher resolution model results increasingly with height. In addition, convective events cou-ple free troposphere and PBL air masses so that ozone from above is injected into the PBL contributing an amount of 5– 10 ppbv to near-surface ozone in the afternoon hours. The impact of vegetation fire emissions is discussed in the fol-lowing subsection.
(a)
January
2003
June
2003
(b)
OC [ug/m 3] Jan 2003 RUN138
0 0.5 1 1.5 0 5 10 15 EMEP R E M O T E
OC [ug/m 3] June 2003 RUN138
0 1 2 3 4 5 6 0 1 2 3 4 5 6 EMEP R E M O T E
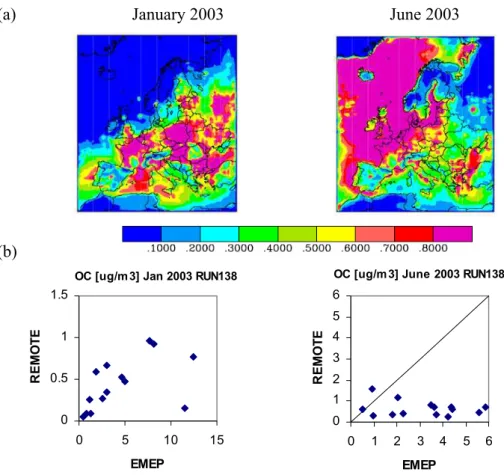
Fig. 7. POC: (a) REMOTE modeled total POC concentration in µg/m3in surface air during January and June 2003. (b) REMOTE monthly POC concentration at EMEP stations against EMEP measurements in µg/m3. Note that for January the y and x-axis are different.
3.6 Carbonaceous aerosols
BC concentrations in surface air show a pronounced seasonal variability (Fig. 6a). During winter, higher concentrations occur over Eastern Europe due to domestic heating and ac-cumulation under high pressure conditions in the planetary boundary layer (PBL). In the Mediterranean area accumu-lation takes place during summer. Measured concentrations of BC exceeding 0.5 µg/m3 are underestimated by the
RE-MOTE model by a factor of about 2 (Fig. 6b). Comparison with observations at Mace Head (Fig. 6c) indicate that RE-MOTE can reproduce the large scale transport of BC from continental Europe towards Mace Head in particular during the beginning of January 2003 under the influence of a high pressure system and easterly winds (Fig. 2). However, el-evated BC concentrations at Mace Head are also underpre-dicted by REMOTE.
REMOTE model results of near surface POC distributions over Europe during January and June 2003 show significant differences over both, the continent and the ocean (Fig. 7). During winter the highest concentrations are determined over Eastern Europe due to domestic heating. Even higher POC concentrations are found during summer in the marine
boundary layer where POC is released together with sea salt – both in the accumulation mode – dependent on wind speed (O’Dowd et al., 2008). This source of POC has not been taken into account before. It offers however one possible explanation for the missing source of OC, e.g. during the ACE-Asia campaign (Heald et al., 2005), where numerical modelling could not reproduce measured OC concentrations. Transport of marine POC from the ocean to continental areas is found to be relatively small but coastal areas are affected considerably. At Mace Head, 0.53 µg/m3OC is measured (Yttri et al., 2007) during June 2003 and 0.62 µ/mg3OC is determined by REMOTE, from which 0.55 µg/m3OC orig-inates from the ocean. Comparisons at the other measure-ments sites participating in the EMEP EC/OC campaign (Yt-tri et al., 2007) reveal significant deviations between mea-sured and modelled OC concentration. During winter, mod-elled concentrations are systematically underpredicted by a factor of 10 whereas during summer no systematic connec-tion between measured and modelled OC concentraconnec-tions can be found.
Until today, modelling of carbonaceous aerosols remains a challenge due to the uncertainties of the various primary and secondary sources. Within the EU project CARBOSOL, a
(a) (b)
Winter: source contribution to OC in %
fossil fuel 4% biogenic 2% SOC non-ff 18% SOC ff 17% wood 59%
Summer: source contribution to OC in %
SOC non-ff 78% biogenic 4% fossil fuel 5% SOC ff 9% wood 4%
Fig. 8. Averaged results of the source apportionment analysis of measured carbonaceous aerosols at five locations in Europe (Gelencser et al., 2007) during (a) winter and (b) summer. (ff: fossil fuel, non-ff: non-fossil fuel).
source apportionment analysis (Gelencser et al., 2007) of car-bonaceous PM2.5 aerosols has been carried out along a
tran-sect of five locations from the Azores to Hungary. The analy-sis distinguishes between carbonaceous aerosols from fossil fuel combustion and from biomass burning as well as pri-mary and secondary organic carbon (SOC). Sampled BC and POC at the five CARBOSOL stations appointed to fossil fuel combustion is found to be in good agreement with REMOTE model results obtained with a bulk aerosol mass approach (Marmer and Langmann, 2007): during winter a mean value of 0.36 µg(C)/m3BC (0.21 µg(C)/m3OC) has been mea-sured compared to 0.30 µg(C)/m3BC (0.24 µg(C)/m3OC) as model result; during summer the mean measured value is 0.32 µg(C)/m3BC (0.19 µg(C)/m3OC) compared to a mean modelled value of 0.23 µg(C)/m3 BC (0.14 µg(C)/m3OC). POC from wood burning is found to contribute almost 90% to the total POC in Aveiro and K-Puszta during winter, and approximately 50% at the other sites during winter and sum-mer (Fig. 8). The surprisingly high contribution of modern carbon burning during winter has also been found by Szidat et al. (2007) who observed an overwhelming impact of car-bonaceous aerosols from residential wood burning on partic-ulate matter in Alpine valleys during winter-time. Until now, only little attention has been paid to residential wood burning because it was assumed to contribute only marginal to the to-tal energy consumption in industrialized Europe. Due to ris-ing fuel prices and the climate change discussion, residential heating is switching from fossil gas and oil burning to wood burning in fireplaces and modern pellet heaters in some Euro-pean countries, while in others peat burning makes an impor-tant contribution to the total energy consumption. Updated emission inventories need to take into account the changing heating practices in Europe and the use of wood burning not only in rural but also in urban areas.
During summer, very high contributions of SOC (more than 70%) from non-fossil sources were found in the CAR-BOSOL samples (Fig. 8) which include SOC from biogenic
emissions from vegetation as well as from vegetation fires. Since we did not yet consider secondary organic aerosol for-mation in the REMOTE/M7 model, the missing SOC ex-plains the modelled underprediction during summer as well as the missing correlation between modelled and measured data. It is however important to mention that the concept of SOC by Gelencer et al. (2007) also includes directly emitted semi-volatile organic compounds at low temperatures, which make a major contribution to observed SOC during winter. In the model, this type of OC aerosol is considered to be pri-mary and its emissions are prescribed by the EMEP emission inventory.
The impact of vegetation fire emissions on the REMOTE results has been analyzed in another sensitivity study for June 2003. In this experiment, we make use of the Global Fire Emissions Database, Version 2 available from http://ess1.ess. uci.edu/∼jranders/data/GFED2/ (van der Werf et al., 2006). During June 2003, vegetation fires contributed 0.4% NOx,
0.8% VOC, 4.6% CO, 2.0% BC and 27.0% POC to the total emissions according to the GFED2 and the EMEP emission inventory. During August 2003, when severe wild fires oc-curred mainly in Portugal, Italy and the Balkan, the POC contribution from wild fires exceeded even 60%. The high POC contribution is in agreement with Novakov et al. (1997) who report that PM2.5 aerosols from wild fires are made up
mainly of OC with only 4–25% BC (dependent on the burn-ing conditions) and an even smaller contribution from inor-ganic species. Hodzic et al. (2007) who did not distinguish between BC and OC estimated that during summer 2003 (August 2003) wild fires in Europe contributed an equiva-lent of 48% (84%) of the total PM2.5 anthropogenic
emis-sions. Tsyro et al. (2007) reported that considering vege-tation fire emissions over Europe during summer 2002 and 2003 reduced the EMEP model underestimation of BC by 4–15% and improved the temporal correlation at most sites affected by fire emissions. Considering the small contribu-tion of BC released from vegetacontribu-tion fires and the cumulative
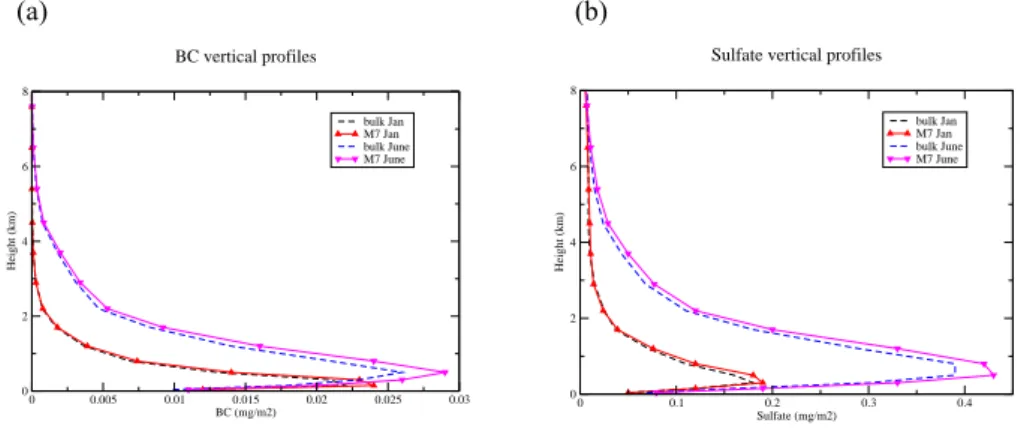
(a) (b) 0 0.005 0.01 0.015 0.02 0.025 0.03 BC (mg/m2) 0 2 4 6 8 Height (km) bulk Jan M7 Jan bulk June M7 June BC vertical profiles 0 0.1 0.2 0.3 0.4 Sulfate (mg/m2) 0 2 4 6 8 Height (km) bulk Jan M7 Jan bulk June M7 June
Sulfate vertical profiles
Fig. 9. European mean vertical distribution of (a) BC and (b) sulfate in mg/m2during January and June 2003 as determined by REMOTE/M7 and the bulk mass approach.
fire intensity at only few locations not necessarily close to the measurement locations, it is understandable that wild fire emissions do not contribute much to the atmospheric BC concentrations. The sensitivity study carried out here for June 2003 shows the highest impact of vegetation fires at the EMEP site Braganca in Portugal, where modelled monthly mean BC concentrations increased by a factor of 1.4, POC by a factor 2.8, followed by Ispra, Italy (BC*1.1, POC*1.5), Illmitz, Austria (POC*1.4) and Aspvreten, Swe-den (POC*1.3). In contrast to Tsyro et al. (2007) and Hodzic et al. (2007) who distributed fire emissions between model vertical layers dependent on fire buoyancy, we released the fire emissions into the first model layer so that the local im-pact close to the fires is most probably too high and the long range transport too small. Despite this simplification, the sensitivity study shows the considerably higher impact of POC emissions from fires on atmospheric OC concen-tration compared to BC concenconcen-trations. It also reveals that taking vegetation fires into account alone does not solve the general underestimation of modelled atmospheric OC: at Braganca, Portugal vegetation fire emissions increased mod-elled OC concentrations from 0.25 µg/m3to 0.71 µg/m3, but 4.2 µg/m3has been measured. The overwhelming contribu-tion of SOC to the total atmospheric OC concentracontribu-tion ac-cording to the measurements at CARBOSOL sites (Gelencer et al., 2007) is the most likely explanation.
4 Bulk aerosol mass approach versus aerosol micro-physics
In this section we compare model results from simulations with the REMOTE model extended by M7 with those ob-tained with the previously used bulk aerosol mass approach (Marmer and Langmann, 2007). In this previous version of REMOTE, we described sulfate and carbonaceous aerosol species only by considering their mass concentration and prescribed aerosol size distribution and mixing state. The
two model versions also differ in their parameterisation of dry deposition and sedimentation. The bulk mass approach uses a combined dry deposition and sedimentation velocity for a prescribed size distribution of sulfate aerosols (Wal-cek et al., 1986) which is applied also for BC and POC. In REMOTE/M7, dry deposition and sedimentation is depen-dent on the aerosol size distribution (see Sect. 2). Size de-pendent scavenging has not been taken into account in RE-MOTE/M7 until now. Both model simulations have been carried out using ECMWF meteorological analysis data and identical chemical data at the lateral boundaries as described in Sect. 2. EMEP emissions data are also identical, however, sea salt emissions and marine POC emissions are not consid-ered when using the aerosol bulk mass approach. Therefore we focus our attention on BC and sulfate.
Modelled European vertical profiles for BC and sulfate determined by REMOTE/M7 and the bulk mass approach are shown in Fig. 9 revealing a pronounced seasonal vari-ability with higher aerosol burden in the entire PBL and the lower free troposphere during summer. REMOTE/M7 deter-mines a higher peak aerosol burden and small increase above this peak compared with the bulk mass approach. During June 2003, REMOTE/M7 determines for BC and sulfate 10% higher European column concentrations and nearly 5% less removal for BC (12% more for sulfate) by wet deposition, dry deposition and sedimentation (Fig. 10). Increased trans-port across the Mediterranean Sea compared with simulation results obtained with the aerosol bulk mass approach occurs for BC whereas accumulation over the Mediterranean area is nearly identical for sulfate, but over the Northern Atlantic and North-eastern Europe higher column concentrations of sulfate are visible. January 2003 simulation results with RE-MOTE/M7 differ from those obtained with the aerosol bulk mass approach by nearly 10% increase in column concen-tration for BC (5% increase in sulfate), but a factor of 1.6 increase in wet deposition, dry deposition and sedimentation for BC and sulfate. We find considerable higher wet depo-sition fluxes with REMOTE/M7 compared with the aerosol
January 2003
June 2003
(a)
BC [mg/m2]
Difference %
(b)
Sulfate [mg/m2]
Difference %
Figure 10: Column concentration of (a) BC and (b) sulfate in mg/m
2during January
and June 2003 and percentage difference between detailed aerosol microphysics and
Fig. 10. Column concentration of (a) BC and (b) sulfate in mg/m2during January and June 2003 and percentage difference between detailed aerosol microphysics and aerosol mass bulk approach.
bulk mass approach (January: factor 1.8; June: factor 1.2), but lower dry deposition fluxes (January: factor 0.6; June: factor 0.3) for BC as well as for sulfate. Even though dry de-position and sedimentation fluxes are small compared with wet deposition fluxes (Table 2), the combined sedimentation and dry deposition velocity of Walcek et al. (1986) can be assumed to overestimate these removal fluxes. As dry depo-sition is a considerable loss process close to the sources be-fore dilution and transport to higher atmospheric levels takes place, higher dry deposition fluxes are consequently associ-ated with decreased long-range transport (Fig. 10) and can explain the differences in model simulation results with RE-MOTE/M7 and the bulk mass approach. Figure 10 also re-veals the differences in transport of BC and sulfate resulting from the differences of release and formation processes for insoluble BC and soluble sulfate.
In summary, the non-linear development of atmospheric concentration dependent on transport, chemical and micro-physical transformation triggered by different removal fluxes are responsible for the differences between REMOTE/M7 and the bulk aerosol mass approach model results. Prin-cipally, the percentage contribution of the individual re-moval processes agrees better with literature values for RE-MOTE/M7 (see Sect. 3.2) than for the bulk mass approach. As dry deposition and sedimentation flux measurements are hardly available, a further evaluation is beyond the scope of this manuscript.
5 Conclusions and outlook
The REMOTE model (Langmann, 2000) extended by the aerosol modal microphysics (Vignati et al., 2004) is able to reasonably reproduce measured meteorological and trace species quantities over Europe, e.g. precipitation, the amount and variability of wet deposition fluxes of sea salt and sul-fate, and trace species concentration in surface air. There are numerous simplifications and sources of uncertainty related to this kind of climate-chemistry/aerosol modelling. Even though we compared only trace species measurements in sur-face air in addition to wet deposition fluxes, we conclude that the major deviation between modelled and measured concen-trations can be explained by deficiencies in used emission data and missing formation of secondary organic aerosols. The following conclusions have been drawn:
– The diurnal variability of anthropogenic emission fluxes should be considered to reproduce measured photo-oxidants concentrations and the oxidation capacity of the troposphere more realistically e.g. by scaling an-thropogenic emissions according to the diurnal cycle of traffic volume (e.g. Memmesheimer et al., 1991). RE-MOTE model results, in particular regarding elevated ozone and sulfate concentrations in near surface air dur-ing summer, are shown to benefit from a simple diurnal cycle introduced to the emission fluxes.
– Measured BC and POC concentrations attributed to fos-sil fuel combustion (Gelencser et al., 2007) have been found to be in good agreement with REMOTE model results (Marmer and Langmann, 2007). However, total BC and OC aerosol concentration are underestimated by REMOTE. During winter, a possible explanation is that current anthropogenic emission inventories tend to underestimate domestic wood burning in Europe. Resi-dential heating practices are changing in Europe and the use of wood burning has increased considerably in re-cent years not only in rural but also in urban areas (Szi-dat et al., 2007) thereby reducing domestic fossil fuel heating. These developments emphasize the need to up-date current anthropogenic emission inventories for Eu-rope.
– During summer, vegetation fire emissions (van der Werf et al., 2006) are another source of photo-oxidants and aerosols in Europe. Compared with anthropogenic emission data from EMEP, vegetation fires release in particular organic carbon aerosols in considerable amounts (27% of the total emissions during June 2003), whereas BC emissions from vegetation fires make up only 2%. Taking into account vegetation fire emissions increased most notably simulated concentrations of OC, but the general underestimation of simulated OC con-centration during summer remains unsolved.
– Considerable OC concentrations are determined in the marine boundary layer during summer when POC is re-leased together with sea salt – both in the accumula-tion mode – dependent on wind speed (O’Dowd et al., 2008). This source of POC has not been taken into ac-count before. It offers however one possible explanation for the missing source of OC in the marine atmosphere, e.g. during the ACE-Asia campaign (Heald et al., 2005), where numerical modelling could not reproduce mea-sured OC concentrations. Transport of marine OC from the ocean to continental areas is found to be relatively small. However coastal areas are affected considerably. – Gelencser et al. (2007) report a contribution of 78% from non fossil fuel SOC to the total OC concentra-tion during summer. The dramatic underestimaconcentra-tion of simulated organic carbon aerosol concentration during summer is clearly due to a still missing secondary or-ganic aerosol formation module in the REMOTE model extended by the aerosol microphysical module M7 (Vi-gnati et al., 2004).
A comparison of simulation results with the REMOTE model extended by M7 with those obtained with the previously used bulk aerosol mass approach (Marmer and Langmann, 2007) revealed the impact of dry deposition fluxes even though they are small compared with wet deposition fluxes. As dry depo-sition is a considerable loss process close to the sources be-fore dilution and transport to higher atmospheric levels takes
place, smaller dry deposition fluxes as determined by RE-MOTE/M7 are consequently associated with increased long-range transport and higher aerosol burden (about 10% in-crease). Modelling of aerosol size distribution and number concentration is not only beneficial for the determination of dry deposition and sedimentation fluxes, but also for esti-mating e.g. the aerosol impact on human health, the aerosol impact on clouds and precipitation and the principal atmo-spheric evolution of primary and secondary aerosols from various sources. Future applications of the REMOTE model extended by the aerosol modal microphysics (Vignati et al., 2004) are planned to focus on SOC formation from terrestrial and marine sources, aerosol-cloud interaction studies, cou-pled ocean-atmosphere biogeochemical modelling and appli-cations over other regions of the Earth.
Acknowledgements. This work has been funded within the EU
project MAP and the German Science Foundation Focus Pro-gramme Quantitative Precipitation Forecast. The authors would like to thank M. Schulz and L. Ganzeveld for the availability of their Fortran codes.
Edited by: V.-M. Kerminen
References
Ackermann, I. J., Hass, H., Memmesheimer, M., Ebel, A., Binkowski, F. S., and Shankar, U.: Modal aerosol dynamics model for Europe: Development and first applications, Atmos. Environ., 32, 2981–2999, 1998.
Andersson-Skold, Y. and Simpson, D.: Secondary organic aerosol formation in northern Europe: A model study, J. Geophys. Res., 106, 7357–7374, 2001.
Bauer, S. E., Koch, D., Unger, N., Metzger, S. M., Shindell, D. T., and Streets, D. G.: Nitrate aerosols today and in 2030: a global simulation including aerosols and tropospheric ozone, At-mos. Chem. Phys., 7, 5043–5059, 2007,
http://www.atmos-chem-phys.net/7/5043/2007/.
Chang, J. S., Brost, R. A., Isaksen, I. S. A., Madronich, S., Middle-ton, P., Stockwell, W. R., and Walcek, C. J.: A three-dimensional Eulerian acid deposition model: physical concepts and formula-tion, J. Geophys. Res., 92, 1481–14700, 1987.
Dusek, U., Frank, G. P., Hildebrandt, L., Curtius, J., Schneider, J., Walter, S., Chand, D., Drewnick, F., Hings, S., Jung, D., Bor-rmann, S., and Andreae, M. O.: Size matters more than chemistry for the cloud-nucleating ability of aerosol particles, Science, 312, 1375–1378, 2006.
Feichter, J., Kjellstroem, E., Rohde, H., Dentener, F., Lelieveld, J., and Roelofs, G.-J.: Simulation of the tropospheric sulfure cy-cle in a global climate model, Atmos. Environ., 30, 1693–1707, 1996.
Ganzeveld, L., Lelieveld, J., and Roelofs, G.-J.: Dry deposition pa-rameterization of sulfur oxides in a chemistry and general circu-lation model, J. Geophys. Res., 103, 5679–5694, 1998.
Geever, M., O’Dowd, C., van Ekeren, S., Flanagan, R., Nilsson, E. D., de Leeuw, G., and Rannik, ¨U.: Sub-micron sea-spray fluxes, Geophys. Res. Lett., 32, L15810, doi:10.1029/2005GL023081, 2005.
Gelencser, A., May, B., Simpson, D., Sanchez-Ochoa, A., Kasper-Giebl, A., Puxbaum, H., Caseiro, A., Pio C., and Legrand, M.: Source apportionment of PM2.5 organic aerosol over Europe: primary/secondary, natural/anthropogenic, fossil/biogenic origin, J. Geophys. Res., 112, D23S04, doi:10.1029/2006JD008094, 2007.
Gong, S. L., Barrie, L. A., Blanchet, J. P., von Salzen, K., Lohmann, U., Lesins, G., Spacek, L., Zhang, L. M., Girard, E., Lin, H., Leaitch, R., Leighton, H., Chylek, P., and Huang, P.: Canadian Aerosol Module: A size-segregated simulation of atmospheric aerosol processes for climate and air quality mod-els: 1. Model development, J. Geophys. Res., 108, D4007, doi:10.1029/2001JD002002, 2003.
Grell, G. A., Peckham, S. E., Schmitz, R., McKeen, S. A., Frost, G., Skamarock, W. C., and Eder, B.: Fully coupled “online chem-istry” within the WRF model, Atmos. Environ., 39, 6957–6975, 2005.
Guenther, A. B., R. K. Moson and R. Fall: Isoprene and monoter-pene emission rate variability: observations with eucalyptus and emission rate algorithm development, J. Geophys. Res., 96, 10 799–10 808, 1991.
Guenther, A. B., Zimmermann, P. R., Harley, P. C., Monson, R. K., and Fall, R.: Isoprene and monoterpene emission rate variability: model evaluations and sensitivity analysis, J. Geophys. Res. 98, 12 609–12 617, 1993.
Haywood, J. and Boucher, O.: Estimates of the direct and indirect radiative forcing due to tropospheric aerosols: A review, Rev. Geophys., 38, 513–543, 2000.
Heald, C. L., Jacob, D. J., Park, R. J., Russell, L. M., Hu-bert, B. J., Seinfeld, J. H., Liao, H., and Weber, R. J.: A large organic aerosol source in the free troposphere miss-ing from current models, Geophys. Res. Lett., 32, L18809, doi:10.1029/2005GL023831, 2005.
Hodzic, A., Madronich, S., Bohn, B., Massie, S., Menut, L., and Wiedinmeyer, C.: Wildfire particulate matter in Europe during summer 2003: meso-scale modeling of smoke emissions, trans-port and radiative effects, Atmos. Chem. Phys., 7, 4043–4064, 2007,
http://www.atmos-chem-phys.net/7/4043/2007/.
Jacobson, M. Z.: Global direct radiative forcing due to multicompo-nent anthropogenic and natural aerosols, J. Geophys. Res., 106, 1551–1568, 2001.
Kasper-Giebl, A., Koch, A., Hitzenberger, R., and Puxbaum, H.: Scavenging efficiency of aerosol carbon and sulfate in super-cooled clouds at Mt. Sonnblick (3106 m a.s.l, Austria), J. Atmos. Chem., 35, 33–46, 2000.
Koch, D., Schmidt, G. A., and Field, C. V.: Sulfur, sea salt and radionuclide aerosols in GISS Model, J. Geophys. Res., 111, DO6206, doi:10.1029JD005550, 2006.
Langmann, B.: Numerical modelling of regional scale transport and photochemistry directly together with meteorological processes, Atmos. Environ., 34, 3585–3598, 2000.
Langmann, B. and Bauer, S. E.: On the importance of reliable ini-tial and boundary concentrations of ozone for regional scale air pollution modelling, J. Atmos. Chem. 42, 71–90, 2002. Langmann, B., Bauer, S. E., and Bey, I.: The influence of
the global photochemical composition of the troposphere on European summer smog, Part I: Application of a global to mesoscale model chain, J. Geophys. Res., 108(D4), 4146,
doi:10.1029/2002JD002072, 2003.
Langmann, B.: A model study of the smoke-haze in-fluence on clouds and warm precipitation formation in Indonesia 1997/1998, Atmos. Environ., 41, 6838–6852, doi:10.1016/j.atmosenv.2007.04.050, 2007.
Lauer, A., Hendricks, J., Ackermann, I. J., Schell, B., Hass, H., and Metzger, S.: Simulating aerosol microphysics with the ECHAM/MADE GCM – Part I: Model description and compari-son with observations, Atmos. Chem. Phys., 5, 3251–3276, 2005, http://www.atmos-chem-phys.net/5/3251/2005/.
Madronich, S: Photodissociation in the atmosphere. I: Actinic flux and the effect of ground refections and clouds, J. Geophys. Res., 92, 9740–9752, 1987.
Majewski, D.: The Europa Modell of the Deutscher Wetterdienst, Seminar Proceedings ECMWF, 2, 147–191, 1991.
Marmer E. and Langmann, B.: Aerosol modelling over Europe Part I: Inter-annual variability of aerosol distribution, J. Geophys. Res., 112, D23S15, doi:10.1029/2006JD008113, 2007. Marmer, E., Langmann, B., Hungersh¨ofer, K., and Trautmann, T.:
Regional aerosol modelling Part II: Inter-annual variability of aerosol direct radiative forcing over Europe, J. Geophys. Res., 112, D23S16, doi:10.129/2006JD008040, 2007.
Mellor, B. and Yamada, T.: A hierarchy of turbulence closure mod-els for planetary boundary layers, J. Atmos. Sci., 31, 1791–1806, 1974.
Memmesheimer, M., Tippke, J., Ebel, A., Hass, H., Jacobs, H. J., and Laube, M.: On the use of EMEP emission inventories for European scale air pollution modelling with the EURAD model, EMEP Workshop on photooxidant modelling for long-range transport in relation to abatment strategies, Berlin, Ger-many, 16–19 April 1991, 307–324, 1991.
Mesinger, F. and Arakawa, A.: Numerical methods used in atmo-spheric models. GARP Public. Ser., 17, 1–64, 1976.
Novakov, T., Cachier, H., Clark, J. S., Gaudichet, A., Macko, S., and Masclet, P.: Characterization of particulate products of biomass combustion, in Sediment Records of Biomass Burn-ing and Global Change, edited by: Clak, J. S., Cachier, H., Goldammer, J. G., and Stocks, B., NATO ASI Series, Springer Verlag, Berlin, Germany, 1997.
O’Dowd, C., Facchini, M. C., Cavalli, F., Ceburnis, D., Mircea, M., Decesari, S., Fuzzi, S., Yoon, Y. J., and Putaud, J. P.: Biogenically-driven organic contribution to marine aerosol, Na-ture, 432, 7009, doi:10.1038/nature02959, 2004.
O’Dowd, C., Langmann, B., Varghese, S., Scannell, C., Cebur-nis, D., and Facchini, M. C.: A combined organic-inorganic sea-spray source function, Geophys. Res. Lett., 35, L01801, doi:10.1029/2007GL030331, 2008.
Roeckner, E., Arpe, K., Bengtsson, L., Christoph, M., Claussen, M., D¨umenil, L., Esch, M., Giorgetta, M., Schlese, U., and Schulzweida, U.: The atmospheric general circulation model ECHAM-4: Model description and simulation of present-day cli-mate, MPI-Report No. 218, Max Planck Institute for Meteorol-ogy, Hamburg, Germany, 1996.
Seinfeld, J. H. and Pandis, S. N.: Atmospheric chemistry and physics: from air pollution to climate change, Wiley-Interscience, 1998.
Simpson, D., Winiwarter, W., Boerjesson, G., Cinderby, S., Fer-reiro, A. Guenther, A., Hewitt, C. N., Janson, R., Khalil, M. A. K., Owen, S., Pierce, T. E., Puxbaum, H., Shearer, M., Skiba,
U., Steinbrecher, R., Tarrason L., and Oequist, M. G.: Invento-rying emissions from nature in Europe, J. Geophys. Res., 104, 8113–8152, 1999.
Smolarkiewitz, P. K.: A simple positive definite advection scheme with small implicit diffusion, Mon. Weather Rev., 111, 479–486, 1983.
Solmon, F., Giorgi F., and Liousse, C.: Aerosol modelling for re-gional climate studies: application to anthropogenic particles and evaluation over a European/African domain, Tellus, 58B, 51–72, 2006.
Stier, P., Feichter, J., Kinne, S., Kloster, S., Vignati, E., Wilson, J., Ganzeveld, L., Tegen, I., Werner, M., Balkanski, Y., Schulz, M., Boucher, O., Minikin, A., and Petzold, A.: The aerosol-climate model ECHAM5-HAM, Atmos. Chem. Phys., 5, 1125– 1156, 2005,
http://www.atmos-chem-phys.net/5/1125/2005/.
Stockwell, W. R., Middleton, P., Chang, J. S., and Tang, X.: The second generation regional acid deposition model: chemical mechanism for regional air quality modelling, J. Geophys. Res., 95, 16 343–16 367, 1990.
Stoddart, J., Jeffries, D., Lkewolle, A., Clair, T., Dillon, P., Driscoll, C., Fortius, M., Johannsessen, M., Kahl, J., Kellogg, J., Kemp., A., Mannio, J., Montheith, D., Murdoch, P., Patrick, S., Rebs-dorf, A., and Skjelkv, B.: Regional trends in aquatic recovery from acidification in North America and Europe, Nature, 401, 575–578, 1999.
Szidat, S., Prevot, A. S. H., Sandradewi, J., Alfarra, M. R., Synal, H.-A., Wacker, L., and Baltenschlager, U.: Dominant impact of residential wood burning on particulate matter in Alpine valleys during winter, Geophys. Res. Lett., 34, L05820, doi:10.1029/2006GL028325, 2007.
Tiedtke, M.: A comprehensive mass flux scheme for cumulus pa-rameterisation in large-scale models, Mon. Weather Rev., 117, 1778–1800, 1989.
Tsyro, S., Simpson, D., Tarrason, L., Klimont, Z., Kupi-ainen, K., Pio C., and Yttri, K. E.: Modelling of elemen-tal carbon over Europe, J. Geophys. Res., 112, D23S19, doi:10.1029/2006JD008164, 2007.
Van der Werf, G. R., Randerson, J. T., Giglio, L., Collatz, G. J., Kasibhatla, P. S., and Arellano Jr., A. F.: Interannual variability in global biomass burning emissions from 1997 to 2004, Atmos. Chem. Phys., 6, 3423–3441, 2006,
http://www.atmos-chem-phys.net/6/3423/2006/.
Vignati, E., Wilson, J., and Stier, P.: M7: An efficient size-resolved aerosol microphysics module for large-scale aerosol transport models, J. Geophys. Res., 109, D22202, doi:10.1029/2003JD004485, 2004.
WHO: World Health Report 2002, Tech. Rep., World Health Or-ganisation, Genova 2002.
Walcek, C. J. and Taylor, G. R.: A theoretical method for comput-ing vertical distributions of acidity and sulfate production within cumulus clouds, J. Atmos. Sci., 43, 339–355, 1986.
Walcek, C. J., Brost, R. A., Chang, J. S., and Wesley, M. L.: SO2, Sulfate and HNO3deposition velocities computed using regional
landuse and meteorological data, Atmos. Environ., 20, 946–964, 1986.
Wesley, M. L.: Parameterization of surface resistances to gaseous dry deposition in regional-sclae numerical models, Atmos. Env-iron., 23, 1293–1304, 1989.
Yoon, Y. J., Ceburnis, D., Cavalli, F., Jourdan, O., Putaud, J. P., Facchini, M. C., Decesari, S., Fuzzi, S., Jennings, S. G., and O’Dowd, C.: Seasonal characteristics of the physico-chemical properties of North Atlantc marine aerosols, J. Geophys. Res., 112, D04206, doi:10.1029/2005JD007044, 2007.
Yttri, K. E., Aas, W., Bjerke, A., Ceburnis, D., Dye, C., Emblico, L., Facchini, M. C., Forster, C., Hanssen, J. E., Hannsson, H. C., Jennings, S. G., Maenhaut, W., Putaud, J. P., and Torseth, K.: El-emental and organic carbon in PM10: A one year measurement campaign within the European Monitoring and Evaluations Pro-gramme EMEP, Atmos. Chem. Phys., 7, 5711–5725, 2007, http://www.atmos-chem-phys.net/7/5711/2007/.
Zhang, Y., Seigneur, C., Seinfeld, J. H., Jacobson, M. Z., and Binkowsky, F. S.: Simulation of aerosol dynamics: A compar-ative review of algorithms used in air quality models, Aerosol Sci. Technol., 31, 487–514, 1999.