HAL Id: hal-00303211
https://hal.archives-ouvertes.fr/hal-00303211
Submitted on 13 Dec 2007HAL is a multi-disciplinary open access
archive for the deposit and dissemination of sci-entific research documents, whether they are pub-lished or not. The documents may come from teaching and research institutions in France or abroad, or from public or private research centers.
L’archive ouverte pluridisciplinaire HAL, est destinée au dépôt et à la diffusion de documents scientifiques de niveau recherche, publiés ou non, émanant des établissements d’enseignement et de recherche français ou étrangers, des laboratoires publics ou privés.
Aerosol distribution over Europe: a model evaluation
study with detailed aerosol microphysics
B. Langmann, S. Varghese, E. Marmer, E. Vignati, J. Wilson, P. Stier, C.
O’Dowd
To cite this version:
B. Langmann, S. Varghese, E. Marmer, E. Vignati, J. Wilson, et al.. Aerosol distribution over Europe: a model evaluation study with detailed aerosol microphysics. Atmospheric Chemistry and Physics Discussions, European Geosciences Union, 2007, 7 (6), pp.17893-17926. �hal-00303211�
ACPD
7, 17893–17926, 2007 European aerosol distribution – model evaluation B. Langmann et al. Title Page Abstract Introduction Conclusions References Tables Figures ◭ ◮ ◭ ◮ Back CloseFull Screen / Esc
Printer-friendly Version
Interactive Discussion
EGU
Atmos. Chem. Phys. Discuss., 7, 17893–17926, 2007 www.atmos-chem-phys-discuss.net/7/17893/2007/ © Author(s) 2007. This work is licensed
under a Creative Commons License.
Atmospheric Chemistry and Physics Discussions
Aerosol distribution over Europe:
a model evaluation study with detailed
aerosol microphysics
B. Langmann1,*, S. Varghese1, E. Marmer2, E. Vignati2, J. Wilson2, P. Stier3, and C. O’Dowd1
1
School of Physics and Centre for Climate & Air Pollution Studies, Environmental Change Institute, National University of Ireland, Galway, Ireland
2
Climate Change Unit, Joint Research Centre, Ispra, Italy
3
Atmospheric, Oceanic and Planetary Physics, University of Oxford, Oxford, UK
*
present affiliation: Institute of Geophysics, University Hamburg, Hamburg, Germany Received: 22 November 2007 – Accepted: 28 November 2007 – Published: 13 December 2007
ACPD
7, 17893–17926, 2007 European aerosol distribution – model evaluation B. Langmann et al. Title Page Abstract Introduction Conclusions References Tables Figures ◭ ◮ ◭ ◮ Back CloseFull Screen / Esc
Printer-friendly Version
Interactive Discussion
EGU Abstract
This paper summarizes an evaluation of model simulations with a regional scale atmo-spheric climate-chemistry/aerosol model called REMOTE, which has been extended by a microphysical aerosol module. Model results over Europe are presented and com-pared with available measurements in surface air focusing on the European distribution
5
and variability of primary and secondary aerosols. Additionally, model results obtained with detailed aerosol microphysics are compared to those based on an aerosol bulk mass approach revealing the impact of dry deposition fluxes on atmospheric burden concentration. An improved determination of elevated ozone and sulfate concentra-tions could be achieved by considering a diurnal cycle in the anthropogenic emission
10
fluxes. Deviation between modelled and measured organic carbon concentrations can be mainly explained by missing formation of secondary organic aerosols and deficien-cies in emission data. Changing residential heating practices in Europe, where the use of wood is no longer restricted to rural areas, need to be considered in emission inven-tories as well as vegetation fire emissions which present a dominant source of organic
15
carbon.
1 Introduction
Tropospheric aerosols have significant effects on human health (e.g. WHO, 2002), en-vironment (e.g. Stoddart et al., 1999) and climate (e.g. Haywood and Boucher, 2000). An improved understanding of anthropogenic and natural emission sources, secondary
20
aerosol formation, modification of the aerosol chemical composition and size distribu-tion is essential for efficient emission reducdistribu-tion policies to improve air quality (e.g. Sol-mon et al., 2006). The aerosol effects on climate due to direct and indirect aerosol radiative forcing are mainly determined by the atmospheric aerosol burden, chemical composition and size distribution (e.g. Dusek et al., 2006). Due to the relative short
25
ACPD
7, 17893–17926, 2007 European aerosol distribution – model evaluation B. Langmann et al. Title Page Abstract Introduction Conclusions References Tables Figures ◭ ◮ ◭ ◮ Back CloseFull Screen / Esc
Printer-friendly Version
Interactive Discussion
EGU
variability with inter-annual variability strongly dependent on the prevailing meteorolog-ical conditions (e.g. Marmer and Langmann, 2007).
Until recently, three-dimensional climate models determined mainly aerosol bulk mass distributions with prescribed aerosol size distributions and mixing state (e.g. Feichter et al., 1996; Koch et al., 2006; Marmer and Langmann, 2007) with
dif-5
ferent degrees of complexity concerning oxidant availability, aqueous phase chemistry, dry and wet deposition. Major efforts have been made in recent years to improve atmo-spheric aerosol modeling on the global and regional scale. New efficient approaches to determine aerosol chemical composition, size distribution and microphysical inter-actions with a modal concept (e.g. Ackermann et al., 1998; Vignati et al., 2004) have
10
been incorporated in climate models (e.g. Grell et al., 2005; Lauer et al., 2005; Stier et al., 2005). Sectional aerosol models used in 3-D studies (e.g. Jacobson, 2001, Gong et al., 2003) reach generally a higher accuracy compared with the modal approach (Zhang et al., 1999) but are computationally more demanding. We have chosen the modal aerosol microphysical approach of M7 (Vignati et al., 2004) to extend the
re-15
gional on-line climate-chemistry/aerosol model REMOTE (Langmann, 2000; Marmer and Langmann, 2007). Beside the computational efficiency of the modal approach, the motivation was to develop a regional climate-chemistry/aerosol model comparable to the global ECHAM5-HAM model (Stier et al., 2005) to be applied for higher resolution studies over specific limited areas of interests. Here we use REMOTE to simulate
Eu-20
ropean wide distributions of sulfate, sea salt, black carbon and primary organic carbon (POC) over Europe. Section 2 describes the model set-up. Model results over Europe, evaluations against available measurements and discussions are provided in Sect. 3. Section 4 provides conclusions and gives an outlook.
2 Model set-up
25
The regional three-dimensional on-line climate-chemistry/aerosol model REMOTE (Regional Model with Tracer Extension, http://www.mpimet.mpg.de/en/wissenschaft/
ACPD
7, 17893–17926, 2007 European aerosol distribution – model evaluation B. Langmann et al. Title Page Abstract Introduction Conclusions References Tables Figures ◭ ◮ ◭ ◮ Back CloseFull Screen / Esc
Printer-friendly Version
Interactive Discussion
EGU
modelle/remote.html) (Langmann, 2000; Marmer and Langmann, 2007) is one of the few regional climate models that determines the physical, photochemical and aerosol state of the model atmosphere at every model time step, thus offering the possibility to consider trace species effects on climate (e.g. Langmann, 2007). The dynamical part of the model is based on the former regional weather forecast system of the German
5
Weather Service (Majewski, 1991). Beside the German Weather Service physical pa-rameterisations, those of the global climate model ECHAM-4 (Roeckner et al., 1996) have been implemented in REMOTE and are used for the current study. After being released in the atmosphere, gas phase and aerosol phase species undergo transport processes (horizontal and vertical advection, transport in convective clouds, vertical
10
turbulent diffusion – for more details see Langmann, 2000) and are removed from the atmosphere by sedimentation, dry and wet deposition.
For the determination of aerosol dynamics and thermodynamics, we implemented the M7 module, which is described in detail in Vignati et al. (2004) and Stier et al. (2005), so that we only provide a brief description here. The aerosol dynamical
15
processes in M7 include nucleation, coagulation and condensation. The aerosol size spectrum is represented by the superposition of seven log-normal distributions subdi-vided into soluble and insoluble coarse, accumulation and aitken modes and an ad-ditional soluble nucleation mode (Table 1). The five aerosol components considered in M7 are sulfate (SO4), black carbon (BC), organic carbon (OC), sea salt (SS) and
20
mineral dust (DU). These components have either negligible or low solubility or are treated as an internal mixture of insoluble and soluble compounds. Mixed particles are formed from insoluble particles by coagulation and condensation. Each mode can be described by three moments: aerosol number N, number median radius r, and stan-dard deviation σ. Stanstan-dard deviations are prescribed in M7 (Vignati et al., 2004), so
25
that the median radius of each mode can be calculated from the corresponding aerosol number and aerosol mass, which are transported as 25 tracers (Table 1). Thus, the to-tal number of transported trace species in REMOTE is 63, with 38 of these participating in photochemical transformations (Langmann, 2000).
ACPD
7, 17893–17926, 2007 European aerosol distribution – model evaluation B. Langmann et al. Title Page Abstract Introduction Conclusions References Tables Figures ◭ ◮ ◭ ◮ Back CloseFull Screen / Esc
Printer-friendly Version
Interactive Discussion
EGU
Anthropogenic emissions of SOx, NOx, NH3, CO, VOC’s and PM2.5 obtained from the EMEP emission inventory (http://webdab.emep.int/) are prescribed as monthly fluxes as described in Marmer and Langmann (2007). NOx emissions are split into NO (96%) and NO2 (4%) emissions. Total VOC emissions are split into VOC classes according to Memmesheimer et al. (1991). For primary anthropogenic aerosol
emis-5
sions, number mean radius and number concentration of the respective size mode is related to the mass concentration based on Stier et al. (2005). Chemical speciation of PM2.5 emissions into POC (primary organic carbon) and BC is based on
Andersson-Skold and Simpson (2001). We assume 96% of SOx being released as SO2 and
4% as sulfate from which 50% are attributed to the accumulation and coarse mode,
10
respectively. BC emissions are assumed insoluble and POC emissions soluble. In ad-dition to anthropogenic emissions, terrestrial biogenic terpene and isoprene emissions from forests (Langmann, 2000) are considered. For coarse mode sea salt, we use the same approach as described in Stier et al. (2005) with a table look-up for wind speeds between 1 and 40 m/s. The net accumulation sea-spray flux is based on Geever et
15
al. (2005) and is used as an organic-inorganic source function for the mixture of POC and sea salt aerosols. Recent measurements at the Mace Head station at the At-lantic coast of Ireland (O’Dowd et al., 2004; Yoon et al., 2007) have shown that OC contributes a considerable fraction to sea-spray during periods of increased biological activity of the ocean. Further details are given in O’Dowd et al. (2007). For the current
20
application of the REMOTE model over Europe, mineral dust emissions have not been considered.
Dry deposition fluxes for gaseous compounds are determined after Wesley (1989). For aerosol particles, the same size-dependent parameterizations as in the ECHAM5-HAM model (Stier et al., 2005) are used for dry deposition and sedimentation, which
25
are based on Ganzeveld et al. (1998) and Seinfeld and Pandis (1998). Wet depo-sition is computed according to Walcek and Taylor (1986) by integrating the prod-uct of the grid-averaged precipitation rate and the mean cloud water concentra-tion which is determined from cloud base (first layer above the surface containing
ACPD
7, 17893–17926, 2007 European aerosol distribution – model evaluation B. Langmann et al. Title Page Abstract Introduction Conclusions References Tables Figures ◭ ◮ ◭ ◮ Back CloseFull Screen / Esc
Printer-friendly Version
Interactive Discussion
EGU
more than 0.001 g/kg liquid water) to cloud top (highest level exceeding an amount of 0.001 g/kg liquid water) for fair weather clouds and from the surface to cloud top for raining clouds. Scavenging efficiencies are based on Kasper-Giebl et al. (2000) distinguishing between soluble and insoluble aerosols dependent on cloud liquid wa-ter content. Size dependent scavenging has not been taken into account until now.
5
In-cloud produced sulfate is distributed to the available pre-existing accumulation and coarse mode aerosol particles according to the respective number concentration (Stier et al., 2005).
REMOTE is applied with 20 vertical layers of increasing thickness between the Earth’s surface and the 10 hPa pressure level using terrain following hybrid
pressure-10
sigma coordinates. The model domain covers Europe and the Northeast Atlantic Ocean. REMOTE is initialised at the first time step using meteorological analysis data of the European Centre for Medium Range Weather Forecast (ECMWF), which are updated at the lateral boundaries every 6h and used for nudging the model in the outer 8 grid cells. Trace species concentration at the lateral boundaries are prescribed
15
(Langmann, 2000) and held constant throughout the simulation period. Here we anal-yse results for January and June 2003 to take into account the seasonal variability of meteorological conditions, emissions and photochemistry. Beside the standard model simulation, four sensitivity studies have been conducted: for June 2003 a) a day-night variability has been introduced for the anthropogenic emissions, b) biogenic emissions
20
have been increased by a factor of 5, c) forest fire emissions have been taken into ac-count and d) a sensitivity study with the aerosol bulk mass approach has been carried for January and June 2003.
ACPD
7, 17893–17926, 2007 European aerosol distribution – model evaluation B. Langmann et al. Title Page Abstract Introduction Conclusions References Tables Figures ◭ ◮ ◭ ◮ Back CloseFull Screen / Esc
Printer-friendly Version
Interactive Discussion
EGU 3 Model evaluation and discussion
3.1 Meteorological conditions
Meteorological conditions have a major influence on the distribution of the modelled atmospheric trace species and need to be evaluated carefully. In Fig. 1a monthly precipitation interpolated from satellite and rain gauge measurements by GPCP
5
(www.dwd.de/en/FundE/Klima/KLIS/int/GPCC/) is shown in 2.5◦ for comparison with
REMOTE model results in 0.5◦ (Fig. 1b) for approximately the same area. The RE-MOTE model is able to reproduce the measured precipitation magnitude, spatial pat-tern and seasonality over Europe and the Atlantic Ocean. Note that close to the western lateral model boundary where the major inflow occurs, simulated
precipi-10
tation is underestimated. The reason is the missing information about liquid wa-ter content in the ECMWF analysis data, which serve as lawa-teral boundary informa-tion. The prevailing dry conditions during summer 2003 (e.g. Hodzic et al., 2007) are visible in particular over Southern Europe. The REMOTE model is also able to reasonably determine precipitation measured at stations from the EMEP network
15
(http://www.nilu.no/projects/ccc/emepdata.html), which are located on land areas only
(Fig. 1c). Measured and simulated wind speed and direction at the Mace Head obser-vation station (53.1◦N, 9.3◦W) at the Atlantic coast of Ireland are presented in Fig. 2
and show nearly perfect agreement. This is not astonishing as it is not that demanding for the model to reproduce the wind components at a coastal site close to its western
20
and major inflow boundary. (For further Mace Head data see Fig. 6). Slightly lower simulated wind speeds are due to the model resolution of 0.5◦ and a land fraction of approximately 50% in the grid box where the Mace Head site is located, inducing more surface friction than over open ocean areas. In the beginning of January 2003, a blocking situation with easterly winds occurred whereas westerly winds prevail during
25
June 2003. During January significantly higher wind speeds were reached compared to June.
ACPD
7, 17893–17926, 2007 European aerosol distribution – model evaluation B. Langmann et al. Title Page Abstract Introduction Conclusions References Tables Figures ◭ ◮ ◭ ◮ Back CloseFull Screen / Esc
Printer-friendly Version
Interactive Discussion
EGU
3.2 Atmospheric burden and lifetime
Atmospheric column burden, lifetime and percentage contribution of the three removal processes (wet deposition, dry deposition and sedimentation) are given in Table 2 for January and June 2003, respectively. A pronounced seasonal variability is determined with considerably shorter life times during winter with lower column burden for sulfate,
5
BC and OC accompanied by more removal than during summer. Only the winter at-mospheric burden of sea salt exceeds the summer burden, while more removal leads to a shorter lifetime than during summer. Compared with the global annual mean life-times of aerosols (e.g. Stier et al., 2005), aerosol lifelife-times over Europe during summer are about half. However, European mean conditions cannot be directly compared with
10
globally averaged data where over 70% of the total area is made up of ocean and with prominent contributions of the tropical regions. Note that transport across the lateral boundaries is another removal / source process for limited area models which has not been taken into account here.
3.3 Sea salt
15
The spatial distribution of modelled sea salt in surface air is illustrated in Fig. 3a as the sum of accumulation and coarse mode sea salt, with the accumulation mode con-tributing about 10%. During January 2003, the highest sea salt concentrations occur over the Northeast Atlantic, west of Ireland and Scotland, the North Sea and the Baltic Sea. During June 2003, elevated sea salt concentrations are found over the
Mediter-20
ranean Sea, nearby Greenland and over the Baltic Sea. Transport of sea salt from the ocean to continental areas is relatively small but coastal areas are affected consid-erably. Wet deposition of chloride (Fig. 3b) is approximately one order of magnitude higher in January compared to June 2003. The REMOTE model fairly well reproduces this seasonal variability as well as the variability from low deposition fluxes at inland
25
EMEP sites to the higher ones at the coastal sites. Elevated wet deposition fluxes of NaCl in the Alpine region occur during the winter season because of the use of salt for
ACPD
7, 17893–17926, 2007 European aerosol distribution – model evaluation B. Langmann et al. Title Page Abstract Introduction Conclusions References Tables Figures ◭ ◮ ◭ ◮ Back CloseFull Screen / Esc
Printer-friendly Version
Interactive Discussion
EGU
melting snow on the roads. This source of NaCl is not considered in the model. At the few Norwegian and Danish EMEP sites where sodium and/or chloride aerosol concen-trations in surface air are measured, the REMOTE model overestimates the measured concentrations by a factor of 2–6. It should be emphasized again that this is caused mainly by the coarse mode sea salt particles.
5
3.4 Sulfur species
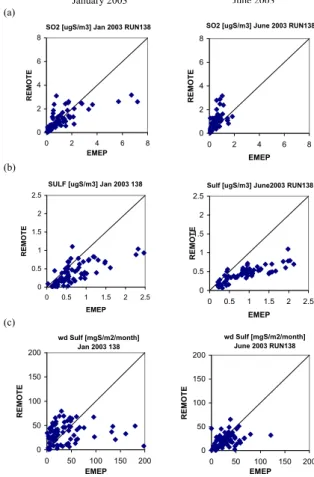
In Fig. 4, modelled and measured concentration of SO2 and sulfate and the wet
de-position fluxes of sulfate are compared. For modelled sulfate, the contribution of all size modes are considered with the accumulation mode containing the major amount of mass. In January, only the elevated SO2concentrations are underestimated by the 10
REMOTE, whereas during June a principle overestimation is found. Simulated sul-fate is underestimated during both seasons, in particular the elevated concentrations. As the wet deposition fluxes of sulfate are reasonably reproduced by REMOTE and enough SO2 is available, sulfate formation in particular during the summer season is supposed to be oxidant limited. To analyse this dependency, we compare modelled
15
and measured concentrations of photo-oxidants.
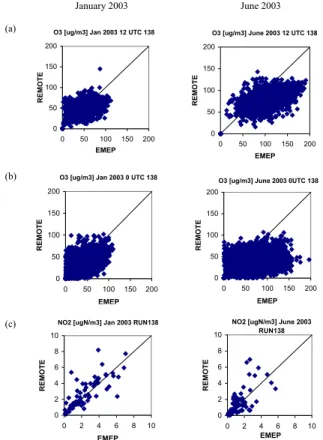
3.5 Photo-oxidants
Daily noon and midnight ozone concentrations reflect the pronounced diurnal cycle of ozone which is captured well by the REMOTE model simulation (Fig. 5a, b). The modelled ozone concentrations during January are in good agreement with the
mea-20
sured ones. During June, the elevated O3 concentrations are underestimated by the model. Modelled NO2concentrations agree reasonably well with the measurements at
the EMEP sites (Fig. 5c). Either the availability of VOC limits O3 and sulfate
produc-tion during summer or photolysis of NO2 is underestimated resulting in an insufficient catalysis of the NO/NO2 cycle accompanied by lower photo-oxidant formation. The
25
ACPD
7, 17893–17926, 2007 European aerosol distribution – model evaluation B. Langmann et al. Title Page Abstract Introduction Conclusions References Tables Figures ◭ ◮ ◭ ◮ Back CloseFull Screen / Esc
Printer-friendly Version
Interactive Discussion
EGU
underprediction of elevated ozone concentration during summer. In a sensitivity study, a simple diurnal variability was included by scaling emissions from 07:00–18:00 UTC by a factor of 1.5 and those from 19:00–06:00 UTC by 0.5, respectively. The resulting ozone concentrations in surface air at noon during June 2003 are modified by max ±5% at the EMEP locations, whereas near surface sulfate concentrations are
system-5
atically increased at all EMEP stations by 5–12%. These results emphasize that the diurnal variability of anthropogenic emission fluxes should be considered to reproduce measured photo-oxidants concentrations and the oxidation capacity of the troposphere more realistically. Another sensitivity study for June 2003 investigates the impact of biogenic VOC emissions. Due to the considerable uncertainty (e.g. Simpson et al.,
10
1999) biogenic VOC emissions have been increased by a factor of 5. At noon, near surface ozone concentrations are mainly increased, at several EMEP stations more than 20%. However, near surface sulfate concentrations are slightly reduced indicat-ing that under these conditions photo-oxidation formation becomes NOx limited. The impact of vegetation fire emissions is discussed in the following subsection.
15
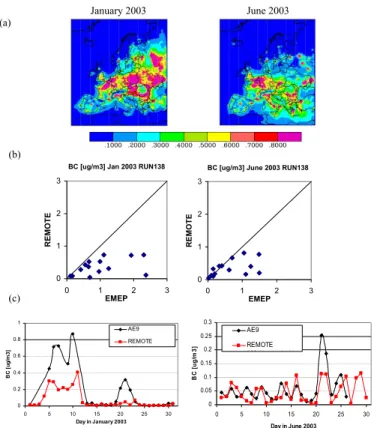
3.6 Carbonaceous aerosols
BC concentrations in surface air show a pronounced seasonal variability (Fig. 6a). During winter, higher concentrations occur over Eastern Europe due to domestic heat-ing and accumulation under high pressure conditions in the planetary boundary layer (PBL). In the Mediterranean area accumulation takes place during summer. Measured
20
concentrations of BC exceeding 0.5 µg/m3are underestimated by the REMOTE model by a factor of about 2 (Fig. 6b). Comparison with observations at Mace Head (Fig. 6c) indicate that REMOTE can reproduce the large scale transport of BC from continental Europe towards Mace Head in particular during the beginning of January 2003 under the influence of a high pressure system and easterly winds (Fig. 2). However, elevated
25
BC concentrations at Mace Head are also underpredicted by REMOTE.
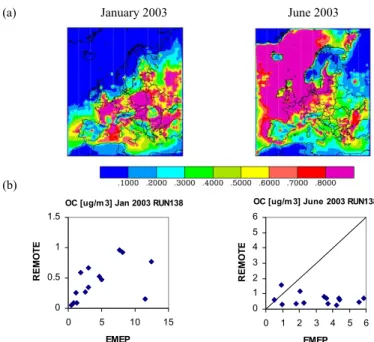
REMOTE model results of near surface POC distributions over Europe during Jan-uary and June 2003 show significant differences over both, the continent and the ocean
ACPD
7, 17893–17926, 2007 European aerosol distribution – model evaluation B. Langmann et al. Title Page Abstract Introduction Conclusions References Tables Figures ◭ ◮ ◭ ◮ Back CloseFull Screen / Esc
Printer-friendly Version
Interactive Discussion
EGU
(Fig. 7). During winter the highest concentrations are determined over Eastern Europe due to domestic heating. Even higher POC concentrations are found during summer in the marine boundary layer where POC is released together with sea salt – both in the accumulation mode – dependent on wind speed (O’Dowd et al., 2007). This source of POC has not been taken into account before. It offers however one possible
expla-5
nation for the missing source of OC, e.g. during the ACE-Asia campaign (Heald et al., 2005), where numerical modelling could not reproduce measured OC concentrations. Transport of marine POC from the ocean to continental areas is found to be relatively small but coastal areas are affected considerably. At Mace Head, 0.53 µg/m3OC is measured (Yttri et al., 2007) during June 2003 and 0.62 µ/mg3OC is determined by
10
REMOTE, from which 0.55 µg/m3OC originates from the ocean. Comparisons at the other measurements sites participating in the EMEP EC/OC campaign (Yttri et al., 2007) reveal significant deviations between measured and modelled OC concentra-tion. During winter, modelled concentrations are systematically underpredicted by a factor of 10 whereas during summer no systematic connection between measured and
15
modelled OC concentrations can be found.
Until today, modelling of carbonaceous aerosols remains a challenge due to the un-certainties of the various primary and secondary sources. Within the EU project CAR-BOSOL, a source apportionment analysis (Gelencser et al., 2007) of carbonaceous PM2.5 aerosols has been carried out along a transect of five locations from the Azores
20
to Hungary. The analysis distinguishes between carbonaceous aerosols from fossil fuel combustion and from biomass burning as well as primary and secondary organic carbon (SOC). Sampled BC and POC at the five CARBOSOL stations appointed to fossil fuel combustion is found to be in good agreement with REMOTE model results obtained with a bulk aerosol mass approach (Marmer and Langmann, 2007):
dur-25
ing winter a mean value of 0.36 µg(C)/m3BC (0.21 µg(C)/m3OC) has been measured compared to 0.30 µg(C)/m3BC (0.24 µg(C)/m3OC) as model result; during summer the mean measured value is 0.32 µg(C)/m3BC (0.19 µg(C)/m3OC) compared to a mean modelled value of 0.23 µg(C)/m3 BC (0.14 µg(C)/m3OC). POC from wood burning is
ACPD
7, 17893–17926, 2007 European aerosol distribution – model evaluation B. Langmann et al. Title Page Abstract Introduction Conclusions References Tables Figures ◭ ◮ ◭ ◮ Back CloseFull Screen / Esc
Printer-friendly Version
Interactive Discussion
EGU
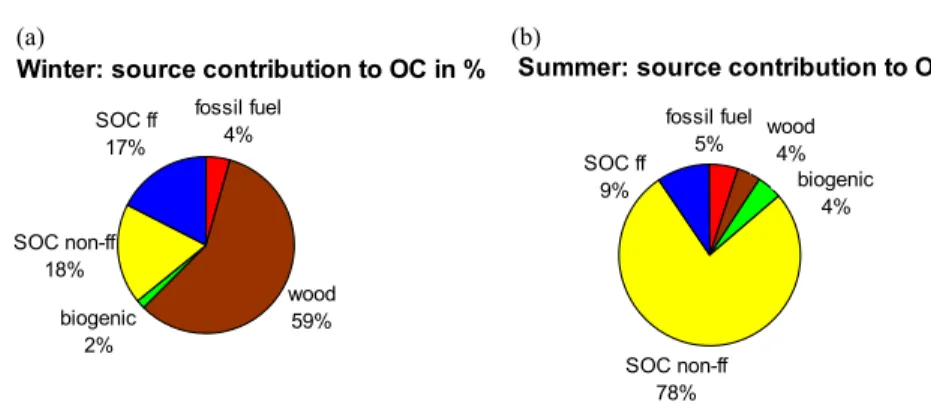
found to contribute almost 90% to the total POC in Aveiro and K-Puszta during win-ter, and approximately 50% at the other sites during winter and summer (Fig. 8). The surprisingly high contribution of modern carbon burning during winter has also been found by Szidat et al. (2007) who observed an overwhelming impact of carbonaceous aerosols from residential wood burning on particulate matter in Alpine valleys during
5
winter-time. Until now, only little attention has been paid to residential wood burning because it was assumed to contribute only marginal to the total energy consumption in industrialized Europe. Due to rising fuel prices and the climate change discussion, res-idential heating is switching from fossil gas and oil burning to wood burning in fireplaces and modern pellet heaters in some European countries, while in others peat burning
10
make in important contribution to the total energy consumption. Updated emission in-ventories need to take into account the changing heating practices in Europe and the use of wood burning not only in rural but also in urban areas.
During summer, very high contributions of SOC (more than 70%) from non-fossil sources were found in the CARBOSOL samples (Fig. 8) which include SOC from
bio-15
genic emissions from vegetation as well as from vegetation fires. Since we did not yet consider secondary organic aerosol formation in the REMOTE/M7 model, the miss-ing SOC explains the modelled underprediction durmiss-ing summer as well as the missmiss-ing correlation between modelled and measured data. It is however important to mention that the concept of SOC by Gelencer et al. (2007) also includes directly emitted
semi-20
volatile organic compounds at low temperatures, which make a major contribution to observed SOC during winter. In the model, this type of OC aerosol is considered to be primary and its emissions are prescribed by the EMEP emission inventory.
The impact of vegetation fire emissions on the REMOTE results has been ana-lyzed in another sensitivity study for June 2003. In this experiment, we make use
25
of the Global Fire Emissions Database, Version 2 available from http://ess1.ess.uci.
edu/∼jranders/data/GFED2/ (van der Werf et al., 2006). During June 2003, vegetation
fires contributed 0.4% NOx, 0.8% VOC, 4.6% CO, 2.0% BC and 27.0% POC to the total emissions according to the GFED2 and the EMEP emission inventory. During August
ACPD
7, 17893–17926, 2007 European aerosol distribution – model evaluation B. Langmann et al. Title Page Abstract Introduction Conclusions References Tables Figures ◭ ◮ ◭ ◮ Back CloseFull Screen / Esc
Printer-friendly Version
Interactive Discussion
EGU
2003, when severe wild fires occurred mainly in Portugal, Italy and the Balkan, the POC contribution from wild fires exceeded even 60%. The high POC contribution is in agreement with Novakov et al. (1997) who report that PM2.5 aerosols from wild fires are made up mainly of OC with only 4–25% BC (dependent on the burning conditions) and an even smaller contribution from inorganic species. Hodzic et al. (2007) who
5
did not distinguish between BC and OC estimated that during summer 2003 (August 2003) wild fires in Europe contributed an equivalent of 48% (84%) of the total PM2.5 anthropogenic emissions. Tsyro et al. (2007) reported that considering vegetation fire emissions over Europe during summer 2002 and 2003 reduced the EMEP model un-derestimation of BC by 4–15% and improved the temporal correlation at most sites
10
affected by fire emissions. Considering the small contribution of BC released from vegetation fires and the cumulative fire intensity at only few locations not necessarily close to the measurement locations, it is understandable that wild fire emissions do not contribute much to the atmospheric BC concentrations. The sensitivity study carried out here for June 2003 shows the highest impact of vegetation fires at the EMEP site
15
Braganca in Portugal, where modelled monthly mean BC concentrations increased by a factor of 1.4, POC by a factor 2.8, followed by Ispra, Italy (BC*1.1, POC*1.5), Illmitz, Austria (POC*1.4) and Aspvreten, Sweden (POC*1.3). In contrast to Tsyro et al. (2007) and Hodzic et al. (2007) who distributed fire emissions between model vertical layers dependent on fire buoyancy, we released the fire emissions into the first model layer
20
so that the local impact close to the fires is most probably too high and the long range transport too small. Despite this simplification, the sensitivity study shows the consid-erably higher impact of POC emissions from fires on atmospheric OC concentration compared to BC concentrations. It also reveals that taking vegetation fires into ac-count alone does not solve the general underestimation of modelled atmospheric OC:
25
at Braganca, Portugal vegetation fire emissions increased modelled OC concentrations from 0.25 µg/m3 to 0.71 µg/m3, but 4.2 µg/m3has been measured. The overwhelming contribution of SOC to the total atmospheric OC concentration according to the mea-surements at CARBOSOL sites (Gelencer et al., 2007) is the most likely explanation.
ACPD
7, 17893–17926, 2007 European aerosol distribution – model evaluation B. Langmann et al. Title Page Abstract Introduction Conclusions References Tables Figures ◭ ◮ ◭ ◮ Back CloseFull Screen / Esc
Printer-friendly Version
Interactive Discussion
EGU 4 Bulk aerosol mass approach versus aerosol microphysics
In this section we compare model results from simulations with the REMOTE model ex-tended by M7 with those obtained with the previously used bulk aerosol mass approach (Marmer and Langmann, 2007). In this previous version of REMOTE, we described sul-fate and carbonaceous aerosol species only by considering their mass concentration
5
and prescribed aerosol size distribution and mixing state. The two model versions also differ in their parameterisation of dry deposition and sedimentation. The bulk mass ap-proach uses a combined dry deposition and sedimentation velocity for a prescribed size distribution of sulfate aerosols (Walcek et al., 1986) which is applied also for BC and POC. In REMOTE/M7, dry deposition and sedimentation is dependent on the aerosol
10
size distribution (see Sect. 2). Size dependent scavenging has not been taken into ac-count in REMOTE/M7 until now. Both model simulations have been carried out using ECMWF meteorological analysis data and identical chemical data at the lateral bound-aries as described in Sect. 2. EMEP emissions data are also identical, however, sea salt emissions and marine POC emissions are not considered when using the aerosol
15
bulk mass approach. Therefore we focus our attention on BC and sulfate.
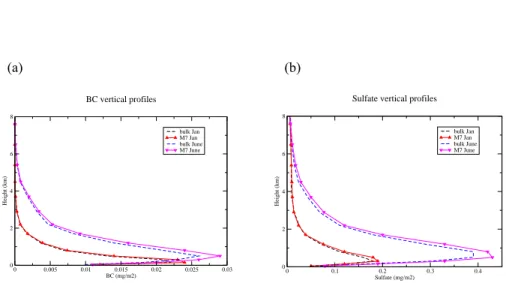
Modelled European vertical profiles for BC and sulfate determined by REMOTE/M7 and the bulk mass approach are shown in Fig. 9 revealing a pronounced seasonal variability with higher aerosol burden in the entire PBL and the lower free troposphere during summer. REMOTE/M7 determines a higher peak aerosol burden and small
in-20
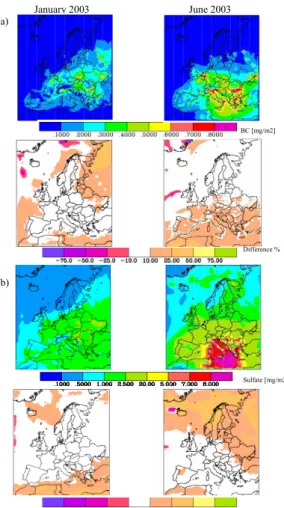
crease above this peak compared with the bulk mass approach. During June 2003, REMOTE/M7 determines for BC and sulfate 10% higher European column concentra-tions and nearly 5% less removal for BC (12% more for sulfate) by wet deposition, dry deposition and sedimentation (Fig. 10). Increased transport across the Mediterranean Sea compared with simulation results obtained with the aerosol bulk mass approach
25
occurs for BC whereas accumulation over the Mediterranean area is nearly identical for sulfate, but over the Northern Atlantic and North-eastern Europe higher column con-centrations of sulfate are visible. January 2003 simulation results with REMOTE/M7
dif-ACPD
7, 17893–17926, 2007 European aerosol distribution – model evaluation B. Langmann et al. Title Page Abstract Introduction Conclusions References Tables Figures ◭ ◮ ◭ ◮ Back CloseFull Screen / Esc
Printer-friendly Version
Interactive Discussion
EGU
fer from those obtained with the aerosol bulk mass approach by nearly 10% increase in column concentration for BC (5% increase in sulfate), but a factor of 1.6 increase in wet deposition, dry deposition and sedimentation for BC and sulfate. We find considerable higher wet deposition fluxes with REMOTE/M7 compared with the aerosol bulk mass approach (Jan: factor 1.8; June: factor 1.2), but lower dry deposition fluxes (Jan: factor
5
0.6; June: factor 0.3) for BC as well as for sulfate. Even though dry deposition and sedi-mentation fluxes are small compared with wet deposition fluxes (Table 2), the combined sedimentation and dry deposition velocity of Walcek et al. (1986) can be assumed to overestimate these removal fluxes. As dry deposition is a considerable loss process close to the sources before dilution and transport to higher atmospheric levels takes
10
place, higher dry deposition fluxes are consequently associated with decreased long-range transport (Fig. 10) and can explain the differences in model simulation results with REMOTE/M7 and the bulk mass approach. Figure 10 also reveals the differences in transport of BC and sulfate resulting from the differences of release and formation processes for insoluble BC and soluble sulfate.
15
In summary, the non-linear development of atmospheric concentration dependent on transport, chemical and microphysical transformation triggered by different removal fluxes are responsible for the differences between REMOTE/M7 and the bulk aerosol mass approach model results. Principally, the percentage contribution of the individual removal processes agrees better with literature values for REMOTE/M7 (see Sect. 3.2)
20
than for the bulk mass approach. As dry deposition and sedimentation flux measure-ments are hardly available, a further evaluation is beyond the scope of this manuscript.
5 Conclusions and outlook
The REMOTE model (Langmann, 2000) extended by the aerosol modal microphysics (Vignati et al., 2004) is able to reasonably reproduce measured meteorological and
25
trace species quantities over Europe, e.g. precipitation, the amount and variability of wet deposition fluxes of sea salt and sulfate, and trace species concentration in surface
ACPD
7, 17893–17926, 2007 European aerosol distribution – model evaluation B. Langmann et al. Title Page Abstract Introduction Conclusions References Tables Figures ◭ ◮ ◭ ◮ Back CloseFull Screen / Esc
Printer-friendly Version
Interactive Discussion
EGU
air. There are numerous simplifications and sources of uncertainty related to this kind of climate-chemistry/aerosol modelling. Even though we compared only trace species measurements in surface air in addition to wet deposition fluxes, we conclude that the major deviation between modelled and measured concentrations can be explained by deficiencies in used emission data and missing formation of secondary organic
5
aerosols. The following conclusions have been drawn:
– The diurnal variability of anthropogenic emission fluxes should be considered to
reproduce measured photo-oxidants concentrations and the oxidation capacity of the troposphere more realistically e.g. by scaling anthropogenic emissions ac-cording to the diurnal cycle of traffic volume (e.g. Memmesheimer et al., 1991).
10
REMOTE model results, in particular regarding elevated ozone and sulfate con-centrations in near surface air during summer, are shown to benefit from a simple diurnal cycle introduced to the emission fluxes.
– Measured BC and POC concentrations attributed to fossil fuel combustion
(Ge-lencser et al., 2007) have been found to be in good agreement with REMOTE
15
model results (Marmer and Langmann, 2007). However, total BC and OC aerosol concentration are underestimated by REMOTE. During winter, a possible expla-nation is that current anthropogenic emission inventories tend to underestimate domestic wood burning in Europe. Residential heating practices are changing in Europe and the use of wood burning has increased considerably in recent years
20
not only in rural but also in urban areas (Szidat et al., 2007) thereby reducing domestic fossil fuel heating. These developments emphasize the need to update current anthropogenic emission inventories for Europe.
– During summer, vegetation fire emissions (van der Werf et al., 2006) are
an-other source of photo-oxidants and aerosols in Europe. Compared with
anthro-25
pogenic emission data from EMEP, vegetation fires release in particular organic carbon aerosols in considerable amounts (27% of the total emissions during June 2003), whereas BC emissions from vegetation fires make up only 2%. Taking
ACPD
7, 17893–17926, 2007 European aerosol distribution – model evaluation B. Langmann et al. Title Page Abstract Introduction Conclusions References Tables Figures ◭ ◮ ◭ ◮ Back CloseFull Screen / Esc
Printer-friendly Version
Interactive Discussion
EGU
into account vegetation fire emissions increased most notably simulated concen-trations of OC, but the general underestimation of simulated OC concentration during summer remains unsolved.
– Considerable OC concentrations are determined in the marine boundary layer
during summer when POC is released together with sea salt – both in the
accu-5
mulation mode – dependent on wind speed (O’Dowd et al., 2007). This source of POC has not been taken into account before. It offers however one possible explanation for the missing source of OC in the marine atmosphere, e.g. during the ACE-Asia campaign (Heald et al., 2005), where numerical modelling could not reproduce measured OC concentrations. Transport of marine OC from the
10
ocean to continental areas is found to be relatively small. However coastal areas are affected considerably.
– Gelencser et al. (2007) report a contribution of 78% from non fossil fuel SOC
to the total OC concentration during summer. The dramatic underestimation of simulated organic carbon aerosol concentration during summer is clearly due to a
15
still missing secondary organic aerosol formation module in the REMOTE model extended by the aerosol microphysical module M7 (Vignati et al., 2004).
A comparison of simulation results with the REMOTE model extended by M7 with those obtained with the previously used bulk aerosol mass approach (Marmer and Lang-mann, 2007) revealed the impact of dry deposition fluxes even though they are small
20
compared with wet deposition fluxes. As dry deposition is a considerable loss process close to the sources before dilution and transport to higher atmospheric levels takes place, smaller dry deposition fluxes as determined by REMOTE/M7 are consequently associated with increased long-range transport and higher aerosol burden (about 10% increase). Modelling of aerosol size distribution and number concentration is not only
25
beneficial for the determination of dry deposition and sedimentation fluxes, but also for estimating e.g. the aerosol impact on human health, the aerosol impact on clouds and precipitation and the principal atmospheric evolution of primary and secondary
ACPD
7, 17893–17926, 2007 European aerosol distribution – model evaluation B. Langmann et al. Title Page Abstract Introduction Conclusions References Tables Figures ◭ ◮ ◭ ◮ Back CloseFull Screen / Esc
Printer-friendly Version
Interactive Discussion
EGU
aerosols from various sources. Future applications of the REMOTE model extended by the aerosol modal microphysics (Vignati et al., 2004) are planned to focus on SOC formation from terrestrial and marine sources, aerosol-cloud interaction studies, cou-pled ocean-atmosphere biogeochemical modelling and applications over other regions of the Earth.
5
Acknowledgements. This work has been funded within the EU project MAP and the German
Science Foundation Focus Programme Quantitative Precipitation Forecast. The authors would like to thank M. Schulz and L. Ganzeveld for the availability of their Fortran codes.
References
Ackermann, I. J., Hass, H., Memmesheimer, M., Ebel, A., Binkowski, F. S., and Shankar, U.:
10
Modal aerosol dynamics model for Europe: Development and first applications, Atmos. Env-iron., 32, 2981–2999, 1998.
Andersson-Skold, Y. and Simpson, D.: Secondary organic aerosol formation in northern Eu-rope: A model study, J. Geophys. Res., 106, 7357–7374, 2001.
Dusek, U., Frank, G. P., Hildebrandt, L., Curtius, J., Schneider, J., Walter, S., Chand, D.,
15
Drewnick, F., Hings, S., Jung, D., Borrmann, S., and Andreae, M. O.: Size matters more than chemistry for the cloud-nucleating ability of aerosol particles, Science, 312, 1375–1378, 2006.
Feichter, J., Kjellstroem, E., Rohde, H., Dentener, F., Lelieveld, J., and Roelofs, G.-J.: Simula-tion of the tropospheric sulfure cycle in a global climate model, Atmos. Environ., 30, 1693–
20
1707, 1996.
Ganzeveld L., Lelieveld, J., and Roelofs, G.-J.: Dry deposition parameterization of sulfur oxides in a chemistry and general circulation model, J. Geophys. Res., 103, 5679–5694, 1998. Geever, M., O’Dowd, C., van Ekeren, S., Flanagan, R., Nilsson, E. D., de Leeuw, G., and
Ran-nik, ¨U.: Sub-micron sea-spray fluxes, Geophys. Res. Lett., 32, doi: 10.1029/2005GL023081,
25
2005.
Gelencser, A., May, B., Simpson, D., Sanchez-Ochoa, A., Kasper-Giebl, A., Puxbaum, H., Caseiro, A., Pio C., and Legrand, M.: Source apportionment of PM2.5 organic aerosol over
ACPD
7, 17893–17926, 2007 European aerosol distribution – model evaluation B. Langmann et al. Title Page Abstract Introduction Conclusions References Tables Figures ◭ ◮ ◭ ◮ Back CloseFull Screen / Esc
Printer-friendly Version
Interactive Discussion
EGU
Europe: primary/secondary, natural/anthropogenic, fossil/biogenic origin, J. Geophys. Res., 112, D23S04, doi:10.1029/2006JD008094, 2007.
Gong, S. L., Barrie, L. A., Blanchet, J. P., von Salzen, K., Lohmann, U., Lesins, G., Spacek, L., Zhang, L. M., Girard, E., Lin, H., Leaitch, R., Leighton, H., Chylek, P., and Huang, P.: Canadian Aerosol Module: A size-segregated simulation of atmospheric aerosol processes
5
for climate and air quality models: 1. Model development, J. Geophys. Res., 108, D4007, doi:10.1029/2001JD002002, 2003.
Grell, G. A., Peckham, S. E., Schmitz, R., McKeen, S. A., Frost, G., Skamarock, W. C., and Eder, B.: Fully coupled “online chemistry” within the WRF model, Atmos. Environ., 39, 6957– 6975, 2005.
10
Haywood, J. and Boucher, O.: Estimates of the direct and indirect radiative forcing due to tropospheric aerosols: A review, Rev. of Geoph., 38, 513–543, 2000.
Heald, C. L., Jacob, D. J., Park, R. J., Russell, L. M., Hubert, B. J., Seinfeld, J. H., Liao, H., and Weber, R. J.: A large organic aerosol source in the free troposphere missing from current models, Geophys. Res. Lett., 32, L18809, doi:10.1029/2005GL023831, 2005.
15
Hodzic, A., Madronich, S., Bohn, B., Massie, S., Menut, L., and Wiedinmeyer, C.: Wildfire par-ticulate matter in Europe during summer 2003: meso-scale modeling of smoke emissions, transport and radiative effects, Atmos. Chem. Phys., 7, 4043–4064, 2007,
http://www.atmos-chem-phys.net/7/4043/2007/.
Jacobson, M. Z.: Global direct radiative forcing due to multicomponent anthropogenic and
20
natural aerosols, J. Geophys. Res., 106, 1551–1568, 2001.
Kasper-Giebl, A., Koch, A., Hitzenberger, R., and Puxbaum, H.: Scavenging efficiency of aerosol carbon and sulfate in super-cooled clouds at Mt. Sonnblick (3106 m a.s.l, Austria), J. Atmos. Chem., 35, 33–46, 2000.
Koch, D., Schmidt, G. A., and Field, C. V.: Sulfur, sea salt and radionuclide aerosols in GISS
25
Model, J. Geophys. Res., 111, DO6206, doi:10.1029JD005550, 2006.
Langmann, B.: Numerical modelling of regional scale transport and photochemistry directly together with meteorological processes, Atmos. Environ., 34, 3585–3598, 2000.
Langmann, B.: A model study of the smoke-haze influence on clouds and warm precipitation formation in Indonesia 1997/1998, Atmos. Environ., 41, 6838–6852,
30
doi:10.1016/j.atmosenv.2007.04.050, 2007.
Lauer, A., Hendricks, J., Ackermann, I. J., Schell, B., Hass, H., and Metzger, S.: Simulating aerosol microphysics with the ECHAM/MADE GCM – Part I: Model description and
compar-ACPD
7, 17893–17926, 2007 European aerosol distribution – model evaluation B. Langmann et al. Title Page Abstract Introduction Conclusions References Tables Figures ◭ ◮ ◭ ◮ Back CloseFull Screen / Esc
Printer-friendly Version
Interactive Discussion
EGU
ison with observations, Atmos. Chem. Phys., 5, 3251–3276, 2005,
http://www.atmos-chem-phys.net/5/3251/2005/.
Majewski, D.: The Europa Modell of the Deutscher Wetterdienst, Seminar Proceedings ECMWF, Vol. 2, 147–191, 1991.
Marmer E. and Langmann, B.: Aerosol modelling over Europe Part I: Inter-annual variability of
5
aerosol distribution, J. Geophys. Res., 112, D23S15, doi:10.1029/2006JD008113, 2007. Memmesheimer, M., Tippke, J., Ebel, A., Hass, H., Jacobs, H. J., and Laube, M.: On the use
of EMEP emission inventories for European scale air pollution modelling with the EURAD model, EMEP Workshop on photooxidant modelling for long-range transport in relation to abatment strategies, Berlin, Germany, 16–19 April 1991, 307–324, 1991.
10
Novakov, T., Cachier, H., Clark, J. S., Gaudichet, A., Macko, S., and Masclet, P.: Characteriza-tion of particulate products of biomass combusCharacteriza-tion, in Sediment Records of Biomass Burning and Global Change, edited by: Clak, J. S., Cachier, H., Goldammer, J. G., and Stocks, B., NATO ASI Series, Springer Verlag, Berlin, Germany, 1997.
O’Dowd, C., Facchini, M. C., Cavalli, F., Ceburnis, D., Mircea, M., Decesari, S., Fuzzi, S., Yoon,
15
Y. J., and Putaud, J. P.: Biogenically-driven organic contribution to marine aerosol, Nature, 432, 7009, doi:10.1038/nature02959, 2004.
O’Dowd, C., Langmann, B., Varghese, S., Scannell, C., Ceburnis, D., and Facchini, M. C.: A combined organic-inorganic sea-spray source function, Geophys. Res. Lett., doi:10.1029/2007GL030331, in press, 2007.
20
Roeckner, E., Arpe, K., Bengtsson, L., Christoph, M., Claussen, M., D ¨umenil, L., Esch, M., Giorgetta, M., Schlese, U., and Schulzweida, U.: The atmospheric general circulation model ECHAM-4: Model description and simulation of present-day climate, MPI-Report No. 218, Max Planck Institute for Meteorology, Hamburg, Germany, 1996.
Seinfeld, J. H. and Pandis, S. N.: Atmospheric chemistry and physics: from air pollution to
25
climate change, Wiley-Interscience, 1998.
Simpson, D., Winiwarter, W., Boerjesson, G., Cinderby, S., Ferreiro, A. Guenther, A., Hewitt, C. N., Janson, R., Khalil, M. A. K., Owen, S., Pierce, T. E., Puxbaum, H., Shearer, M., Skiba, U., Steinbrecher, R., Tarrason L., and Oequist, M. G.: Inventorying emissions from nature in Europe, J. Geophys. Res., 104, 8113–8152, 1999.
30
Solmon, F., Giorgi F., and Liousse, C.: Aerosol modelling for regional climate studies: appli-cation to anthropogenic particles and evaluation over a European / African domain, Tellus, 58B, 51–72, 2006.
ACPD
7, 17893–17926, 2007 European aerosol distribution – model evaluation B. Langmann et al. Title Page Abstract Introduction Conclusions References Tables Figures ◭ ◮ ◭ ◮ Back CloseFull Screen / Esc
Printer-friendly Version
Interactive Discussion
EGU
Stier, P., Feichter, J., Kinne, S., Kloster, S., Vignati, E., Wilson, J., Ganzeveld, L., Tegen, I., Werner, M., Balkanski, Y., Schulz, M., Boucher, O., Minikin, A., and Petzold, A.: The aerosol-climate model ECHAM5-HAM, Atmos. Chem. Phys., 5, 1125–1156, 2005,
http://www.atmos-chem-phys.net/5/1125/2005/.
Stoddart, J., Jeffries, D., Lkewolle, A., Clair, T., Dillon, P., Driscoll, C., Fortius, M.,
Johanns-5
essen, M., Kahl, J., Kellogg, J., Kemp., A., Mannio, J., Montheith, D., Murdoch, P., Patrick, S., Rebsdorf, A., and Skjelkv, B.: Regional trends in aquatic recovery from acidification in North America and Europe, Nature, 401, 575–578, 1999.
Szidat, S., Prevot, A. S. H., Sandradewi, J., Alfarra, M. R., Synal, H.-A., Wacker, L., and Bal-tenschlager, U.: Dominant impact of residential wood burning on particulate matter in Alpine
10
valleys during winter, Geophys. Res. Lett., 34, L05820, doi:10.1029/2006GL028325, 2007. Tsyro, S., Simpson, D., Tarrason, L., Klimont, Z., Kupiainen, K., Pio C., and Yttri,
K. E.: Modelling of elemental carbon over Europe, J. Geophys. Res., 112, D23S19, doi:10.1029/2006JD008164, 2007.
Van der Werf, G. R., Randerson, J. T., Giglio, L., Collatz, G. J., Kasibhatla, P. S., and Arellano,
15
A. F. Jr.: Interannual variability in global biomass burning emissions from 1997 to 2004, Atmos. Chem. Phys., 6, 3423–3441, 2006,
http://www.atmos-chem-phys.net/6/3423/2006/.
Vignati, E., Wilson, J., and Stier, P.: M7: An efficient size-resolved aerosol micro-physics module for large-scale aerosol transport models, J. Geophys. Res., 109, D22202,
20
doi:10.1029/2003JD004485, 2004.
WHO, World Health Report 2002, Tech. Rep., World Health Organisation, Genova 2002. Walcek, C. J. and Taylor, G. R.: A theoretical method for computing vertical distributions of
acidity and sulfate production within cumulus clouds, J. Atmos. Sci., 43, 339–355, 1986. Walcek, C. J., Brost, R. A., Chang, J. S., and Wesley, M. L.: SO2, Sulfate and HNO3deposition
25
velocities computed using regional landuse and meteorological data, Atmos. Environ., 20, 946–964, 1986.
Wesley, M. L.: Parameterization of surface resistances to gaseous dry deposition in regional-sclae numerical models, Atmos. Environ., 23, 1293–1304, 1989.
Yoon, Y. J., Ceburnis, D., Cavalli, F., Jourdan, O., Putaud, J. P., Facchini, M. C., Decesari,
30
S., Fuzzi, S., Jennings, S. G., and O’Dowd, C.: Seasonal characteristics of the physico-chemical properties of North Atlantc marine aerosols, J. Geophys. Res., 112, D04206, doi:10.1029/2005JD007044, 2007.
ACPD
7, 17893–17926, 2007 European aerosol distribution – model evaluation B. Langmann et al. Title Page Abstract Introduction Conclusions References Tables Figures ◭ ◮ ◭ ◮ Back CloseFull Screen / Esc
Printer-friendly Version
Interactive Discussion
EGU
Yttri, K. E., Aas, W., Bjerke, A., Ceburnis, D., Dye, C., Emblico, L., Facchini, M. C., Forster, C., Hanssen, J. E., Hannsson, H. C., Jennings, S. G., Maenhaut, W., Putaud, J. P., and Torseth, K.: Elemental and organic carbon in PM10: A one year measurement campaign within the European Monitoring and Evaluations Programme EMEP, Atmos. Chem. Phys., 7, 5711–5725, 2007,
5
http://www.atmos-chem-phys.net/7/5711/2007/.
Zhang, Y., Seigneur, C., Seinfeld, J. H., Jacobson, M. Z., and Binkowsky, F. S.: Simulation of aerosol dynamics: A comparative review of algorithms used in air quality models, Aerosol Sci. Technol., 31, 487–514, 1999.
ACPD
7, 17893–17926, 2007 European aerosol distribution – model evaluation B. Langmann et al. Title Page Abstract Introduction Conclusions References Tables Figures ◭ ◮ ◭ ◮ Back CloseFull Screen / Esc
Printer-friendly Version
Interactive Discussion
EGU
Table 1. Modal structure and properties of M7. Ni denotes the aerosol number of mode i , Mji denotes the mass of component j in mode i , and r the dry radius.
MODES IN M7 SOLUBLE / MIXED INSOLUBLE
NUCLEATION r<0.005 µm Mode 1 N1, M SO4 1 AITKEN 0.005µm<r<0.05 µm Mode 2 N2, MSO42 , MBC2 , MOC2 Mode 5 N5, MBC5 , MOC5 ACCUMULATION 0.05 µm<r<0.5 µm Mode 3 N3, MSO43 , MBC3 , MOC3 , MSS3 , MDU3 Mode 6 N6, MDU6 COARSE 0.5 µm<r Mode 4 N3, M SO4 4 , M BC 4 , M OC 4 , M SS 4 , M DU 4 Mode 7 N7, M DU 7
ACPD
7, 17893–17926, 2007 European aerosol distribution – model evaluation B. Langmann et al. Title Page Abstract Introduction Conclusions References Tables Figures ◭ ◮ ◭ ◮ Back CloseFull Screen / Esc
Printer-friendly Version
Interactive Discussion
EGU
Table 2. European monthly mean burden, lifetime and sinks.
Species Month 2003 Atmospheric Lifetime Wet Dry Sedimentation
burden deposition deposition
[mg/m2] [days] [mg/m2/month] [mg/m2/month] [mg/m2/month]
[%] [%] [%]
Sea salt Jan 7.9 0.15 1201.9 262.9 129.6
75.4 16.5 8.1 June 4.4 0.47 147 24.2 108.4 52.6 8.6 38.8 POC Jan 0.17 0.71 7.1 0.28 0.013 96 3.8 0.2 June 0.36 1.5 6.9 0.43 0.058 93.4 5.8 0.8 Sulfate Jan 0.87 0.38 68 0.87 1 97.3 1.3 1.4 June 2.3 1.9 34.4 0.91 0.8 95.3 2.5 2.2 BC Jan 0.087 0.98 2.6 0.15 0.003 94.6 5.3 0.1 June 0.15 2.9 1.4 0.11 0.003 92.2 7.6 0.2
ACPD
7, 17893–17926, 2007 European aerosol distribution – model evaluation B. Langmann et al. Title Page Abstract Introduction Conclusions References Tables Figures ◭ ◮ ◭ ◮ Back CloseFull Screen / Esc
Printer-friendly Version Interactive Discussion EGU January 2003 June 2003 (a) (b) (c)
Figure 1: (a) Measured and (b) simulated precipitation by REMOTE during January and
January 2003: Precipitation 0 50 100 150 200 250 0 50 100 150 200 250 EMEP [m m /m onth] R E M O T E [m m /m o n th ] June 2003: Precipitation 0 50 100 150 200 250 0 50 100 150 200 250 EMEP [m m /m onth] R E M O T E [m m /m o n th ]
Fig. 1. (a) Measured and (b) simulated precipitation by REMOTE during January and June
2003 in mm/month. (c) REMOTE monthly precipitation at EMEP stations against EMEP mea-surements.
ACPD
7, 17893–17926, 2007 European aerosol distribution – model evaluation B. Langmann et al. Title Page Abstract Introduction Conclusions References Tables Figures ◭ ◮ ◭ ◮ Back CloseFull Screen / Esc
Printer-friendly Version Interactive Discussion EGU January 2003 June 2003 0 90 180 270 360 0 5 10 15 20 25 30 Day in June 2003 w in d d ir e c ti o n [ °] Measured_22m REMOTE 0 90 180 270 360 0 5 10 15 20 25 30 Day in January 2003 w in d d ir e c ti o n [ °] Measured_22m REMOTE 0 5 10 15 20 0 5 10 15 20 25 30 Day in January 2003 w in d s p e e d [ m /s ] Measured_22m REMOTE 0 5 10 15 20 0 5 10 15 20 25 30 Day in June 2003 w in d s p e e d [ m /s ] Measured_22m REMOTE
Fig. 2. Measured and modeled wind speed and direction at Mace Head (53.1◦N, 9.3◦W) during
January and June 2003. Model results out of the first layer in approximately 30 m height are shown.
ACPD
7, 17893–17926, 2007 European aerosol distribution – model evaluation B. Langmann et al. Title Page Abstract Introduction Conclusions References Tables Figures ◭ ◮ ◭ ◮ Back CloseFull Screen / Esc
Printer-friendly Version Interactive Discussion EGU January 2003 June 2003 (a) (b) w d Cl- [m g/m 2/m onth] Jan 2003 138 0 1000 2000 3000 4000 5000 0 1000 2000 3000 4000 5000 EMEP R E M O T E wd Cl- [mg/m2/month] June 2003 0 100 200 300 400 0 100 200 300 400 EMEP R EM O T E
Fig. 3. Sea salt: (a) REMOTE modeled sum of near surface coarse and accumulation mode
sea salt in µg/m3 during January and June 2003. (b) REMOTE monthly wet depositions of chloride at EMEP stations against EMEP measurements in mg/m2/month with different intervals for January and June 2003 (measured [mg/l] is converted to [mg/m2/month] by multiplication with measured precipitation in [mm/month]).
ACPD
7, 17893–17926, 2007 European aerosol distribution – model evaluation B. Langmann et al. Title Page Abstract Introduction Conclusions References Tables Figures ◭ ◮ ◭ ◮ Back CloseFull Screen / Esc
Printer-friendly Version Interactive Discussion EGU January 2003 June 2003 (a) (b) (c)
Figure 4: Sulfur species: REMOTE monthly concentration of (a) SO and (b) Sulfate
SO2 [ugS/m3] Jan 2003 RUN138
0 2 4 6 8 0 2 4 6 8 EMEP R EMO T E wd Sulf [mgS/m2/month] June 2003 RUN138 0 50 100 150 200 0 50 100 150 200 EMEP R EM O T E wd Sulf [mgS/m2/month] Jan 2003 138 0 50 100 150 200 0 50 100 150 200 EMEP R EM O T E
Sulf [ugS/m3] June2003 RUN138
0 0.5 1 1.5 2 2.5 0 0.5 1 1.5 2 2.5 EMEP R EM O T E
SULF [ugS/m3] Jan 2003 138
0 0.5 1 1.5 2 2.5 0 0.5 1 1.5 2 2.5 EMEP R EM O T E
SO2 [ugS/m3] June 2003 RUN138
0 2 4 6 8 0 2 4 6 8 EMEP R EM O T E
Fig. 4. Sulfur species: REMOTE monthly concentration of (a) SO2and (b) Sulfate in [µgS/m3], and (c) sulfate wet deposition in [mgS/m2/month] at EMEP stations compared against EMEP measurements.
ACPD
7, 17893–17926, 2007 European aerosol distribution – model evaluation B. Langmann et al. Title Page Abstract Introduction Conclusions References Tables Figures ◭ ◮ ◭ ◮ Back CloseFull Screen / Esc
Printer-friendly Version Interactive Discussion EGU January 2003 June 2003 (a) (b) (c)
Figure 5: Photo-oxidants: REMOTE daily concentrations of ozone (a) at noon and (b)
NO2 [ugN/m3] June 2003 RUN138 0 2 4 6 8 10 0 2 4 6 8 10 EMEP R EM O T E
O3 [ug/m3] Jan 2003 12 UTC 138
0 50 100 150 200 0 50 100 150 200 EMEP R EMO T E
O3 [ug/m3] June 2003 12 UTC 138
0 50 100 150 200 0 50 100 150 200 EMEP R EMO T E
O3 [ug/m3] June 2003 0UTC 138
0 50 100 150 200 0 50 100 150 200 EMEP R EMO T E
O3 [ug/m3] Jan 2003 0 UTC 138
0 50 100 150 200 0 50 100 150 200 EMEP R EM O T E
NO2 [ugN/m3] Jan 2003 RUN138
0 2 4 6 8 10 0 2 4 6 8 10 EMEP R EM O T E
Fig. 5. Photo-oxidants: REMOTE daily concentrations of ozone (a) at noon and (b) at
mid-night in [µg/m3] and (c) monthly concentration of NO2in [µgN/m3] at EMEP stations compared against EMEP measurements.
ACPD
7, 17893–17926, 2007 European aerosol distribution – model evaluation B. Langmann et al. Title Page Abstract Introduction Conclusions References Tables Figures ◭ ◮ ◭ ◮ Back CloseFull Screen / Esc
Printer-friendly Version Interactive Discussion EGU January 2003 June 2003 (a) (b) (c)
BC [ug/m3] Jan 2003 RUN138
0 1 2 3 0 1 2 3 EMEP R E MO T E
BC [ug/m3] June 2003 RUN138
0 1 2 3 0 1 2 3 EMEP R EM O T E 0 0.2 0.4 0.6 0.8 1 0 5 10 15 20 25 30 Day in January 2003 B C [ u g /m 3 ] AE9 REMOTE 138 b t t l ld 0 0.05 0.1 0.15 0.2 0.25 0.3 0 5 10 15 20 25 30 Day in June 2003 B C [ u g /m 3 ] AE9 REMOTE 138 b t t l ld
Fig. 6. BC: (a) REMOTE modeled total BC concentration in µg/m3in surface air during January and June 2003. (b) REMOTE monthly BC concentration at EMEP stations against EMEP measurements in µg/m3. (c) Time series of modeled (in red) and measured (in black) BC concentrations at Mace Head.
ACPD
7, 17893–17926, 2007 European aerosol distribution – model evaluation B. Langmann et al. Title Page Abstract Introduction Conclusions References Tables Figures ◭ ◮ ◭ ◮ Back CloseFull Screen / Esc
Printer-friendly Version
Interactive Discussion
EGU
(a) January 2003 June 2003
(b)
OC [ug/m 3] Jan 2003 RUN138
0 0.5 1 1.5 0 5 10 15 EMEP R E M O T E
OC [ug/m 3] June 2003 RUN138
0 1 2 3 4 5 6 0 1 2 3 4 5 6 EMEP R E M O T E
Fig. 7. POC: (a) REMOTE modeled total POC concentration in µg/m3 in surface air during January and June 2003. (b) REMOTE monthly POC concentration at EMEP stations against EMEP measurements in µg/m3. Note that for January the y and x-axis are different.
ACPD
7, 17893–17926, 2007 European aerosol distribution – model evaluation B. Langmann et al. Title Page Abstract Introduction Conclusions References Tables Figures ◭ ◮ ◭ ◮ Back CloseFull Screen / Esc
Printer-friendly Version
Interactive Discussion
EGU
(a) (b)
Winter: source contribution to OC in %
fossil fuel 4% biogenic 2% SOC non-ff 18% SOC ff 17% wood 59%
Summer: source contribution to OC in %
SOC non-ff 78% biogenic 4% fossil fuel 5% SOC ff 9% wood 4%
Fig. 8. Averaged results of the source apportionment analysis of measured carbonaceous
aerosols at five locations in Europe (Gelencser et al., 2007) during (a) winter and (b) summer. (ff: fossil fuel, non-ff: non-fossil fuel).
ACPD
7, 17893–17926, 2007 European aerosol distribution – model evaluation B. Langmann et al. Title Page Abstract Introduction Conclusions References Tables Figures ◭ ◮ ◭ ◮ Back CloseFull Screen / Esc
Printer-friendly Version Interactive Discussion EGU (a) (b) 0 0.005 0.01 0.015 0.02 0.025 0.03 BC (mg/m2) 0 2 4 6 8 Height (km) bulk Jan M7 Jan bulk June M7 June BC vertical profiles 0 0.1 0.2 0.3 0.4 Sulfate (mg/m2) 0 2 4 6 8 Height (km) bulk Jan M7 Jan bulk June M7 June
Sulfate vertical profiles
Fig. 9. European mean vertical distribution of (a) BC and (b) sulfate in mg/m2during January and June 2003 as determined by REMOTE/M7 and the bulk mass approach.
ACPD
7, 17893–17926, 2007 European aerosol distribution – model evaluation B. Langmann et al. Title Page Abstract Introduction Conclusions References Tables Figures ◭ ◮ ◭ ◮ Back CloseFull Screen / Esc
Printer-friendly Version Interactive Discussion EGU January 2003 June 2003 (a) BC [mg/m2] Difference % (b) Sulfate [mg/m2] Difference %
Figure 10: Column concentration of (a) BC and (b) sulfate in mg/m2 during January
and June 2003 and percentage difference between detailed aerosol microphysics and
Fig. 10. Column concentration of (a) BC and (b) sulfate in mg/m2 during January and June 2003 and percentage difference between detailed aerosol microphysics and aerosol mass bulk approach.