Ultimate shear strength of rectangular reinforced concrete
walls with an aspect ratio between one and two
BOUKAIS SAID*, KAHIL Amar**, KHELIL Nacim, NEKMOUCHE Aghiles, *, KEZMANE Ali*
* Civil Engineering Department, Faculty of Construction Engineering, University of Tizi Ouzou, Algeria. ** Civil Engineering Department, Faculty of Technology, University of Bejaia, Algeria.
Coresponding Author, E-mail: amar.kahil@yahoo.com
Abstract. This paper presents an analytical study on the behavior of rectangular reinforced concrete walls with an aspect ratio
between one and tow. Several experiments on such walls have been selected to be studied. Database from various experiments were collected and nominal shear wall strengths have been calculated using formulas, such as those of the ACI (American), NZS (New Zealand), Mexican (NTCC), and Wood equation. Subsequently, nominal shear wall strengths from the formulas were compared with the ultimate shear wall strengths from the database. These formulas vary substantially in functional form and do not account for all variables that affect the response of walls. There is substantial scatter in the predicted values of ultimate shear strength. New semi empirical equation are developed using data from tests of 41 walls with the objective of improving the prediction of ultimate strength of walls with the most possible accuracy.
KEYWORDS: Prediction, ultimate, shear strength, reinforced concrete, walls, rectangular walls
1. Introduction
The ultimate shear strength of reinforced concrete walls and the design criteria to adequately resist shear has been the focus of many experimental and analytical studies [Hidalgo P A ] [1]. One popular approach to predicting the ultimate shear strength of reinforced concrete walls used by researches is the derivation of empirical expressions based on test results (for example Barda [Barda F 1977] et al. and Wood [Wood S 1990 ] ). Most of the seismic design provisions found in modern building codes, such as American Code provisions (ACI 318, 2008) [ACI 2008], Mexican code (NTCC 2004) [Concrete Design Committee 2006 ] and New Zeeland code (NZS 2006) [G. del Distrito Federal 2004] use empirical or semi-empirical equations to estimate the ultimate shear strength of reinforced concrete walls. These procedures use parameters such as aspect ratio, horizontal and vertical reinforcement ratio, and axial load to estimate the ultimate shear strength. A data base of 67 rectangular reinforced walls with an aspect ratio between one and two are used to evaluate the accuracy of the four cited equations. The experimentally measured ultimate shear strengths of the database walls are compared with ultimate shear strengths predicted by four pervious cited equations. This comparison has indicated that the scatter in the shear strength predicted by these equations is substantial, which is problematic because shear strength is the key variable for design and performance assessment. New semi-empirical equation was proposed for such walls with the objective of improving the prediction of ultimate strength.
2. Data Base
Aimed at assessing the adequacy of cited models available for predicting the ultimate shear strength of reinforced concrete walls, a database of 67 experiments are constructed and contain all relevant information. The test specimens in the database are selected using the following criteria: 1) a minimum web thickness of 5 cm; 2) symmetric reinforcement layout; 3) aspect ratio less or equal to tow, and 4) rectangular cross section. The data for the 67 walls tests were obtained from Hirosava [Hirosawa. M. 1975 ] , Maier [Maier J. 1985 ] , Lefas [Lefas DI 1990 ] , Rothe [Rothe 1992 ], Pilakoutas [Pilakoutas K 1995], Salonikios [Salonikios TN 2000], Zhang [Zhang L X B 1998], Kuang [Kuang J S 2008] and Tran [[Tran T A 2010]. The Failure modes of walls included in the database are shear failure and flexure failure. As the interest of this study is to evaluate the available existing models and to propose a new model to predict the ultimate shear strength, 41 specimens were selected for this study. All the 41 selected specimens had a shear failure mode. Figure 1 presents summary information on the 41 walls included in this database.
3. Comparaison of wall shear strengths
The experimental shear strength data of the walls documented in section tow are used herein to investigate the accuracy of the calculation procedures presented in Table.1 to predict the ultimate shear strength of walls. General statistical parameters related to the ratio of the predicted to measured ultimate shear strength of the walls
415
sciencesconf.org:rugc17:139448
are presented. The mean and median values of the shear strength ratios presented in Table 2 for equation (3), which represent Mexican equation (VNTC), indicate that this equation is the most accurate of the four because the mean and median ratio for this equation is 1,14 and 0,11, respectively, and the standard deviation and the coefficient of variation are relatively small compared than ACI, NZS Wood equation.
Figure 1. Histograms of geometric and material properties of the 41 Transition walls
Table 1 Statistics of the ratio of ultimate shear strength predicted using equations 1 to4 to measured ultimate
shear strength
Model Concrete contribution (Vc) Steel con (Vs) Note
ACI 318-2008(1) (α√𝑓𝑐)A
If H/L ≤ 1.5, α = 0.25
If H/L ≥ 2, α = 0.17If 1.5< H/L <2, α : is given by interpolation
𝜌ℎ𝑓𝑦ℎ𝐴 𝑉𝐶+ 𝑉𝑆≤ 0.83√𝑓𝑐𝐴 NZS 2006(2) 𝑀𝑖𝑛 { (0.27√𝑓𝑐+ 𝑁𝑢 4𝐴)𝑡𝑤𝑑 [0.05√𝑓𝑐+ 𝑙 (0.1√𝑓𝑐+0.2𝑁𝐴𝑢) 𝑀𝑢 𝑉𝑢− 𝑙 2 ]𝑡𝑤𝑑 (𝐴𝑣𝑓𝑦ℎ𝑑/𝑆)𝐴 𝑉𝐶+ 𝑉𝑆≤ 0.2𝑓𝑐𝑡𝑤𝑑1 NTCC 2004(3) 𝐼𝑓 𝐻 𝐿≤ 1.5, 𝑉𝑐= 0.27√𝑓𝑐𝐿𝑡𝑤 𝐼𝑓𝐻 𝐿≥ 2 & 𝜌𝑣𝑡< 0.015, 𝑉𝑐= 0.3𝑡𝑤𝑑(0.2 + 20𝜌𝑣)√𝑓𝑐 𝐼𝑓𝐻𝐿≥ 2 & 𝜌𝑣𝑡 ≥ 0.015, 𝑉𝑐= 0.16𝑡𝑤𝑑√𝑓𝑐 𝜌ℎ𝑓𝑦ℎ𝐴 𝑉𝐶+ 𝑉𝑆≤ 0.2√𝑓𝑐𝑡𝑤𝑑1 Wood (1990) (4) 0.5√𝑓𝑐A
fc (MPa):concrete compressive strength, A (mm2): area of the wall bounded by web thickness and wall length. tw (mm), H(mm): wall height : web thickness, L(mm): wall length,
d=0.80L, Mu (N.m): moment at the section, Vu (N):shear force at the section, Nu(N): axial load, ρh: horizontal web reinforcement ratio; fyh (MPa): yield stress of horizontal web
reinforcement, ρvt: ratio of wall vertical reinforcement in tension, Av (m2) : area of horizontal reinforcement within a distance S (m), fyv (MPa): yield stress of vertical web reinforcement, ρh:
vertical web reinforcement ratio
Table 2 Statistics of the ratio of ultimate shear strength predicted using equations 1 to4 to measured ultimate
shear strength
Mean Median Value Max Value Min St. Dev COV
VACI/VEXP 1,21 1,13 2,58 0.49 0,38 0,31
VNZS/VEXP 1,35 1,24 2,31 0,42 0,51 0,38
VNTC/VEXP 1,14 1,11 1,98 0,52 0,30 0,26
VWO/ VEXP 1,28 1,20 2,03 0,69 0,35 0,27
4. Proposed Model
The results presented in section 3 showed that all four equations are inaccurate, because the coefficients of variation associated with the distributions of the ratio of predicted to experimental ultimate shear strength are generally large. An ideal equation would provide a mean ratio of predicted to measured peak shear strengths of 1.0 and a small dispersion as measured by a coefficient of variation. The ideal equation or model to predict the ultimate shear strength of rectangular reinforced concrete walls should consider the following design variables: 1) aspect ratio, 2) vertical web reinforcement ratio, 3) axial force, 4) boundary element reinforcement ratio, and 5) concrete compressive strength for completeness [16]. To determine the general form of the regression model, a simple free body diagram that is based on the occurrence of inclined (shear) cracks in a reinforced concrete wall is presented in Figure 2. The forces along a crack that crosses through the upper corner of the wall web are used to form the free body diagram.
2500 2300 2100 1900 1700 1500 1300 1100 18 16 14 12 10 8 6 4 2 0 Height (mm) N u m b e r o f w a ll s 1300 1200 1100 1000 900 800 700 600 20 15 10 5 0 Lenght (mm) N u m b e r o f w a ll s 170 150 130 110 90 70 50 18 16 14 12 10 8 6 4 2 0 Web thickness (mm) N u m b e r o f w a ll s 2,0 1,9 1,8 1,7 1,6 1,5 1,4 25 20 15 10 5 0 Aspect ratio N u m b e ro f w a ll s 2,1 1,8 1,5 1,2 0,9 0,6 0,3 0,0 25 20 15 10 5 0
Vertical webreinforcement ratio (%)
N u m b er o f w al l 1,2 1,0 0,8 0,6 0,4 0,2 0,0 30 25 20 15 10 5 0
Horizontal web reinforcemnt (%)
N um be r of w al ls 10,5 9,0 7,5 6,0 4,5 3,0 1,5 0,0 25 20 15 10 5 0
Boundary element reinforcement ratio (%)
N u m b e r o f w a ll s 650 600 550 500 450 400 350 300 16 14 12 10 8 6 4 2 0
Vertical reinforcement yield stress (MPa)
N u m b e r o f w a ll s 640 580 520 460 400 340 280 20 15 10 5 0
Horizontal reinforcement yield stress (MPa)
N u m b e r o f w a ll s 54 48 42 36 30 24 18 12 14 12 10 8 6 4 2 0 fc (Mpa) N um be r of w al ls 1050 900 750 600 450 300 150 0 30 25 20 15 10 5 0 Axial load ( kN) N u m b er o f w al ls
416
sciencesconf.org:rugc17:139448
Figure 2. Free body diagram
Based on the elementary calculation of strength of materials, a relationship is established between the external and internal forces, as shown in equations (1) and (2).
0 2 / 1 1 3 2 2 /
MO FHh FAHy FAVx FVL FBHy FBVx FAE x (1) 1 3 1 1 2 2 /2 ) ( F y F x F L F y F x F x h FH AH AV V BH BV AE (2) Equation (2) gives the ultimate shear strength of the wall (free body diagram) as a function of all forces contributes to the shear strength except the aspect ratio. To introduce the parameter, a simplified form of equation (2) is given as follows:
f F A
h l A A VM H AH AH AV AV AE AE c V 7 6 5 . 0 4 3 2 1 )) ( / )( /) (( (3)
In equation (3), ρAH, ρAV and ρAE, represent the horizontal, vertical and boundary element reinforcement ratio, respectively, and σAH, σAV, σAE represent its reinforcement yield stress, respectively. fc represents the compressive concrete strength, Fv represents the axial load, h and l is the height and the length of the wall, respectively. The values of the unknown coefficients (α1 to α7) of the model are calculated using the nonlinear regression based on the nonlinear least square method. The new equation to estimate the ultimate shear strength of walls with aspect ratio between one and two is given by equation the following equation:
f F A
h l A VM AH AH AV AV AE AE c0.5 V 0.06 ) / ( ) / 078 . 0 ( )) 51 . 0 061 . 0 44 . 0 32 . 0 (( (4) Table 3 Statistics of the ratio of ultimate shear strength predicted using equations 1 to4 to measured ultimateshear strength
Mean Median Value Max Value Min St. Dev COV SSE
VACI/VEXP 1,21 1,13 2,58 0.49 0,38 0,31 3,76E+11
VNZS/VEXP 1,35 1,24 2,31 0,42 0,51 0,38 7,97E+11
VNTC/VEXP 1,14 1,11 1,98 0,52 0,30 0,26 2,39E+11
VWO/ VEXP 1,28 1,20 2,03 0,69 0,35 0,27 3,59E+11
VM/ VEXP 1,00 1.00 1,39 0,70 0,18 0,18 8,15E+10
𝜌ℎ𝜎ℎ(𝑀𝑃𝑎) 𝜌𝑣𝜎𝑣(𝑀𝑃𝑎) 𝜌𝑏𝑒𝜎𝑏𝑒(𝑀𝑃𝑎)
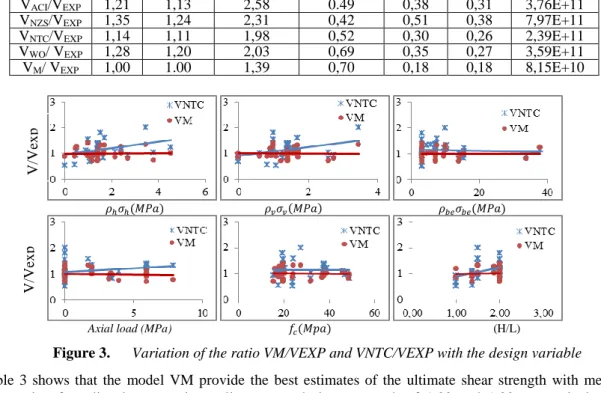
Axial load (MPa) 𝑓𝑐(𝑀𝑝𝑎) (H/L) Figure 3. Variation of the ratio VM/VEXP and VNTC/VEXP with the design variable
Table 3 shows that the model VM provide the best estimates of the ultimate shear strength with mean and median ratio of predicted to experimentally measured shear strength of 1.00 and 1.00, respectively, and a coefficient of variation of 0.18and, which is the smallest among the procedures investigated. The error sum of squares statistics associated with each model presented in the last column of Table 3 also reveal that model VM produces the smallest error in calculating the ultimate shear strength. Based on this remarks, it's allow to say that
V/Vex
p
V/Vex
p
417
sciencesconf.org:rugc17:139448
the forms of the four equations presented in section 2 do not take into account all factors that affect the shear strength of transition walls.
Figure 3 present the variation of the ratio of the calculated to experimental shear strengths for model VM with the design parameters, namely, boundary element reinforcement ratio, vertical web reinforcement ratio, horizontal web reinforcement ratio, vertical web reinforcement ratio, concrete compressive strength, aspect ratio, and axial load. In a well-specified model, the data points in Figure 3 should be scattered without a trend in a shallow band around the value of 1.0 for the ratio of calculated to experimental ultimate shear strength. The figures indicate that model VM captures the ultimate shear strength accurately for all design variables over their corresponding ranges. The majority of the ratios associated with model VM are between 0.70 and 1.39 whereas the ratios for model VNTC are widely scattered and range between 0.52 and 1.98.
5. Conclusion
The study reported herein on the ultimate shear strength for rectangular reinforced concrete walls with aspect ratio between one and tow. The scatter in the values of ultimate shear strength predicted by the four equations evaluated in this study is substantial. The best predictions of ultimate strength (mean, median ratio of predicted to measured ultimate shear strength close to 1.0 and a small coefficient of variation) are obtained using the Mexican equations (NTCC2004). From the comparison of measured strengths in tests and calculated strengths using the proposed model, it is clear that the model is reliable. Average measured-to-calculated strengths ratio was 1.00 and a coefficient of variation of 0.18. The proposed model (VM) perform significantly better than the equations currently used for predicting the ultimate shear strength of walls with aspect ratio between one and tow, and take in account all design variable those affect the ultimate shear strength.
6. References
[Hidalgo P A ] Hidalgo P A. Ledezma C A. and Jordan R. M. Seismic behavior of squat reinforced concrete shear walls. Earthquake Spectra, EERI, Vol. 18, No. 2, pp 287-308.
[Barda F 1977] Barda F. Hanson J M. and Corley W G. Shear Strength of Low-Rise Walls with Boundary Elements. ACI Special Publications. Reinforced Concrete in Seismic Zones SP-53-8, 1977, pp.149-202.
[Wood S 1990 ] Wood S. Shear Strength of Low-Rise Reinforced Concrete Walls. ACI Structural Journal Vol. 87, No. 1, January-February 1990, pp. 99-107.
[ACI 2008] ACI Committee 318. Building Code Requirements for Reinforced Concrete (ACI 318- 2008). American Concrete Institute.Farmington Hill. Michigan 2008.
[Concrete Design Committee 2006 ] Concrete Design Committee P 3101.2006. Concrete Structures Standard, Part 1−The Design of Concrete Structures, Standards New Zealand, New Zealand, Wellington 2006.
[G. del Distrito Federal 2004] G. del Distrito Federal. 2004. Normas Técnicas Complementarias para Diseño y Construcción de Estructuras de Concreto (NTCC). Gaceta Oficial del Departamento del Distrito Federal. Mexico2004.
[Hirosawa. M. 1975 ] Hirosawa. M. Past Experimental Results on Reinforced Concrete Shear Walls and Analysis on Them, Kenchiku Kenkyu Shiryo, Building Research Institute, Ministry of Construction, Tokyo, Japan, 1975 No. 6. 277 pp. [Maier J. 1985 ] Maier J. and Thürlimann B. Bruchversuche an Stahlbetonscheiben Institut für Baustatik und
Konstruktion, Eidgenössische Technische Hochschule (ETH) Zürich, Zürich, Switzerland, 1985 130 pp.
[Lefas DI 1990 ] Lefas DI. Kotsovos DM. Ambraseys NN. Behavior of reinforced concrete structural walls: deformation characteristics, and failure mechanism. ACI Struct J 1990;87(1):23-31.
[Rothe 1992 ] Rothe, D. Untersuchungen zum Nichtlinearen Verhalten von Stahlbeton Wandschieben unter Erdbebenbeanspruchung, PhD Dissertation, Fachbereich Konstruktiver Ingenieurbau, der Technischen Hochschule Darmstadt, Darmstadt, Germany,1992 161 pp.
[Pilakoutas K 1995] Pilakoutas K, Lopes MS. Shear resistance determination of RC members. In: 5th. National conf. on earthquake eng., vol. 2. 1995. p. 201-10.
[Salonikios TN 2000] Salonikios TN, Kappos AJ, Tegos IA, Penelis GG. Cyclic load behavior of low-slenderness reinforced concrete walls: failure modes, strength and deformation analysis, and design implications. ACI Structure J 2000;97(1):132-41.
[Zhang L X B 1998] Zhang L X B. and Hsu T T C. "Behavior and Analysis of 100 MPa Concrete Membrane Elements. Journal of Structural Engineering, ASCE, Vol. 124, No. 1, pp. 24-34.
[Kuang J S 2008] Kuang J S. and Ho Y B. Seismic Behavior and Ductility of Squat ReinforcedConcrete Shear Walls with Nonseismic Detailing. ACI Structural Journal, Vol. 105, No. 2,
[Tran T A 2010] Tran T A. Lateral Load Behavior and Modeling of Low-Rise RC Walls for Performance Based Design. Ph.D. Seminar, University of California, Los Angeles 2010.