Publisher’s version / Version de l'éditeur:
Vous avez des questions? Nous pouvons vous aider. Pour communiquer directement avec un auteur, consultez la première page de la revue dans laquelle son article a été publié afin de trouver ses coordonnées. Si vous n’arrivez pas à les repérer, communiquez avec nous à PublicationsArchive-ArchivesPublications@nrc-cnrc.gc.ca.
Questions? Contact the NRC Publications Archive team at
PublicationsArchive-ArchivesPublications@nrc-cnrc.gc.ca. If you wish to email the authors directly, please see the first page of the publication for their contact information.
https://publications-cnrc.canada.ca/fra/droits
L’accès à ce site Web et l’utilisation de son contenu sont assujettis aux conditions présentées dans le site LISEZ CES CONDITIONS ATTENTIVEMENT AVANT D’UTILISER CE SITE WEB.
Noise-Con 2005 [Proceedings], pp. 1-6, 2005-10-01
READ THESE TERMS AND CONDITIONS CAREFULLY BEFORE USING THIS WEBSITE. https://nrc-publications.canada.ca/eng/copyright
NRC Publications Archive Record / Notice des Archives des publications du CNRC :
https://nrc-publications.canada.ca/eng/view/object/?id=20a30c2a-785e-4a0b-8f68-27f508694913 https://publications-cnrc.canada.ca/fra/voir/objet/?id=20a30c2a-785e-4a0b-8f68-27f508694913
NRC Publications Archive
Archives des publications du CNRC
This publication could be one of several versions: author’s original, accepted manuscript or the publisher’s version. / La version de cette publication peut être l’une des suivantes : la version prépublication de l’auteur, la version acceptée du manuscrit ou la version de l’éditeur.
Access and use of this website and the material on it are subject to the Terms and Conditions set forth at Identification of weak spots in the sound insulation of walls using a spherical microphone array
http://irc.nrc-cnrc.gc.ca
I de nt ific at ion of w e a k spot s in t he sound
insulat ion of w a lls using a sphe ric a l
m ic rophone a r ra y
G o v e r , B . N . ; B r a d l e y , J . S .
N R C C - 4 8 1 9 5
A version of this document is published in / Une version de ce
document se trouve dans: Noise-Con 2005, Minneapolis, MN.,
Oct. 17, 2005, pp. 1-6
Minneapolis, Minnesota
NOISE-CON 2005
2005 October 17-19
Identification of Weak Spots in the Sound Insulation of Walls
Using a Spherical Microphone Array
Bradford N. Gover
John S. Bradley
Institute for Research in Construction National Research Council
1200 Montreal Road Ottawa, Ontario K1A 0R6 brad.gover@nrc-cnrc.gc.ca
ABSTRACT
A previously developed spherical microphone array [J. Acoust. Soc. Am., 112(5), 1980-1991 (2002)] has been used for the identification of localized weak spots in an otherwise highly-insulating wall (sound transmission class (STC) rating of 56). A sound source and the array were placed on opposite sides of a wall sample constructed between two reverberation rooms. The omnidirectional impulse response was measured to each of the 32 array microphones, and subsequent beamforming resulted in 60 directional impulse responses at the array position, distributed over all directions. This set of responses was analyzed to identify directions of peak sound transmission through the wall. The wall was tested in three configurations: 1. with no intentional sound leaks (STC 56), 2. with a 5.4 cm diameter hole cut clear through (STC 53), and 3. with a 3.8 cm diameter sealed-end pipe passed through the 5.4 cm hole (STC 56). The results obtained with the array approach are compared to a “brute force” scan with a microphone located 0.25 m from the wall. Indications are that the array approach is capable of detecting minor defects in the wall.
1. INTRODUCTION
The sound insulating properties of building partitions such as walls are usually described by sound level reductions or single number ratings that are meant to indicate average performance in attenuating sound from one side to the other. The partition is rated in terms of its overall performance, even though the sound insulation could vary appreciably over its surface. Causes for such a variation include localized “sound leaks” or “hot spots”, due to penetrations through the partition, installation of electrical boxes, or poor workmanship, for example. In the vicinity of weak spots, the sound insulation is potentially much worse than the overall partition average.
Oftentimes it is of interest to ensure that a particular partition provides a minimum level of sound insulation, or that a room is adequately isolated from the remainder of the building. This is the case for security designers desiring to classify meeting rooms as “speech secure”. The failure of the sound insulation at a single location could mean the entire room fails to qualify. In this case, it is not sufficient to measure the average performance—the weakest spots of the partitions must be investigated. A procedure for measuring the attenuation from within a meeting room to spot locations outside the room has been developed for this purpose. The problem then becomes one of identification of the weak spots as candidate locations to test.
Identification of Weak Spots in Sound Insulation of Walls Gover & Bradley
Noise-Con 2005, Minneapolis, Minnesota, October 17-19, 2005
One can envision a “brute force” scan method where the entire partition is measured. This will be time consuming, but will be certain to cover all potential weak spots. Another approach is to use a highly-directional beamforming microphone array placed near the wall to identify directions of peak sound arrival through the wall. This measurement can be performed much more quickly, and can possibly indicate the weakest spots in the wall.
2. ARRAY MEASUREMENT SYSTEM
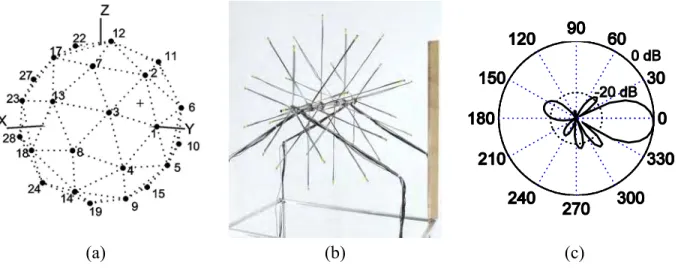
The array system used in the current investigation has been previously developed1 and used for investigation of sound fields within rooms2. Results from a preliminary application of this array for the current purpose have been presented in Ref. 3. The 48 cm diameter free field array is comprised of 32 omnidirectional microphones (Panasonic WM-61A102B electrets). The microphone locations correspond to the vertices of a geodesic sphere (a so-called Pentakis dodecahedron4), shown in Fig 1(a). A photograph of the array with a 50 cm ruler is shown in Fig. 1(b). The optimized filter-and-sum beamformer is designed to steer a beam through the centre of one of the 60 triangular faces of the polyhedron (indicated by the + symbol in Fig. 1(a)). By applying the 32 beamforming filters in the correct manner to the 32 microphone signals, the output of the array can be obtained in all 60 steering directions. The beampattern in the 800 Hz 1/3-octave band is shown in Fig. 1(c), drawn in a plane containing the array centre, microphone 1, and the steering direction. The 3 dB width of the beam is 28 degrees, and the directivity index (DI) of the pattern is 14 dB.
(a) (b) (c)
Figure 1: (a) Geometry of spherical array, (b) photograph of 48 cm array, shown with 50 cm ruler, (c) beampattern
of array in 800 Hz 1/3-octave band.
The array was used in the following manner: A loudspeaker was used to produce a maximum length sequence (MLS) test signal, and the response of 8 of the array microphones was simultaneously recorded. This was performed a total of 4 times, so that all 32 responses were obtained. It was assumed that the system being measured was time invariant over the time required to perform these measurements. The traditional omnidirectional impulse response was calculated for each of the microphones. Beamforming these responses resulted in the set of 60 directional impulse responses corresponding to the 60 steering directions. By squaring and integrating these responses over a desired time range, the sound level arriving at the array position from each direction was obtained.
Identification of Weak Spots in Sound Insulation of Walls Gover & Bradley
Noise-Con 2005, Minneapolis, Minnesota, October 17-19, 2005
3. MEASUREMENTS OF TEST WALL
Measurements were conducted in a wall testing facility at the National Research Council in Ottawa. This is a suite of two reverberation rooms with a 2.44 by 3.66 m opening between them, for installation of the test wall. For the array measurements, an omnidirectional loudspeaker was placed about 2.3 m from the centre of the wall sample in the so-called “large” chamber (volume = 251 m3, reverberation time in 800 Hz 1/3-octave band = 3.8 s). This was used for the test stimulus. The array was located about 1.05 m from the centre of the other side of the wall, in the so-called “small” chamber (volume = 138 m3, reverberation time in 800 Hz 1/3-octave band = 4.3 s). Additional measurements performed included a standard ASTM E90 transmission loss test, and a scan of the wall with a single microphone. For this latter test, steady-state pink noise was generated in the large chamber, and the level in the 800 Hz 1/3-octave band (averaged over 30 s) was measured by a microphone in the small chamber. The microphone was located at 63 different locations, each 0.25 m from the test wall.
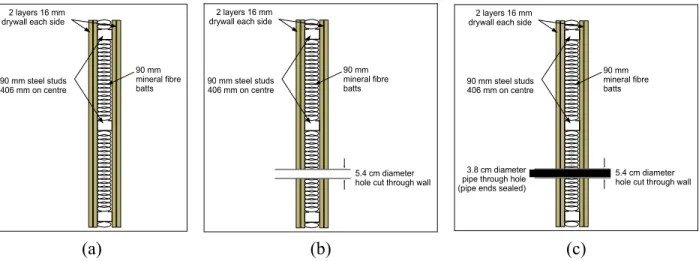
All measurements were performed with the wall in three configurations, indicated in Fig. 2. In the first configuration (Fig. 2(a)) there were no intentional leaks or problems with the test wall. The wall was constructed from 2 layers of 16 mm gypsum board mounted on each side of 90 mm steel studs (406 mm on centre). The wall cavity was filled with mineral fibre batts. In the second configuration (Fig. 2(b)), a 5.4 cm diameter round hole was drilled entirely through the wall. The hole was unobstructed. In the third configuration (Fig. 2(c)), a 3.8 cm diameter pipe was inserted through the previously drilled hole. The pipe was about 1.2 m long, was filled with foam and had the ends sealed. It was not touching the drywall; there was a gap of about 0.8 cm between the pipe and the drywall, however the mineral fibre was still in the cavity, touching the pipe within the wall.
2 layers 16 mm drywall each side
90 mm steel studs 406 mm on centre 90 mm mineral fibre batts 2 layers 16 mm drywall each side
90 mm steel studs 406 mm on centre 90 mm mineral fibre batts 5.4 cm diameter hole cut through wall
2 layers 16 mm drywall each side
90 mm steel studs 406 mm on centre 90 mm mineral fibre batts 5.4 cm diameter hole cut through wall 3.8 cm diameter
pipe through hole (pipe ends sealed)
(a) (b) (c)
Figure 2: Cross-section schematic of test wall. (a) first configuration, no intentional leaks in wall, (b) second
configuration, hole drilled through wall, (c) third configuration, sealed-end pipe inserted through hole.
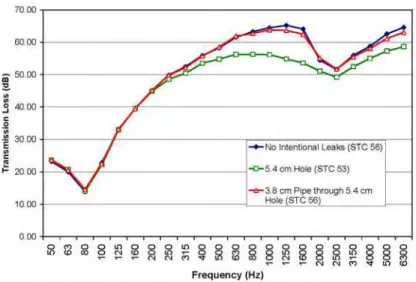
The results of the E90 tests, showing the transmission loss versus frequency are shown in Fig. 3. The STC values for the measurements were: No Intentional Leaks, STC 56; Hole Through Wall, STC 53, and Pipe Through Hole, STC 56.
Identification of Weak Spots in Sound Insulation of Walls Gover & Bradley
Noise-Con 2005, Minneapolis, Minnesota, October 17-19, 2005
Figure 3: Transmission loss versus frequency for the test wall in three configurations: No Intentional Leaks (filled
diamond symbols), STC 56; Hole Through Wall (open square symbols), STC 53; and Pipe Through Hole (open triangle symbols), STC 56.
The following three subsections show the results of measurement for the three test wall configurations. The array measurements are presented as uncalibrated levels projected onto the wall: The wall was first divided into 10 000 patches (100 by 100). Then, the direction to each patch from the array was computed. From the measured levels over the first 250 ms in the 60 steering directions, the level corresponding to the direction to each patch was interpolated. The results are shown as a greyscale plot of the wall with the grey level corresponding to the level arriving from the direction to each patch. The results from the 30 s average steady-state level are shown similarly as a greyscale plot of the wall, with the levels interpolated from the 63 measurement positions. All greyscale plots have a dynamic range of 10 dB from white (highest) to black (lowest). A measurement showing no grey level variation will therefore indicate a homogeneous wall with no localized weak spots.
A. No Intentional Leaks
(a) (b)
Figure 4: No Intentional Leaks: (a) levels arriving at array projected onto wall, and (b) levels at 0.25 m from wall.
The measurement with the array (Fig. 4(a)) indicates a variation of about 5 dB from the highest level to the lowest level. The measurement at 0.25 m (Fig. 4(b)) indicates a variation of about
Identification of Weak Spots in Sound Insulation of Walls Gover & Bradley
Noise-Con 2005, Minneapolis, Minnesota, October 17-19, 2005
3 dB. Presumably some variation of the level is inherent given the varying radiation efficiency over the wall. Qualitatively, however, the array measurement seems to indicate a stronger level localized near the top of the wall (near 160 mm lateral position, 210 mm vertical position, in the figure). This has been preliminarily investigated, and it may be due to a strong, early sound path through the wall (i.e., this part of the wall starts to radiate sound into the receiving room first).
B. Hole Through Wall
(a) (b)
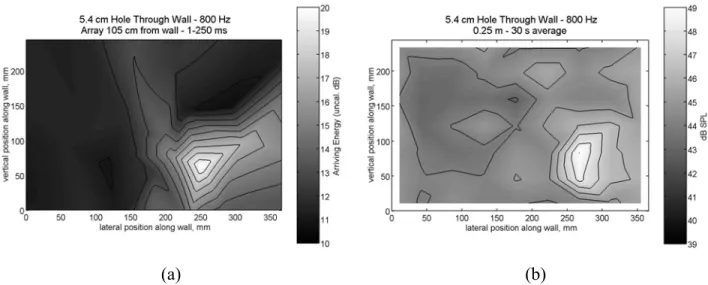
Figure 5: Hole Through Wall: (a) levels arriving at array projected onto wall, and (b) levels at 0.25 m from wall.
The array measurement (Fig. 5(a)) and the 0.25 wall scan measurement (Fig. 5(b)) correctly indicate the presence and location of the leak due to the hole in the wall (around 250 mm lateral, 65 mm vertical). This is qualitatively noticeable as a light coloured feature on the greyscale plots. The range of variation of level over the wall is about 10 dB for the array measurement and about 6 dB for the scan measurement.
C. Sealed Pipe Passed Through Hole in Wall
(a) (b)
Figure 6: Pipe Through Hole: (a) levels arriving at array projected onto wall, and (b) levels at 0.25 m from wall.
The array measurement (Fig. 6(a)) and the 0.25 wall scan measurement (Fig. 6(b)) both indicate the presence and location of the leak due to the pipe through the hole (around 250 mm lateral, 65
Identification of Weak Spots in Sound Insulation of Walls Gover & Bradley
Noise-Con 2005, Minneapolis, Minnesota, October 17-19, 2005
mm vertical). This is qualitatively noticeable as the light coloured feature on the greyscale plots, however the range of variation in level is only on the order of 5 dB for the array measurement and 3 dB for the scan measurement (less variation than before the pipe was inserted). These are comparable variations to those found with no intentional leaks, and in fact from the array measurement, the feature near the top of the wall (Fig. 4(a)) is noticeable in Fig. 6(a). Seemingly the “leak” due to the pipe through the hole is of minor importance, on the order of the natural variation over the wall. This is supported by the fact that the transmission loss difference from the No Intentional Leaks case is slight (Fig.3) and that the STC for both cases is 56. Nevertheless, both the array technique and the more labour intensive wall scan technique are able to localize this minor wall defect.
5. CONCLUSIONS
Use of a directional microphone array for identification of weak spots in the sound insulation of a wall has been demonstrated. These results were validated against a more time consuming “brute force” scan of the wall. Both types of measurement indicate that there are some natural variations of sound insulation across the wall. The time-gated array measurement indicates differences from the steady-state measurements at 0.25 m. This is to be expected, but the exact nature and reasons for the differences remains to be fully explored. In all cases, the array measurements indicate a greater dynamic range from maximum to minimum level, possibly since the steady-state measurements at 0.25 m are more influenced by the receiving room reverberation. Nevertheless, the results of the array measurement accurately indicate the presence and location of known leaks, even one as minor as the natural variations of sound insulation over the wall.
ACKNOWLEDGEMENTS
This work was partially funded by Public Works and Government Services Canada (PWGSC) and the Royal Canadian Mounted Police (RCMP).
REFERENCES 1
B. N. Gover, J. G. Ryan, and M. R. Stinson, “Microphone array measurement system for analysis of directional and spatial variations of sound fields,” J. Acoust. Soc. Am. 112, 1980–1991 (2002).
2
B. N. Gover, J. G. Ryan, and M. R. Stinson, “Measurements of directional properties of reverberant sound fields in rooms using a spherical microphone array,” J. Acoust. Soc. Am. 116, 2138-2148 (2004).
3
B. N. Gover, “Directional measurement of airborne sound transmission paths using a spherical microphone array,” Convention Paper 6276, Presented at the 117th Convention of the Audio Engineering Society, San Francisco, California, USA, October (2004).
4