Publisher’s version / Version de l'éditeur:
International journal of fatigue, 36, 1, pp. 120-129, 2011-09-06
READ THESE TERMS AND CONDITIONS CAREFULLY BEFORE USING THIS WEBSITE.
https://nrc-publications.canada.ca/eng/copyright
Vous avez des questions? Nous pouvons vous aider. Pour communiquer directement avec un auteur, consultez la
première page de la revue dans laquelle son article a été publié afin de trouver ses coordonnées. Si vous n’arrivez pas à les repérer, communiquez avec nous à PublicationsArchive-ArchivesPublications@nrc-cnrc.gc.ca.
Questions? Contact the NRC Publications Archive team at
PublicationsArchive-ArchivesPublications@nrc-cnrc.gc.ca. If you wish to email the authors directly, please see the first page of the publication for their contact information.
NRC Publications Archive
Archives des publications du CNRC
This publication could be one of several versions: author’s original, accepted manuscript or the publisher’s version. / La version de cette publication peut être l’une des suivantes : la version prépublication de l’auteur, la version acceptée du manuscrit ou la version de l’éditeur.
For the publisher’s version, please access the DOI link below./ Pour consulter la version de l’éditeur, utilisez le lien DOI ci-dessous.
https://doi.org/10.1016/j.ijfatigue.2011.08.009
Access and use of this website and the material on it are subject to the Terms and Conditions set forth at
Propagation of short fatigue cracks in permanent and semi-solid mold 357 aluminum alloy
Brochu, Myriam; Verreman, Yves; Ajersch, Frank; Bouchard, Dominique
https://publications-cnrc.canada.ca/fra/droits
L’accès à ce site Web et l’utilisation de son contenu sont assujettis aux conditions présentées dans le site LISEZ CES CONDITIONS ATTENTIVEMENT AVANT D’UTILISER CE SITE WEB.
NRC Publications Record / Notice d'Archives des publications de CNRC:
https://nrc-publications.canada.ca/eng/view/object/?id=8e677f3f-62d7-4c04-8e49-e4419386f6f0 https://publications-cnrc.canada.ca/fra/voir/objet/?id=8e677f3f-62d7-4c04-8e49-e4419386f6f0
Propagation of short fatigue cracks in permanent mold and semi-solid cast 357 aluminum alloy
Myriam Brochu1, Yves Verreman1, Frank Ajersch1, Dominique Bouchard2
1 École Polytechnique de Montréal, C.P. 6079, Succ. Centre-Ville, Montréal, Qc, Canada,
H3C 3A7
2 Centre des Technologies de l’Aluminium, 501, boul. de l’Université Est, Saguenay, Qc,
Canada, G7H 8C3
Keywords: aluminum 357 alloy, casting, semi-solid molding, fatigue strength, microstructurally short crack
Abstract
The high cycle fatigue strengths of aluminum-silicon-magnesium 357 alloy prepared by permanent molding and semi-solid molding are compared at stress ratios R = -1 and
R = 0.1. Results show that precipitation hardened permanent mold (PM) and semi-solid
mold (SSM) materials have fatigue strengths at R = -1 and 107 cycles of 82 and 113 MPa respectively while those at R = 0.1 are 47 MPa and 78 MPa respectively. Part of this difference is explained by the fact that the SSM specimens contain fewer and smaller defects than the PM specimens.Defects reduce the duration of the short crack propagation period, which significantly affects the overall specimen fatigue life. A comparative analysis of the long crack behaviour indicates that the PM microstructure is more resistant to the propagation of long cracks than the SSM microstructure because crack closure is more significant. However, the long crack behaviour cannot be used to predict the specimen fatigue life, which mainly consists of short crack propagation. Observation of many short cracks using the replication technique indicates that grain boundaries are the most
important microstructural barrier to short crack propagation in these materials. The results also show that crack growth decelerations occur at a crack depth comparable in size to the average grain radius of the materials. The difference in the distance of these important microstructural barriers can explain the fatigue strength difference measured. It is
concluded that the average fatigue strength is inversely proportional to the square root of the average grain size.
Nomenclature
α Aluminum rich phase and primary constituent of the 357 alloy
αsize SDAS for PM material and globule size for SSM material
σo Yield strength
σa Stress amplitude
σf’ and -b Basquin’s power law parameters
σm = (σmax+σmin)/2 Average applied stress
σmax Maximum applied stress
σmin Minimum applied stress
∆K SIF range
∆Keff = U ∆K Effective SIF range
∆Kmsc SIF range limit for the propagation of microstructurally short cracks
∆Kmb Critical SIF range of a microstructural barrier
∆Kth SIF long crack threshold
∆P = Pmax-Pmin Load range in a fatigue cycle
∆σ = σmax - σmin Nominal stress range in a fatigue cycle
a Crack depth
B Thickness of the CT specimen
b Half-width of the hourglass specimen
c Half- surface length of a semi-elliptical crack Ci, mi Parameters of the Paris relationship
CT Compact-tension specimen
D Average equivalent spherical diameter of the grains d Distance of the first microstructural barrier
da/dN Crack growth rate in the a direction EBSD Electron backscattering diffraction EPFM Elastic-plastic fracture mechanics
FCGR Fatigue crack growth rate
H Height of the CT specimen
HF Hydrofluoric acid
LEFM Linear elastic fracture mechanics
N Number of cycles to failure
n Number of elapsed cycles
ni Number of cycles at crack initiation
nmsc Number of cycles for the propagation of microstructurally
short cracks
nrs Number of cycles to restart the propagation of a short crack
Pmax Maximum load in a fatigue cycle
Pmin Minimum load in a fatigue cycle
Pop Crack opening load in a fatigue cycle
PM Permanent mold
R = σmin/σmax Stress ratio
S-N Diagrams giving the number of cycles to failure as a function
of the stress amplitude
SDAS Secondary dendrite arm spacing
SIF Stress intensity factor
SSM Semi-solid mold
t Thickness of the hourglass specimen
U = (Pop-Pmin)/∆P Effective portion in a load cycle
Introduction
Numerous results in the literature indicate that aluminum 357 alloy has better high cycle fatigue strength when produced by semi-solid molding rather than by conventional casting in a permanent mould [1-3]. The improvement in the fatigue strength of aluminum alloys produced by semi-solid technologies has been partly explained by a reduction in the defect content and size [1, 4]. Rheocasting and thixocasting are known in the industry to be high integrity processes that can produce components with fewer defects [5]. This is attributed to the smaller volume of solidification shrinkage and entrapped gases in semi-solid molding when compared to liquid molding.
However, permanent mold (PM) and semi-solid mold (SSM) castings also have significantly different microstructures. The PM microstructure has a dendritic primary alpha phase and the SSM microstructure has a globular alpha phase. PM casting generally produces coarser microstructures with grain in the size range of 180 to 1,500 µm [1, 6] whereas SSM microstructures are characterized by a grain size in the range of 30 to 200 µm [1, 7, 8]. It is still not clear how these microstructural features affect the fatigue behaviour of the solidified alloys. When comparing the fatigue behaviour of PM and SSM specimens, the influence of the defects is often predominant which makes it very difficult to isolate the effect of other microstructural features [8]. However, the recent results of Brochu et al. [1] showed that the lower fatigue strength of the PM material could not be explained entirely by premature crack initiation at defects and the grain size as been identified as an important microstructural feature.
The objective of this paper is to study the propagation behaviour of short cracks in order to understand the improved fatigue strength of the SSM material. First, S-N diagrams for PM and SSM 357 alloy are presented at R = -1 and R = 0.1. The presence of defects at the crack initiation sites is studied in order to explain the data scatter. The propagation behaviour of long cracks is then characterized at R = 0.1 using CT specimens. Then, the propagation of the short cracks is studied in details at R = 0.1 using the replication technique. Comparative
da/dN-∆K diagrams of the long and short cracks are presented and analysed. In the
discussion, the difference in the fatigue strength between the PM and SSM materials is explained based on the propagation characteristics of microstructurally short cracks.
2. Methodology 2.1 Materials
One series consisting of uniform thickness, 14 mm thick, rectangular plates was gravity cast in a permanent mold. Two other series of rectangular wedge plates, with variable thickness from 16 to 9 mm, were rheomolded in the semi-solid state using an industrial pressure die casting machine. A detailed description of the rheomolding process used to produce the SSM plates was given by Doutre et al. [9]. The PM plates and the first series of SSM plates were produced from unmodified 357 alloy whereas strontium was added to produce the second series of SSM plates (SSM-Sr). For all three batches, the initial melt was produced from 356.2 ingots with addition of magnesium and silicon to reach the chemical composition of a 357 alloy. No grain refinement agent was added to the melt,
which already contained about 0.10%Ti from the 356.2 ingots. Greater detailed of the feedstock preparation and chemical compositions have been given in a previous paper [1].
The PM specimens were heat treated at T6 temper but the SSM specimens were heat treated at T5 temper. A complete description of the heat treatment procedures is given in [1]. T5 heat treatment was chosen because T6 heat treatment created blisters in the SSM plates. Three different types of plates were produced and tested: PM-T6, SSM-T5 (unmodified) and SSM-Sr-T5 (modified). All the plates were X-rayed and only the specimens with a quality corresponding to ASTM B108-03 grade B or better (discontinuities smaller than 1 mm) were used for the fatigue tests.
2.2 Microstructural characterization and mechanical properties
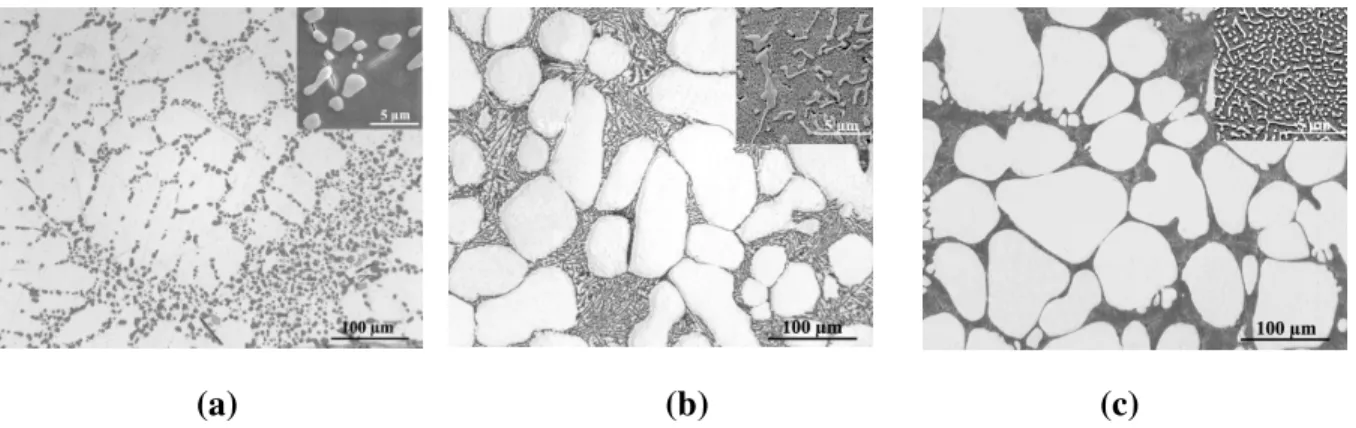
The microstructure of each type of plate was characterized by metallographic examination of polished and etched sections. Typical microstructures of the PM-T6, SSM–T5 and SSM-Sr-T5 specimens are shown in Fig. 1. It can be observed that the alpha phase is dendritic in the PM specimen (Fig.1a) and globular in the SSM specimens (Fig. 1b and 1c). A more detailed micrograph of the eutectic constituent is also given in the upper-right corner of each figure. The eutectic silicon particles of the permanent mold specimen were
globularized during heat treatment as seen from the insert in Fig. 1a. On the other hand, the eutectic constituent of the SSM-T5 specimens is composed of plate like silicon particles that characterizes unmodified microstructures (insert in Fig.1b). However, in the modified microstructure of the SSM-Sr-T5 specimens, the eutectic silicon particles are fine and
Both Poulton macroetching and electron backscattering diffraction (EBSD) analyses were carried out to reveal the grain structure. The grain and alpha phase cell sizes of each
material were measured using an image analysis software and are presented in Table 1. The results show that the PM microstructure has coarser grains but smaller alpha phase cell size than the SSM microstructure.
(a) (b) (c)
Figure 1: Microstructures of the plates: (a) permanent mold (PM-T6), (b) unmodified and semi-solid mold (SSM-T5) and (c) modified and semi-solid mold (SSM-Sr-T5).
Table 1: Average microstructural characteristics and yield strengths
D (µm)
Alpha phase cell size
σo(MPa) SDAS (µm) ϕsph (µm)
PM-T6 310 43 ---- 264
SSM-T5 115 ---- 80 184
SSM-Sr-T5 115 ---- 80 184
The tensile properties were measured on subsize ASTM B557-06 specimens having a square section of 40.32 mm2. Tests were carried out using a servohydraulic machine and a 25.4 mm extensometer. The average yield strengths measured are given in Table 1. The
SSM materials have lower yield strengths than the PM material because they were heat treated T5 rather than T6.
2.3 Fatigue tests
2.3.1 Constant amplitude axial tests
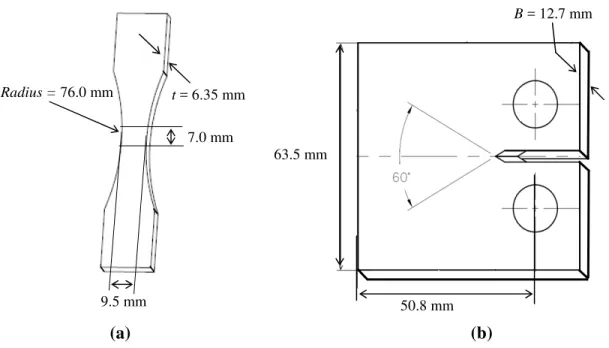
The tests were carried out on standardized ASTM E466-07 hourglass specimens with a rectangular reduced section of width 2b = 9.50 mm and thickness t = 6.35 mm (Figure 2a). It was shown that the hourglass specimens overestimate the alloy fatigue strength by 15% when compared to the results obtained from specimens of uniform test section [10]. Nevertheless, the hourglass geometry was chosen in order to facilitate short crack monitoring because it promotes crack initiation in a small region at the specimen mid-length. The specimen calibrated length was limited to 3.5 mm on either side of the centerline. In this region,the average stress on a plane is within 2 % of the nominal stress calculated at the specimen centerline. All tests for which failure occurred outside this calibrated length were rejected. Before testing, all specimen surfaces were polished using a 1 µm diamond paste and etched in a solution containing 1 % hydrofluoric acid (HF). The axial fatigue tests were carried out using a servohydraulic machine at stress ratios of –1 and 0.1 and at a frequency of 20 Hz. The constant stress amplitudes of the tests were chosen in order to obtain fatigue lives between 104 to 107 cycles. The number of tests and rejections are presented in Table 2.
Table 2: Number of tests and rejections
R = -1 R = 0.1
Total tests Rejections Total tests Rejections
PM-T6 14 2 8 1
SSM-T5 15 3 6 1
SSM-Sr-T5 14 8 9 4
Seven out of the 12 rejected SSM-Sr-T5 specimens were cut from two specific plates. Visual observation of the fracture surfaces showed longitudinal oxide films that were not detected during X-ray inspection. This explains the higher rejection rate obtained for the SSM-Sr-T5 material.
(a) (b)
Figure 2: Drawings of the (a) hourglass specimen and (b) CT specimen. 2.3.2 Long crack monitoring
Fatigue crack growth rate (FCGR) tests were conducted on compact-tension (CT) test specimens (Fig. 2b) at a stress ratio R = 0.1 and at a frequency of 20 Hz. The compliance technique was used to monitor the crack advance and the secant method was used to
7.0 mm Radius = 76.0 mm 9.5 mm t = 6.35 mm 50.8 mm B = 12.7 mm 63.5 mm
calculate the crack growth rate from the a-N curves. A detailed description of the experimental procedure and of the data analysis is given in the work of Rose [11].
2.3.3 Short crack monitoring
Short crack monitoring was performed on specimens tested at stress amplitudes chosen to result in fatigue life between 105 and 106 cycles. Naturally initiated cracks ranging in length, 2c, from 50 µm to 6 mm were measured from silicon replicas of the specimens surfaces taken at periods of 50,000 fatigue cycles or less and at a tensile hold of 90 % σmax. The crack surface length, 2c, is defined as the projected length normal to the loading direction.
Most of the tested specimen failures were caused by a semi-elliptical crack that nucleated at the small side of the specimen (Fig. 3). For simplicity, the short crack was considered to have a semi-elliptical constant aspect ratio. The crack front irregularity that evolves during propagation [12] is neglected. An aspect ratio of crack depth, a, to surface crack length, 2c, of 0.36 was used based on fractographic observations of the broken specimens.
Bolingbroke et King [13] used a constant aspect ratio of 0.43 in a study conducted on short cracks in a high strength aluminum alloy. Corner cracks were responsible for the failure of 2 specimens out of 10. For these cracks, the measurements of the crack length (c) and the crack depth (a) were performed on replicas taken from both the small and the large sides of the specimen (Fig 3c).
Figure 3: Schematic illustrat corner crack; (b) a semi-ellip
The stress intensity factor rang using half the surface length of stress range (∆σ) that was appl
The values of F and Q were d The parametric angle of the ell crack. The crack growth rate (
N data collected for each speci
3. Results
3.1 S-N diagrams
In Figs. 4a and 4b, a set of resu of results represents the S-N cu material, the effect of the modi
rations of: (a) a S-N fatigue specimen with a sur lliptic surface crack and (c) a quarter-elliptic co
nge for both crack geometries was calculated from of the crack (c), the depth of the crack (a) and the pplied during a test.
Q a b c c a t a F K , , ,φ σ π =
determined according to the method of Newman ellipse φ is 180° for a semi-elliptical crack and 90 e (da/dN) was measured by the secant method appl ecimen.
esults represents the S-N curve for the PM alloy an curve for both the SSM and SSM-Sr materials. Fo odification of the eutectic structure is not predomin
urface and a corner crack. om equation 1 the nominal Equation 1 an et al. [14]. 90° for a corner pplied to the
and second set For the SSM minant, at R = -1
and R = 0.1. Both Figs. 4a and 4b show that the SSM material is more resistant to fatigue than the PM material. However, the results scatter is significant. This is attributed to the presence of defects of variable sizes and geometries at the crack initiation sites.
Fractographic observations of the specimens showed that short fatigue life is associated with large defects and that there are more defects in the PM specimens than in the SSM specimens. In fact, 17 out of 23 PM specimens have a shrinkage cavity or an oxide film near the free surface. On the other hand, 8 out of 23 SSM specimens are defective.
(a) (b)
Figure 4: S-N diagrams from PM and SSM specimens tested at (a) R = -1 and (b) R = 0.1
Shrinkage cavities are more frequently observed in the PM specimens andoxide films are predominant in the SSM specimens as shown in Fig.5a and 5b respectively. The size range of the defects is also bigger for the PM specimens. The square root area of the defects is between 60 µm to 1.7 mm and between 55 µm to 400 µm for the PM and SSM materials respectively. Based on similar observations, Wang et al. [15] concluded that the fatigue
R = -1 8 S tr e s s a m p lit u d e , σa ( M P a )
Number of cycles to failure, N
103 104 105 106 107 10 50 60 70 80 90 200 100 PM-T6 SSM-T5, SSM-Sr-T5 defect free specimens mean regressions 150
Number of cycles to failure, N
103 104 105 106 107 108 20 30 40 50 60 70 80 90 100 PM-T6 SSM-T5, SSM-Sr-T5 defect free specimens mean regressions 170
size. However, recent results s SSM aluminum 357alloy cann
(a)
Figure 5: Defects observed in specimen tested at σa====74M specimen σa=96MPa (N = 1
The Basquin’s power law,σa= lines in Fig. 4. The values of th coefficient σf′ of the regression not modify the fatigue strength material has a higher fatigue st strength exponent commonly c that can have an effect similar initiation.
As a result of the difference in strengths between the PM and indication that either or both th
s show that the difference in fatigue strengths betw nnot be explained entirely by the effect of defects
(b)
in fatigue test specimens: (a) shrinkage cavity MPa (N = 2.41 ×××× 105cycles) and (b) oxide film in
1.20 ×××× 105 cycles).
b
N− ′
=σf , was used to make data regressions as sh
f the fatigue strength exponent b and of the fatigue ions are given in Table 3. Results show that the str gth exponents of the regressions. On the other han strength exponent than the SSM material. High fa y characterises notch specimens [16]. Defects are s lar to notches by reducing the number of cycle for
in the fatigue strength exponents, the difference i nd SSM material increases with the number of cyc the fatigue crack initiation and the short crack pro
etween PM and ts [1]. ty in a PM-T6 in a SSM-T5 shown by the ue strength stress ratio did
and, the PM fatigue re stress raisers or crack e in fatigue ycles. This is an propagation are
the mechanisms responsible for the improved fatigue strength of the SSM material. In high cycle fatigue, crack initiation and short crack propagation contribute to the major portion of fatigue life as shown by Plumtree et al. [17] and Brochu et al. [1].
Table 3: Coefficients of the Basquin’s power law and fatigue strengths at 107 cycles
R = -1 R = 0.1 f σ′ (MPa) b Fatigue strength at 107 cycles f σ′ (MPa) b Fatigue strength at 107 cycles PM-T6 366 0.093 82 226 0.094 47 SSM-T5 237 0.046 113 155 0.044 78
The values of the mean fatigue strength at 107 cycles were calculated from the regressions and are also presented in Table 3. At both stress ratios, the fatigue strength of the SSM material is 31 MPa higher than the fatigue strength of the PM material. This is, in part, attributed to the difference in the defect content and size. However, the behaviour of defect free specimens (marked with a cross in Fig. 4) shows that the SSM material is intrinsically more resistant to fatigue than the PM material as was concluded in [1].
Finally, the effect of the stress ratio on the material fatigue behaviour is conventional. For a given σa, increasing the mean fatigue stress (σm) decreases the number of cycles to failure. The average fatigue strengths at 107 cycles and at R = -1 and R = 0.1 are close to the predictions of the modified Goodman diagram.
3.2 Crack propagation 3.2.1 Long cracks
The fatigue crack growth rate results are shown in Fig. 6a. The PM material has the highest crack growth threshold (∆Kth = 5.3 MPa m) followed by the unmodified SSM material (∆Kth = 4.4 MPa m) and the modified SSM material (∆Kth = 3.9 MPa m). Above the threshold, the crack growth rate is higher for both SSM materials than for the PM material. This cannot explain the fatigue strengths difference measured previously.
(a) (b)
Figure 6: Fatigue crack growth rate diagram of the PM and SSM materials.
Lados et al. [8] proposed that the SSM materials have lower crack growth thresholds and faster crack growth rate because they develop less roughness induced crack closure. To verify this hypothesis, the crack opening loads of the specimens were measured during each cycle and da/dN-∆Keff diagrams were produced as shown in Fig. 6b. When ∆Keff is used, the PM and SSM materials have comparable long crack growth rate. These results confirm that the difference in the growth rates of long crack between the materials is due to closure.
Effective stress intensity factor, ∆Keff (MPa*m0.5)
1 10 10 -9 10 -8 10 -7 10 -6 10 -5 10 -4 10 -3 10 -2 10 -1 PM-T6 SSM-T5
Stress intensity factor range, ∆K (MPa*m0.5)
1 10 PM-T6 SSM-Sr-T5 SSM-T5 10 -9 10 -8 10 -7 10 -6 10 -5 10 -4 10 -3 10 -2 10 -1 C ra c k g ro w th r a te , d a /d N (m m /c y c le )
For ∆Keff values between 2 and 8 MPa m, the crack growth rate of both materials can be characterized by a unique Paris-Elber relationship:
da/dN = 1.26 ×10⁻⁷ (∆Keff) 3.25 Equation 2
where da/dN is in mm/cycle, and ∆Keff in MPa m. The ∆Keff threshold is in the range of 1.5MPa mbut much scatter is observed at low values of ∆Keff .
3.2.2 Short cracks a-n graphs
Monitoring of short cracks at R = 0.1 was made by measuring the surface crack length (2c) from silicone replicas taken regularly during a S-N fatigue test. More than one crack could be monitored on the same S-N specimen because secondary cracks often grew at the same time as the main crack. Fig. 7a shows the a-n curves for the main crack of a PM specimen. The crack depth, a, is 0.72c as explained previously and n is the number of elapsed cycles. Fractographic observations of the specimen showed the existence of a shrinkage cavity at the crack initiation site with a depth of about 140 µm, which is the initial length reported in the graph of Fig.7a.
Even though the crack initiated from a defect, fractographic observations showed that the crack propagated on crystallographic plans oriented for maximum shear stress (stage I propagation – crack opening mode II) for about 70 m. Evidence of crack opening mode II is also seen from the replicas shown in Figs. 7b and 7c.
(a) Figure 7: Short crack propag (N = 8.25 ×××× 105 cycles); (a) a-replica taken at n = 3.09 ×××× 10 observed on the fracture surf
Two significant crack growth d 3.09 × 10⁵ cycles (Fig.7a). Obs that the first crack growth dece cluster of silicon particles. At t cell boundary. Observation of that the left end of the crack di cycles. Only the right end of th measured. The propagation of approached an alpha phase cel important crack growth decele
Elapsed cycles, n 0 105 2x10⁵ 3x10⁵ 4x C ra c k d e p th , a ( µ m ) 0 100 200 300 400 500
Crack growth decelerations
pagation in a PM-T6 specimen tested at σa = 62
-n curve, (b) replica taken at n = 1.66 ×××× 105 cyc 105 cycles. The shaded areas correspond to the urface.
th decelerations were recorded at 1.66 × 10⁵ cycles bservations of the replica taken at n = 1.66 ×10⁵ ( eceleration occurred when the left end of the crack t the same time, the right end of the crack approac of the second replica taken at 3.09 × 10⁵ cycles (Fi
did not grow perceptibly between 1.66 ×10⁵ and 3 f the crack propagated explaining the slow growth of the right end decelerated at n = 3.09 × 10⁵ cycle cell boundary (Fig.7c). This corresponds to the sec eleration. n 4x10⁵ 5x10⁵ 6x10⁵ (b) (c) MPa cycles and (c) the defect les and (Fig.7b) show ck reached a oached an alpha (Fig.7c) shows 3.09 × 10⁵ th rates cles when it econd Crack opening mode II
Not all phase boundaries created important crack growth decelerations as can be seen from the graph in Fig.7a. Phase transitions within the same grain are probably weaker
microstructural barriers than a phase transition occurring at grain boundaries. Complete crack arrest was observed in one PM specimen tested at 62 MPa. This specimen has a fatigue life N = 2.35 ×10⁶ cycles.
In conventionally cast aluminum alloys, crack growth decelerations at grain boundaries have been observed previously [12, 19, 18]. However, our results bring the first evidences that microstructurally short crack propagation is important even for cracks that nucleate from defects comparable in size to the grain diameter.
The same analysis was carried out for a SSM specimen. The a-n curve of the main crack is given in Fig.8a. Fractographic observations showed that the crack initiated in the alpha phase and it propagated on a plan of maximum shear stress for about 50 µm. The crack could be seen from the replicas after 10,000 cycles.
The most important crack growth decelerations were observed at n = 3.11 ×10⁴ cycles,
n = 1.09 ×10⁵ cycles and n = 1.23 ×10⁵. The replicas in Figs. 8b and 8c show that it
occurred when one end of the crack stopped propagating. At n = 3.11 ×10⁴ cycles, the left end of the crack stopped propagating for about 30 000 cycles because of an alpha phase cell boundary. Then, at n = 1.09 ×10⁵ cycles, the right end of the crack stopped its propagation at an eutectic pool. The left end of the crack encountered another alpha cell boundary at 1.23 × 10⁵ cycles.
Figure 8: SSM-T5 S-N specim (N = 2.13 ×××× 105 cycles); (a) a-(c) replica taken at n = 1.23
The replicas also show crack b overcome the first alpha phase specimens (about 20 short crac when a crack tip encountered a Complete crack arrests were ob 78 MPa for which N = 2.66 ×1
N = 4.41 ×10⁵ cycles. The seco
There are few results on short replication method, Han et al. [ SSM microstructure than in a c conclusions by comparing the
Elapsed cycles, n 0 5.0x10⁴ 105 1.5x10 C ra c k d e p th , a(µ m ) 0 100 200 300 400 500 (a)
Crack growth decelerations
cimen tested at tested at σa = 86 MPa
-n curve, (b) replica taken at n = 3.11 ×××× 104 cyc
×××× 105 cycles.
k branching at point A (see Fig. 8c). Branching occ se cell encountered at 3.11 ×10⁴ cycles. Among th racks monitored), decelerations were more frequen d a new α phase cell than when it encountered an
observed in two SSM specimens. One specimen t ×106 cycles and another tested at 92 MPa for whic
econd specimen had a corner crack.
rt crack propagation in SSM materials [ 19, 20]. U l. [19] found that short cracks propagate faster in a a coarser PM microstructure. Hayat et al. [20] cam he short crack propagation in a rheocast and a sque
n 105 2.0x10⁵ 2.5x10⁵ (b) (c) A A cycles and occurred to the 10 tested uently observed n eutectic pool. n tested at hich . Using the in a fine grain ame to similar ueeze cast
A356 alloy. Both authors concluded that grain boundaries in the SSM microstructure create a weak obstruction to the propagation of short cracks. Our results bring the first evidences that grain boundaries can be effective microstructural barrier to crack propagation in SSM materials.
da/dN-∆∆∆∆K diagrams
Fig.9a presents the FCGR diagrams of the cracks analysed in Figs.7 and 8. The data points are joined by a line to better show the irregularities in the crack growth rate. Results show that short cracks can decelerate several times even for increasing values of ∆K. For both materials, rapid accelerations typically follow crack growth decelerations. In the previous section, it was shown that the crack growth decelerations occurred when a crack tip reaches a phase boundary. On this basis, the short cracks studied are qualified microstructurally short cracks because their propagation is very sensitive to the heterogeneity of the microstructure [21].
The entire short crack results are shown in Fig. 9b where no line is drawn to join the data points. Crack arrests are presented by points on the abscissa. The results were gathered from several S-N tests carried out at stress amplitudes between 62 and 74 MPa for the PM specimens and between 78 and 97 MPa for the SSM specimens. For both materials, short crack propagation at ∆K values below the ∆Kth of long cracks has been recorded. This can be explained by a difference in crack closure. The wake of a short crack is limited and as a result, crack closure cannot develop as much as in a long crack. However, the mean crack
growth rates of the short cracks are below the da/dN-∆Keff line. This is an indication that the short cracks are not completely closure free. Rubbing debris has been observed on the fracture surfaces of the S-N specimens which are evidences of closure.
Figure 9: Fatigue crack growth rate diagrams of short cracks in the PM-T6 and SSM-T5 materials: (a) cracks presented in Figs. 7 and 8 and (b) complete results compared with long cracks trends.
Stress intensity factor range, ∆K (MPa*m0.5)
1 10 C ra c k g ro w th r a te , d a /d N ( m m /c yc le ) 10-9 10-8 10-7 10-6 10-5 10-4 10-3 10-2 10-1 PM -T6 SSM - T5
Stress intensity factor range, ∆K (MPa*m0.5)
1 10 C ra c k g ro w th r a te , d a /d N ( m m /c yc le ) 10-9 10-8 10-7 10-6 10-5 10-4 10-3 10-2 10-1 PM-T6, σa = 62 MPa SSM-T5, σa = 86 MPa SSM PM (a) (b) R = 0.1 R = 0.1 Crack arrest
The results in Fig.9b also show that the mean growth rates of the short cracks in the PM and SSM microstructure are comparable. Moreover, the results of tests done at different stress amplitudes belong to the same scatter band. It appears that a Paris equation can be used to fit the short crack results:
da/dN = 54.36 ×10⁻⁷ (∆K) 3.24 Equation 3
where da/dN is in mm/cycle, and ∆K in MPa m.
Nevertheless, important crack growth decelerations and accelerations are observed for ∆K values below 4.0 MPa m. This behaviour cannot be predicted by equation 3. The amplitude of these perturbations increases with decreasing ∆K. At ∆K values below
2.4 MPa m, crack arrests were recorded in two SSM specimens and in one PM specimen. All the crack arrests recorded were temporary; crack growth restarted after pausing for 1 × 10⁴ to 100 × 104 cycles. A crack arrest observed at the specimen surface does not necessarily mean that internal crack growth does not exist. A tomographic analysis by Ludwig et al. [12] shows that the front of a short crack does not proceed along a regular circular line and finger-like crack extensions can develop in grains oriented favourably.
One important difference can be observed between the behaviour of the short cracks in the PM and SSM materials. Crack growth rate decelerations below 2MPa m are only observed in the SSM specimens. There are few results at ∆K values below 2MPa m for the PM material. One explanation for this is the initial crack size, ao. All the main cracks
initial ∆K above 1.9MPa m. This difference in the short crack behaviour of the PM and SSM materials is important and will be discussed in the next section.
4. Discussion 4.1 Fatigue life
The S-N data of Fig. 3 clearly show that the PM specimens have a shorter fatigue life than the SSM specimens at given stress amplitude. It was also observed that defects are more frequently found at crack initiation sites in the PM material than in the SSM material, which can cause a difference in the crack initiation period. However, the replicas obtained for some tests performed at R = 0.1 shows, for both materials, that the portion of fatigue life (ni/N) during crack initiation is not a significant portion of the total fatigue life (Table 4). The highest (ni/N) measured is 19 % for a defect free SSM specimen. The number of cycles for crack initiation, ni, is the number of cycles elapsed when the first crack growth is observed on a replica. Since replicas are taken periodically, ni can be overestimated but not underestimated.
The results in Table 4 show that the fatigue crack initiation period is not long enough to explain the fatigue life differences between PM and SSM specimens tested at comparable stress amplitudes. Therefore, a more detailed analysis of the crack propagation behaviour is necessary.
Table 4: Fatigue lives for crack initiation and short crack propagation at R = 0.1 σσσσa (MPa) N (cycles) Defect size (µm2) ni/N nmsc/N ( 4.5 MPa m) Remaining fraction of life PM-T6 62 825 000 251 0.02 0.59 0.49 62 2 352 060 99 0.18 0.73 0.09 70 452 831 264 0.11 0.62 0.27 74 241 553 81 0.09 0.57 0.34 SSM-T5 78 2 665 640 87 0.01 0.89 0.10 86 213 974 0 0.10 0.79 0.11 91 124 082 71 0.13 0.75 0.12 92* 440 956 0 0.08 0.86 0.06 96 119957 72 0.19 0.48 0.33 97* 181 807 0 0.07 0.60 0.27 * Corner crack
Analysis of the propagation of short cracks gives the most significant information to the interpretation of the S-N curves. The number of cycles in the microstructurally short crack regime, nmsc, was calculated for each specimen. Since short cracks were monitored at different stress amplitudes, nmsc is defined by the number of cycles from crack initiation to
∆K = 4.5MPa m. This definition well represents the short crack behaviour in both materials. In Fig.10b, all the significant crack growth decelerations and accelerations occurred at ∆K< 4.5MPa m. Above this value, the short crack behaviour can be predicted by a Paris relationship.
The fraction of the specimen life spent in the microstructurally short crack regime, (nmsc/N), is given in the seventh column of Table 4. These results show that for both materials and all stress amplitudes, a major portion of the fatigue lives is consumed for the propagation of
microstructurally short cracks. Moreover, the proportion of life spent for the propagation of microstructurally short crack generally increases as the stress amplitude decreases.
The fatigue life of a specimen is significantly influenced by the number of cycles for short crack propagation. For example, the two PM specimens tested at σa = 62 MPa have an absolute fatigue lives difference of 1.52 ×10⁵cycles. The difference in the number of cycles
for short crack propagation in these specimens is 1.23 ×10⁵ cycles which is 80% of the fatigue life difference. The same observation can be made for the two SSM specimens tested at 91 and 92 MPa. In this second example, the short crack propagation accounts for 90% of the total fatigue lives difference of the specimen. In these two examples, it appears that the presence of a defect at the crack initiation site significantly reduced the short crack propagation period and as a result the overall fatigue life.
Defects shorten the short crack propagation for three reasons. First, it reduces the number of cycle necessary to reach ∆Kmsc because crack propagation begins at a larger crack size, ao. The second reason is based on the assumption that defects raise the stress locally
increasing the driving force of the short crack. The third reason applies to microstructurally short cracks. Big enough defects will extend over the first microstructural barrier letting the crack grow longer before it encounters its first effective microstructural barrier. This longer crack will have a higher driving force and will overcome the microstructural barrier more easily. It is believe that this third effect has a big influence on the specimen fatigue life.
4.2 Fatigue strength at 107 cycles
The results presented in Fig. 9b show crack arrests in both materials for values of ∆K below 2.4 MPa m. This is an indication that the most important microstructural barriers have a resistance characterized by a ∆K value of about 2.4 MPa m. Based on the results presented in the previous sections, it is proposed that the most important microstructural barriers are grain boundaries. The value of ∆Kmb = 2.4 MPa m thus characterizes grain boundaries with large misorientation angles. These grain boundaries will arrest the propagation of cracks having a driving force smaller than 2.4 MPa m. There are also weaker grain
boundaries explaining that cracks can decelerate without stopping even at ∆K values below 2.4 MPa m(Fig.9b).
Crack arrests at a grain boundary are temporary. After a number of cycles, nrs, the crack build up the necessary driving force to overcome the microstructural barrier and the propagation restarts. The mechanism allowing the crack to overcome a microstructural barrier, is probably dependant on the size of the cyclic plastic zone, ryc, ahead of the crack tip. Intuitively, nrs increases with decreasing ryc. At low stress amplitude, the number of cycle necessary to overcome the first microstructural, nrs, can be very significant which will increase the fatigue life of a specimen.
To obtain fatigue lives of 107 cycles and longer, it is believed that the crack propagation has to be interrupted momentarily. In other words, the stress intensity factor range of the crack must be below ∆K when the crack encounters its first important microstructural
barrier. This short crack propagation threshold can be used to explain the fatigue strengths difference between the PM and the SSM materials. The difference between the materials is not the intensity of the microstructural barrier, ∆Kmb, but its position, d, in the path of a short crack. In the coarse PM-T6 microstructure grain boundaries are more distant than in the fine SSM microstructure. This is illustrated in Fig.10 showing the crack growth rate as a function of the crack depth.
(a) (b)
Figure 10: Crack growth rate vs. the crack depth in (a) the PM material and (b) the SSM T5 material.
Using the least square method proposed by Hobson et al. [22], the crack depth at complete crack arrest has been calculated for 5 short cracks in the PM microstructure and 5 other ones in the SSM microstructure. The results show that in the PM microstructure, the first significant crack growth deceleration is more frequently observed at crack depths between 60 µm to 360 µm. On the other hand, in the SSM microstructure the short cracks are
subjected to a first important crack growth deceleration at depths between 11 µm to 211µm.
Crack depth, a (µm) 0 100 200 300 400 C ra c k g ro w th r a te , d a /d N ( m m /c y c le ) 0 10-6 2x10⁻⁶ 3x10⁻⁶ 4x10⁻⁶ 5x10⁻⁶ Crack depth, a (µm) 0 100 200 300 400 C ra c k g ro w th r a te , d a /d N ( m m /c y c le ) 0 10-6 2x10⁻⁶ 3x10⁻⁶ 4x10⁻⁶ 5x10⁻⁶
These values are in the range of the grain size distribution as seen in Fig. 11, which supports the hypothesis that grain boundaries are the important microstructural barriers.
(a) (b)
Figure 11: Grain size distribution in (a) the PM-T6 microstructure and (b) the SSM-T5 microstructure.
A relationship between the fatigue strength of the materials and the position of the microstructural barrier, d, can be proposed. Assuming that a fatigue life of 107 cycles can only be attained if the main crack is stopped at a microstructural barrier, the stress
amplitude for ∆K = ∆Kmb can be calculated using equation 1. For both materials ∆Kmb = 2.4
m
MPa and the crack size is replaced by the average position of the first microstructural barrier. For the PM material with a barrier positioned at an average distance of 165 µm, a stress amplitude of 52 MPa is necessary to obtain 2.4 MPa m. For the SSM-T5 material where the first barrier is positioned at an average distance of 70 µm, the value of the stress amplitude is 82 MPa. These values are comparable to the material average fatigue strength measured at 106 cycles, which are 47 MPa and 78 MPa respectively.
Equivalent spherical diameter, D (µm) 0 100 200 300 400 500 600 700 800 C o u n t 0 5 10 15 20 25 30
Equivalent spherical diameter, D (µm) 0 100 200 300 400 500 600 700 800 C o u n t 0 5 10 15 20 25 30
The average position of the microstructural barrier, d, is very close to the average radius of the grains (D/2) that characterize each microstructure. On this basis, equation 1 can be rewritten in the following form to give a relationship between the material fatigue strength (at 107 cycles and R = 0.1) and its average grain size, D:
⋅ = Q D b c c a t a F Kmb a 2 , , , 2 1 σ π φ Equation 4
where ∆Kmb is the critical stress intensity factor range that characterizes the grain boundaries, here ∆Kmb = 2.4 MPa m. For a semi-elliptical crack with an aspect ratio
a/2c = 0.36 in a plate of infinite dimensions, the geometrical functions of Newman are
constants (Q = 1.8514 and F = 1.3455) and equation 4 can be rewritten:
D K
G mb
a
σ = Equation 5
with G = 0.403. With equation 5, the predicted fatigue strengths of the PM-T6 and SSM-T5 materials are 55 MPa and 90 MPa respectively. This is a 15 % overestimation of both measured values. However, equation 5 does not consider the influence of the defects. A defect at the initiation site of a crack has a comparable effect to bigger grain size because it can hinder the first microstructural barrier. Equation 5 proposed for R = 0.1 can be
extended to other R values with the correct ∆Kmb .
For the studied materials and testing conditions, it was not necessary to used an elastic-plastic fracture mechanics (EPFM) model to analyse the results. Fig.10b showed that the
average short crack growth rates in the PM and the SSM material can be well predicted by a Paris relationship. Consequently, to explain the relationship between the position of the microstructural barriers and the fatigue strength of the materials. For some other materials and testing conditions, it is necessary to use an EPFM parameter to compare the
propagation of short cracks at different stress amplitudes and in different materials [23]. In these cases, the strength of the microstructural barrier should be express according to the chosen EPFM parameter.
8. Conclusions
This experimental study was conducted to explain the fatigue strengths difference between a permanent mold (PM) and a rheocast (SSM) aluminum 357 alloy. S-N diagrams at R = -1 and R = 0.1 were produced and the propagation behaviour of long and short cracks was studied in details.
The S-N results and the fractographic observations brought the following conclusions:
• Eutectic modification of the SSM material did not improve its fatigue strength neither its resistance to long crack propagation.
• The average fatigue strengths at R = 0.1 and 107 cycles of the PM-T6 and SSM-T5 materials are 47 MPa and 78 MPa respectively while those at R = -1 are 82 MPa and 113 MPa.
• For both materials, the mean stress effect on the fatigue strength at 107 cycles is well predicted by a modified Goodman diagram.
• At both R values, the PM-T6 specimens contain big shrinkage cavities and have shorter fatigue life than the SSM-T5 specimens which contain fewer defects.
• The influence of defect cannot entirely explain the fatigue strength difference between the PM and SSM materials.
As expected, the long crack propagation behaviour cannot explain the difference in fatigue strength between the PM and SSM materials. Nevertheless, the following conclusions can be proposed concerning the long crack behaviour:
• The PM-T6 material is more resistant to long crack propagation than the SSM-T5.
• The threshold stress intensity factor range for the propagation of long crack is lower for the SSM material.
• The difference in the behaviour of long cracks is explained by roughness induced crack closure which is more important for the coarse PM-T6 microstructure.
A detailed analysis of the short crack propagation by the replication method led to the following conclusions:
• For both materials, a major portion of the specimen fatigue life is spent for the propagation of microstructurally short crack.
• For both materials, the propagation of short cracks is significantly shortened by the presence of defects at the crack initiation site.
• The most important microstructural barrier is characterized by a critical stress intensity factor range, ∆Kmb.
• The average grain radius of a microstructure is proposed as a value for the distance of the first important microstructural barrier.
• The fatigue strength at 107 cycles of both materials corresponds to the stress amplitude below which a short crack will stop at the first microstructural barrier. Based on these conclusions, the fatigue strength of the studied materials was predicted using a propagation threshold, ∆Kmb, for short cracks. It was shown that the PM-T6 material has an inferior fatigue strength than the SSM-T5 material because its most important microstructural barriers are positioned further from the crack initiation site. Practically, the fatigue strength of castings made from aluminum 357 alloy can be increased by reducing the grain size of the microstructure and the defect content.
Future experiments should be carried out in order to obtain the fatigue strength of more SSM and PM microstructures with different grain sizes. These results could be used to verify the proposed relationship between the material fatigue strength and its grain size.
9. References
[1] Brochu M, Verreman Y, Ajersch F, Bouchard D. High cycle fatigue strength of permanent mold and rheocast aluminum 357 alloy. Int J Fatigue 2010; doi: 10.1016/ j.ijfatigue.2010.01.001.
[2] Gan YX, Overfelt RA. Fatigue property of semisolid A357 aluminum alloy under different heat treatment conditions. J Mater Sci 2006; 41: 7537-44.
[3] Gabathuler JP, Huber HJ, Erling J. Specific properties of produced parts using the thixocasting process. Metall Ital 1994; 86: 609-15.
[4] Davidson CJ, Griffiths JR, Badiali M, Zanada A. Fatigue properties of a semi-solid cast Al-7Si-0.3Mg-T6 alloy. Metall Sci Technol 2000; 18: 27-31.
[5] North American Die Casting Association. NADCA Product specification standards for die castings produced by the semi-solid and squeeze casting processes. 4 ed. USA:
NADCA, 2006.
[6] Lados DA, Apelian D. Fatigue crack growth characteristics in cast Al-Si-Mg alloys Part I. Effect of processing conditions and microstructure. Mater Sci Eng A 2004; 385 : 200-11.
[7] Han SW, Kumai S, Sato A. Fatigue crack growth behavior in semi-liquid die-cast Al-7%Si-4%Mg alloys with fine effective grain structure. Mater Sci Eng A 2001; 308: 225-32. [8] Lados DA, Apelian D. In: Proceedings of the 8th International Conference on Semi-Solid Processing of Alloys and Composites. Limassol; 2004. p. 833-42.
[9] Doutre D, Langlais J, Roy S. In: Proceedings of the 8th International International Conference on Semi-Solid Processing of Alloys and Composites. Limassol; 2004. p. 397-408.
[10] Brochu M, Verreman Y, Ajersch F, Charest N. In: Proceedings of the 12th International Conference on Fracture. Ottawa; 2009. p. 1-10.
[11] Rose H. Propagation des fissures de fatigue dans l'alliage d'aluminum 357 coulé par gravité et rhéomoulé. Montréal: École Polytechnique de Montréal; 2009. p.108.
[12] Ludwig W, Buffiere JY, Savelli S, Cloetens P. Study of the interaction of a short fatigue crack with grain boundaries in a cast Al alloy using X-ray microtomography. Acta Mater 2003; 51: 585-98.
[13] Bolingbroke RK, King JE. A comparison of long and short fatigue crack growth in a high strength aluminium alloy. In: K.J. Miller, E.R.d.l. Rios editors. The behaviour of short fatigue cracks London, UK: Mechanical engineering publications; 1986, p.101.
[14] Newman Jr JC, Raju IS. Empirical stress-intensity factor equation for the surface crack. Eng Fract Mech 1981; 15: 185-92.
[15] Wang QG, Davidson CJ, Griffiths JR, Crepeau PN. Oxide films, pores and the fatigue lives of cast aluminum alloys. Metall Mater Trans B 2006; 37: 887-95.
[16] Rabbe P, Anquez L, Chapitre 3: L'amorçage des fissures de fatigue. In: C. Bathias, A. Pineau editors. La fatigue des matériaux et des structures 1, 3e édition, Éditions Hermès, Paris; 2008: 15-51.
[17] Plumtree A, Schäfer S. Initiation and short crack behaviour in aluminium alloy castings. In: K.J. Miller, E.R.d.l. Rios editors. The behaviour of short fatigue cracks London, UK: Mechanical engineering publications; 1986, p.215.
[18] Buffiere J-Y, Savelli S, Jouneau PH, Maire E, Fougères R. Experimental study of porosity and its relation to fatigue mechanisms of model Al-Si7-Mg0.3 cast Al alloys. Mat Sci and Eng A 2001; 316: 115-26.
[19] Han S-W, Kumai S, Sato A. Effects of solidification structure on short fatigue crack growth in Al-7%Si-0.4%Mg alloy castings. Mater Sci Eng A 2002; 332: 56-63.
[20] Hayat N, Toda H, Kobayashi T, Wade N. Experimental investigations of fatigue characteristics of AC4CH cast aluminum alloys fabricated through rheocast and squeeze cast methods. Mater Sci Forum 2002; 396-402: 1353-58.
[21] Verreman Y. Chapitre 7: Propagation des fissures courtes. In: C. Bathias, A. Pineau editors. La fatigue des matériaux et des structures 2, 3e édition, Éditions Hermès, Paris; 2008: 15-51.
[22] Hobson PD, Brown MW, de los Rios ER. Two phases of short crack growth in a medium carbon steel. In: K.J. Miller, E.R.de los Rios editors. The behaviour of short fatigue cracks London, UK: Mechanical engineering publications; 1986, p.441.
[23] Caton MJ, Jones JW, Allison JE. The influence of heat treatment and solidification time on the behavior of small-fatigue-cracks in a cast aluminum alloy. Mater Sc Eng A 2001; 314: 81-85.
10. Acknowledgements
Contributions from CRSNG, FQRNT, REGAL and Rio-Tinto Alcan for funding this research are acknowledged.