HAL Id: hal-02074823
https://hal.inria.fr/hal-02074823
Preprint submitted on 20 Mar 2019
HAL is a multi-disciplinary open access
archive for the deposit and dissemination of
sci-entific research documents, whether they are
pub-lished or not. The documents may come from
teaching and research institutions in France or
abroad, or from public or private research centers.
L’archive ouverte pluridisciplinaire HAL, est
destinée au dépôt et à la diffusion de documents
scientifiques de niveau recherche, publiés ou non,
émanant des établissements d’enseignement et de
recherche français ou étrangers, des laboratoires
publics ou privés.
Lightweight, General Inference of Streaming Video
Quality from Encrypted Traffic
Francesco Bronzino, Paul Schmitt, Sara Ayoubi, Nick Feamster, Renata
Teixeira, Sarah Wassermann, Srikanth Sundaresan
To cite this version:
Francesco Bronzino, Paul Schmitt, Sara Ayoubi, Nick Feamster, Renata Teixeira, et al.. Lightweight,
General Inference of Streaming Video Quality from Encrypted Traffic. 2019. �hal-02074823�
Lightweight, General Inference of Streaming Video Quality
from Encrypted Traffic
Francesco Bronzino
†, Paul Schmitt
◦, Sara Ayoubi
†, Nick Feamster
◦,
Renata Teixeira
†, Sarah Wassermann
†, and Srikanth Sundaresan
◦†
Inria, Paris ◦Princeton University
ABSTRACT
Accurately monitoring application performance is becoming more important for Internet Service Providers (ISPs), as users increasingly expect their networks to consistently deliver acceptable application quality. At the same time, the rise of end-to-end encryption makes it difficult for network operators to determine video stream quality— including metrics such as startup delay, resolution, rebuffering, and resolution changes—directly from the traffic stream. This paper develops general methods to infer streaming video quality metrics from encrypted traffic using lightweight features. Our evaluation shows that our models are not only as accurate as previous ap-proaches, but they also generalize across multiple popular video services, including Netflix, YouTube, Amazon Instant Video, and Twitch. The ability of our models to rely on lightweight features points to promising future possibilities for implementing such mod-els at a variety of network locations along the end-to-end network path, from the edge to the core.
1
INTRODUCTION
Video streaming traffic is by far the dominant application traffic on today’s Internet, with some projections stating that video streaming will comprise 82% of all Internet traffic in just three years [13]. Video content providers and Internet Service Providers (ISPs) both manage network routing and content delivery to ensure that users experience good video streaming performance; content providers use distributed content delivery [2] to serve video streams, adapting the video bitrate to changing conditions [19]. ISPs deploy proxies, transcode and compress video, and re-route traffic to deliver good video quality with the existing network resources.
Optimizing video delivery depends on the ability to determine the quality of the video stream that a user receives. In contrast to video content providers, who have direct access to video quality from client software, network operators such as ISPs must typically infer video quality from traffic as it passes through the network. End-to-end encryption, which is becoming increasingly common with video streaming over HTTPS and QUIC [28, 32], prevents an ISP from directly observing precise application metrics such as startup delay, rebuffering events, and video resolution from the video streaming protocol [5, 17]. Without access to such metrics, ISPs cannot determine the quality of video sessions or the under-lying causes of quality degradation; therefore, they cannot detect when the network may be inducing poor application performance or perform steps to improve the delivery of the application to users. Several methods to infer video quality from encrypted video traffic have been proposed over the last few years [14, 22, 26], yet these methods are not general, lightweight, or fine-grained. First, previous work has focused mostly on YouTube traffic, but
video streaming algorithms and content characteristics can vary significantly across video services (e.g., buffer-based [19] versus throughput-based [36] rate adaption algorithm or fixed-size [19] versus variable-size video segments [27]). Thus, a model that is tuned for YouTube is unlikely to work more generally across the growing set of video streaming applications. We find, in fact, that these previous methods do not work well for other video streaming services, and thus that more general models are needed.
Second, existing models cannot perform on-path processing; these existing approaches are typically computationally complex, and they often require either deep packet inspection or the compu-tation of stateful features that can be difficult to extract and track for a large number of flows. Third, existing work predicts the quality of experience at a coarse granularity, such as whether quality is “good” or “bad”, as opposed to more precise metrics such as resolution or startup delay. Finally, most previous approaches typically classify application granularity for an entire session and do not track these metrics over shorter time intervals within a single session.
In this paper, we develop lightweight, general models that infer four precise, fine-grained video quality characteristics: (1) startup delay, (2) resolution, (3) rebuffering, and (4) resolution changes— from encrypted traffic. Moreover, our new models work well across more video services than any existing method. We demonstrate this generality by showing that our models can predict application quality metrics for four popular video streaming services: Netflix, YouTube, Amazon Instant Video, and Twitch.
The models that we develop lend insight into the types of fea-tures in encrypted traffic that are best suited to predict application performance. We present the following contributions:
(1) We develop models that support inference with lightweight features. We evaluate the effects that various features have on model accuracy, including how features that require different amounts of state affect prediction accuracy. Our results show that models that rely on lightweight features (e.g., upstream and downstream throughput, inferred video segment sizes) can outperform the accuracy of those that require maintain-ing more complex per-flow state (e.g., bytes in flight, number of retransmissions). (Section 6)
(2) We demonstrate that our models generalize to a wide vari-ety of streaming video applications. In contrast to previous work, which has developed models that are specific to a particular video streaming service, we demonstrate that the models that we have developed can generalize across a wide range of services. (Section 7)
In addition to these two primary contributions, we also show that the predictive models that we develop for the video quality char-acteristics can produce fine-grained predictions of startup delay,
1
resolution, rebuffering, and resolution changes, in contrast to pre-vious work, whose predictions have generally been binary (i.e., good vs. bad) or otherwise more coarse-grained. Finally, we show that our models can predict video quality on shorter time intervals within a given session, providing more detailed information about how the quality of a video stream evolves over time.
Our results present several avenues for future work. Most im-portantly, the ability to predict the quality of streaming video ap-plications on lightweight features suggests that our models can be implemented at line rate in software or hardware switch de-ployments. We have currently deployed software in more than 50 homes to capture streaming statistics that we can use to estimate streaming video quality and are also exploring whether and how these models could be implemented in programmable hardware.
2
INTERNET VIDEO STREAMING
In this section, we provide background on Internet video streaming and define common video quality metrics.
2.1
DASH Protocol
Internet video streaming services typically use Dynamic Adaptive Streaming over HTTP (DASH) [35] to deliver a video stream. DASH divides each video into time slices known assegments or chunks (of possibly equal duration), which are then encoded at multiple bitrates and resolutions. These segments are typically stored on multiple web servers so that a client can download segments from a nearby server.
At the beginning of a video session, the client downloads a DASH Media Presentation Description (MPD) file from the server. The MPD file contains all of the information the client needs to retrieve the video (i.e., the audio and video segment file information). The client sequentially issues HTTP requests to retrieve segments at a particular bitrate. Anapplication-layer Adaptive Bitrate (ABR) al-gorithm determines the quality of the next segment that the client should request. ABR algorithms are proprietary, but most video ser-vices rely on recently experienced bandwidth [36], current buffer size [19], or a hybrid of the two [42] to guide the selection. The downloaded video segments are stored in a client-side application buffer. The video buffer is meant to ensure continuous playback dur-ing a video session. Once the size of the buffer exceeds a predefined threshold, the video starts playing. A video session can typically be classified into two distinct phases: (1) the buffering phase, where the client fetches video segments as quickly as possible to fill the buffer; and (2) the steady-state phase, where a client downloads new video segments at roughly the same rate as playback to maintain a stable buffer level.
2.2
Streaming Video Quality Metrics
A user’s experience while watching a video session depends on many factors that range from the user’s expectations and context to network and device performance [21]. Our goal is to study tech-niques that network operators can use to monitor video quality. As a result, we focus on four technical video quality metrics that
depend on network performance and have shown to affect user quality of experience [3, 6, 7, 15, 16, 20, 23].
Startup delay. Startup delay is the time elapsed from the moment the player initiates a connection to a video server to the time it starts rendering video frames. Prior work has shown that higher startup delays cause more users to abandon video sessions [23]. High startup delays also reduce the total time that users spend on a video service [15].
Video bitrate. The bitrate of video segments is one metric of the quality of the displayed content. The average bitrate over a video session (computed as the average of the bitrates played weighted by the duration each bitrate is played) is the key quality metric for video content [15]. The relationship between bitrate and qual-ity is complex because the bitrate depends on the resolution, the encoding, and the content type [1].
Bitrate switches. Video players switch the bitrate to adapt to changes in network conditions with the goal to select the best pos-sible bitrate for any given condition. Nevertheless, bitrate switch-ing has a negative effect on quality of experience [6, 18]. Both the frequency of bitrate switches (or switches per second) and the am-plitude of switches—the difference between the bitrate before and after the change—affect quality of experience [18].
Rebuffering events. This metric captures the periods of time video playback stalls because the buffer is empty. We can measure the impact of rebuffering with two metrics: the rebuffering time, which is the total time spent rebuffering in a session, or the rate of rebuffering, which is the frequency of rebuffering events. High rebuffering rate and time increase the rate of abandonment and reduce the likelihood that a user will return to the service [15, 23].
3
EXISTING QUALITY INFERENCE METHODS
Network operators must infer video quality from the traffic that traverses their network. Because this traffic is often encrypted [28, 32], several previous approaches have been developed to infer these quality features, since they cannot be observed directly:
• Dimopoulos et al. [14] developed a method that runs on a web proxy in the network to identify YouTube sessions over TCP, collects traffic statistics and HTTP requests to infer rebuffering, bitrate switches, and the average quality of the entire video session.
• Mazhar and Shafiq [26] infer video bitrate, startup delay, and rebuffering events for YouTube (over both TCP and QUIC) using network and transport layer statistics collected per ten-second time slots.
• BUFFEST [22] identifies individual video segments within video traffic to then infer YouTube rebuffering events using a buffer-state emulator.
• eMIMIC [25] relies on the same method to identify video segments and then models the video session as a sequence of segments to infer average bitrate, bitrate switches, rebuffer-ing ratio, and startup delay of a video session. eMIMIC’s model must be parameterized for each video service.
Netflix
YouTube
Amazon
0
20
40
60
80
Percentage
18.23 2.67 47.50 77.7172.03 74.25 84.97 67.99 89.07FP Rate
Precision
Recall
Figure 1: Using a per-service model to detect high (big-ger than 5) startup delay using method from Mazhar and Shafiq [26].
Existing models do not generalize. Unfortunately, we find that the models from previous work do not generalize well across mul-tiple services. Notably, most existing methods have only been eval-uated for a single service: YouTube. The lone exception is eMIMIC, which was evaluated for two undisclosed video services, but the eMIMIC model has its own set of drawbacks: it assumes fixed-length video segments, making it inapplicable to video services that use variable-length segments such as YouTube. Additionally, existing models are often quite coarse-grained. Both Dimopoulos et al. and eMIMIC output metrics on a per-session granularity, rather than at finer-grained intervals. One reason that general models are chal-lenging to develop is because each video service (and client) has unique buffering behavior, as the service may prioritize different features such as resolution or short startup delays; these unique be-haviors mean that models such as BUFFEST that rely on buffer-state estimation cannot generalize to many video services.
We evaluated the state-of-the-art method from Mazhar and Shafiq [26] which is the only existing method that infers multi-ple video quality metrics at fine-scale granularity (per ten-second time slots). We use over 11,000 videos from four popular video ser-vices: Netflix, YouTube, Amazon Prime Video, and Twitch. We used scripts provided by the authors to extract the same features from the collected video sessions. We use Scikit-learn’s [29] AdaBoost implementation with one hundred default weak learners. We used the method from Mazhar and Shafiq to train one specific model per service (as in previous work [14, 25, 26]) and evaluate how well we can detect low resolution and long startup delays.
Here, we show results for the startup delay—whether the video has not started within five seconds after the video page has been requested. Figure 1 shows the false positive rate (FPR), precision, and recall when testing the model for each video service.
The model is not effective at detecting high startup delay across a variety of video streaming services. Although we found that the detection rate for YouTube was similar to that reported in previous work [26], false positive rates are around 20% for Netflix and even higher for Amazon. We discovered that 99% of Twitch sessions do not start playing before five seconds, so predicting a startup delay that exceeds five seconds was not a meaningful exercise—it almost always happens. The results from these experiments show that
even when we train one model per service using the method from previous work the accuracy is poor.
4
PROBLEM FORMULATION
In this section, we define the problem we address in the rest of the paper: lightweight, general video quality inference from encrypted network traffic. We first explore the set of video quality metrics that a model should predict, as well as the granularity of those predictions. Next, we discuss the space of possible features that the model could use, discussing not only the features themselves but also identifyinglightweight features that are most amenable to on-path processing. Finally, we discuss our goal of developing a general model for streaming video quality.
4.1
Output: Streaming Video Quality
In this section, we focus on how to set the inference goals for each of the metrics presented in Section 2.2. For example, given a metric, say resolution, one can use a regression model to output a continu-ous value (e.g., the average resolution of a session) or a classifier (whether resolution was high or low, as in the previous section). For the classification version of the problem, the selection of the classes may depend on the service. For example, in the previous section, a five-second cutoff for startup delay was too short for Twitch. Startup delay. eMIMIC [25] proposed to infer startup delay as the delay to download the first segment. This metric, however, is misleading as most services download multiple segments prior to startup. For example, we observe in our dataset that Netflix down-loads on average 4 video and 1 audio segments before playback begins. Alternatively, Mazhar and Shafiq [26] rely on machine learn-ing to model startup delay. Although it is natural to model startup delay as a regression problem where the goal is to infer the exact delay, they have modeled it as a binary classification problem [26]. The reasoning for this approach comes from prior results, which showed that users tend to ignore startup delay up to a given thresh-old, after which they report poor experience [23]. This threshold varies depending on the nature of the service, (e.g., roughly 3 sec-onds for short videos on a service like YouTube and 5 secsec-onds for movies on a service such as Netflix). Therefore, a binary classifier based on a single threshold is unlikely to generalize across services. Instead, our method relies on a regression model to achieve finer inference granularity, which helps generalize across video services. Resolution (or bitrate). Bitrate and resolution often vary through the course of a video session; therefore, the typical inference target is the average bitrate or resolution. Previous work has predomi-nantly used classification approaches [14, 26]: either binary (good or bad) [26] or with three classes (high definition, standard definition, and low definition) [14]. Such a representation can be misleading as different clients may have different hardware configurations (e.g., a smartphone with a 480p screen compared with a 4K smart television). An alternative is to infer the average bitrate based on the amount of data downloaded during the streaming session [25]. This approach can also lead to confusing results as the relationship between bitrate and quality is complex, since the bitrate depends on not only the resolution, but also the encoding and the content type. Therefore, our models infer resolution, which is easier to analyze
and also to generalize across services. One can compute the average resolution of a video session [14, 25] or of a time slot [26]. We opt to infer video quality per time slot.1This finer-grained inference can later be used to also recover per-session statistics.
Resolution switches and rebuffering. We can model both res-olution switches and rebuffering events as a binary classification (e.g., whether or not the video rebuffered during some window) or a regression problem (e.g., rate of events). Prior work has focused on inferring the degree of rebuffering (no stalling, medium stalling, or severe stalling) [14, 25] or on detecting instances when the buffer is running low [22]. For resolution switches, prior work used a similar approach to infer resolution variation (i.e., no, mild, or high variation) [14]. We instead focus on detecting whether there was a rebuffering event in a given time slot as proposed by Mazhar and Shafiq [26]. This approach allows finer-grained inference of the rate and frequency of rebuffering. Similarly, we detect the presence of resolution switches in a given time slot.
4.2
Input: Lightweight Features
The selection of a video quality inference method requires under-standing which metrics provide the best tradeoffs between collec-tion overhead, processing complexity, and deteccollec-tion accuracy. Some metrics can easily be computed in the network path, whereas others (e.g., end-to-end latency), require maintaining per-flow state and observations of bidirectional flows—which is often heavyweight and may even be impossible at some vantage points. We discuss features at various levels of the network stack below.
Network Layer. We define network-layer features as metrics that solely rely on lightweight information available from observation of a network flow (identified by the IP/port four-tuple). This in-cludes metrics such as flow throughput, packet/byte counters, or packet arrivals. Being lightweight, one can easily collect these met-rics from any monitoring point in the end-to-end path that can observe network flows that belong to a video session. Moreover, most modern routers are capable of gathering this information as the state necessary to do so is relatively minimal.
Transport Layer. Transport-layer features include information such as end-to-end latency and packet retransmissions. These met-rics reveal possible network problems, such as presence of a lossy link in the path or a link causing high round-trip latencies between the client and the server. Unfortunately, transport metrics suffer two shortcomings. First, due to encryption, some metrics are only extractable from TCP flows and not flows that use QUIC (which is increasingly prevalent for video delivery). Second, many transport-layer features require maintaining long-running per-flow state, which is prohibitive at scale.
Application Layer. Application-layer metrics include any feature related to the application data, which often provide the greatest in-sight into the performance of a video session. Encryption, however, makes it impossible to directly extract any application-level infor-mation from traffic using deep packet inspection. Fortunately, we can still derive some application-level information from encrypted traffic. For example, BUFFEST [22] showed how to identify indi-vidual video segments from the video traffic, using the times of
1We use 10-second slots as justified in Section 5.4.
upstream requests (i.e., packets with non-zero payload) to break down the stream of downstream packets into video segments. Our experiments found that this method works well for both to TCP and QUIC video traffic. In the case of QUIC, signaling packets have non-zero payload size, so we use a threshold for QUIC UDP payload size to distinguish upstream and downstream packets. Tracking these features requires recording the times clients issue upstream requests (i.e., upstream packets with payload bigger than zero) to break down the stream of downstream packets into video segments. This process requires a limited amount of state as it needs one register per flow to keep track of the last upstream request and byte counters for subsequent downstream packets.
Section 6 presents the features we use for our models as well as how we represent them.
4.3
Goal: General Prediction Model
Network providers need to track the performance of an ever-evolving set of video services. An ideal video quality inference technique should perform accurate prediction across a variety of services, without requiring a specific model to be trained for each service.
Per-service models. As discussed in Section 3, most existing meth-ods [14, 22, 26] focused on YouTube. Our results in Section 3 show that simply retraining existing models across different video ser-vices can lead to poor prediction accuracy. Moreover, even if effec-tive, applying the same method across different video services to obtain per-service models requires operators to collect a sufficiently diverse set of video sessions for each service and to calibrate the model per service, which is intractable with the increasing number of video services. Complicating matters further, video services often update their client video player logic, which may require network operators to retrain models if they are too tailored to the specific dynamics of the service [22].
General model. A preferable approach is to develop a combined model that works across multiple services. This approach is more appealing, as it allows network operators to train their algorithms periodically for all services, which is desirable considering that the majority of video services have converged to DASH-based al-gorithms that share similar yet not identical streaming dynamics. This generality may result in lower precision, recall, or both, but may be sufficient as long as the generated models fit some target performance metrics.
Section 7 evaluates the accuracy of video quality detection for both per-service and general models.
5
METHOD
This section first describes our methods to generate labeled video traffic and the resulting dataset used to evaluate video quality in-ference methods. Then, we present the set of features we compute from the input metrics discussed in the previous section and how we train models to infer the four target metrics.
5.1
Generation of Video Traffic
Inferring video quality from encrypted network traffic requires network traffic of video sessions, where each session is labeled with
video quality metrics. To develop this dataset, we instrument a set of laptops to collect network traffic, and we generate video traffic automatically for four popular video services, Netflix, YouTube, Twitch, and Amazon Instant Video (Netflix and YouTube together represent over 50% of fixed Internet traffic in Latin America and North America [34]).
We generate video sessions automatically using ChromeDriver [12]. We play each session for 8 to 12 min-utes depending on the video length and whether there are ads at the beginning of the session (in contrast to previous work [26], we do not remove ads from the beginning of sessions in order to recreate the most realistic setting possible). For longer videos (e.g. Netflix movies), we vary the playback starting point to avoid always capturing the first portion of the video. We generate five categories of sessions: Netflix, Amazon, Twitch, YouTube TCP, and YouTube QUIC. Netflix and Amazon movies are randomly selected from the suggestions presented by the service in the catalog page. To avoid biasing our results we select movies from different categories including action, comedies, TV shows, and cartoons. We ultimately select 25 movies and TV shows used in rotation from Netflix and 15 from Amazon Prime Video. Similarly for YouTube, we select 30 videos from different categories. Twitch automatically starts a live video feed when opening the service home page. Thus, we simply collect data from the automatically selected feed.
5.2
Data Collection and Labeling
We collect packet traces using tcpdump [39] on the network inter-face the client uses to stream videos. To label these traffic traces with the appropriate video quality metrics, we develop a Chrome extension that monitors application-level information for the four services. This extension allows us to assign video quality metrics to each stream as seen by the client.2
The extension collects browsing history by parsing events avail-able from the Chrome WebRequest APIs [11]. This API exposes all necessary information to identify the start and end of video sessions, as well as the HTTPS requests and responses for video segments. To collect video quality metrics, we first use the Chrome browser API to inspect the URL of every page.
The extension identifies flows that correspond to each of these video services in the packet traces and collects the appropriate statistics for each flow. Because video sessions are typically en-crypted, we rely on the QNAME in client DNS queries to identify video flows. We inspect the hostname in DNS queries and match these lookups against well-known domains of video services using regular expressions. If the DNS domain name corresponds to one of the four video services that we study, we then track all video quality metrics defined in Section 2.2 as follows:
Netflix: Parsing overlay text. Netflix reports video quality sta-tistics as an overlay text on the video if the user provides a specific keystroke combination. We inject this keystroke combination but render the text invisible, which allows us to parse the reported statistics without impacting the playback experience. This informa-tion is updated once per second, so we adjust our collecinforma-tion period accordingly. Netflix reports a variety of statistics. We focus on the
2The extension supports any HTML5 based video. It will be made available after paper
acceptance.
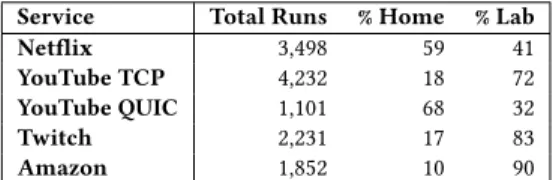
Service Total Runs % Home % Lab
Netflix 3,498 59 41
YouTube TCP 4,232 18 72
YouTube QUIC 1,101 68 32
Twitch 2,231 17 83
Amazon 1,852 10 90
Table 1: Summary of the dataset.
player and buffer state information; including whether the player is playing or not, buffer levels (i.e., length of video present in the buffer), and the buffering bitrate and resolution. The one-second refresh cycle limits the precision for detecting resolution switches. Fortunately, this precision is sufficient for our analysis as Netflix uses four-second video segments, hence resolution switches rarely happen more than once per second.
YouTube: iframe API. We use the YouTube iframe API [43] to periodically extract player status information, including current video resolution, available playback buffer (in seconds) and current playing position. Additionally, we collect events reported by the <video> HTML5 tag, which exposes the times that the player starts or stops the video playback due to both user interaction (e.g., pressing pause) or due to lack of available content in the buffer. The YouTube API reports the resolution of the video being played, but not the actual average bitrate. We then use the URLs of the downloaded video segments to extract the nominal bitrate of the video segment usingpytube [30], an external python library.
Twitch and Amazon Video: HTML 5 tag parsing. As the two services expose no proprietary interface, we generalize the module developed for YouTube to solely rely on the<video> HTML5 tag to collect all the required data. This approach allows us to collect all the events described above as well as player status information, including current video resolution, available playback buffer (in seconds), and current playing position. The only limitation is that the real bitrate is not available, so we focus on inferring resolution instead of bitrate.
5.3
Experiment Setup
We instrumented 11 machines to generate video traffic and collect packet traces together with the data from the Chrome extension: six laptops in residences connected to the home WiFi network (three homes in a European metropolitan area with download speeds of 100 Mbps, 18 Mbps, and 6 Mbps, respectively; one room in an European student residence; one apartment in a campus town in the US; and one home from a rural area in the US), four laptops located in our lab connected via the local WiFi network, and one desktop connected via Ethernet to our lab network.
In the lab environment, we manually varied the network condi-tions in the experiments using tc [9] to ensure that our datasets capture a wide range of network conditions. These conditions can either be stable for the entire video session or vary at random time intervals. We varied capacity from 50kbps to 30mbps, and introduce loss rates between 0% and 1% and additional latency between 0 ms and 30 ms. All experiments within homes ran with no other modi-fications of network conditions, to emulate realistic home network conditions.
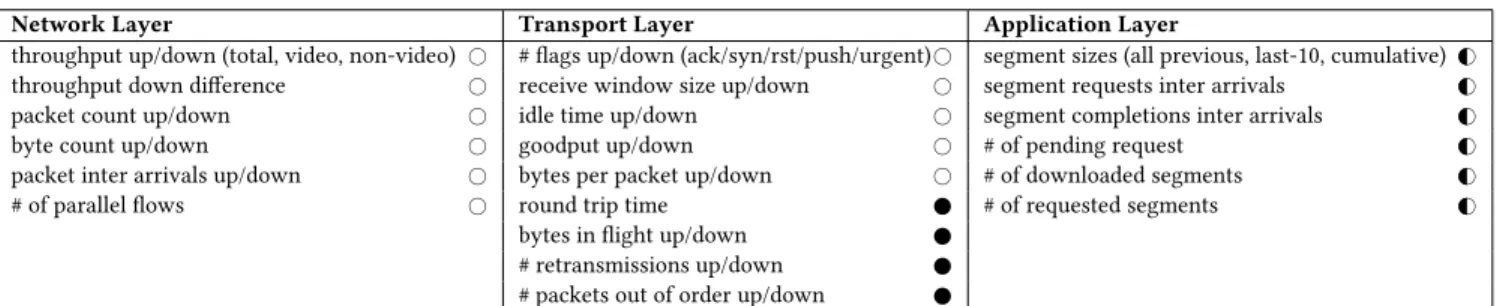
Network Layer Transport Layer Application Layer
throughput up/down (total, video, non-video) # # flags up/down (ack/syn/rst/push/urgent)# segment sizes (all previous, last-10, cumulative)G#
throughput down difference # receive window size up/down # segment requests inter arrivals G#
packet count up/down # idle time up/down # segment completions inter arrivals G#
byte count up/down # goodput up/down # # of pending request G#
packet inter arrivals up/down # bytes per packet up/down # # of downloaded segments G#
# of parallel flows # round trip time # of requested segments G#
bytes in flight up/down # retransmissions up/down # packets out of order up/down
Table 2: Summary of the extracted features from traffic. Amount of state required: Simple state (#), Simple application-layer state (G#), Complex state ( ).
We collected data from November 20, 2017 to June 18, 2018. We filtered any session that experienced playing errors during the execution. For example, we noticed that when encountering particularly challenging video conditions (e.g., 50 kbps download speeds), Netflix’s player simply stops and shows an error instead of stalling and waiting for the connectivity to return to playable conditions. The resulting dataset contains 11,767 video sessions. Table 1 shows the number of the runs per video service and under the different network conditions. We will release this dataset with the publication of this paper.
5.4
Feature Description
For each video session, we computed a set of features from the captured traffic and associated metrics, as summarized in Table 2. We also loosely characterize the cost of computing these features, which is roughly correlated with the amount of state required to collect and compute the associated feature.
Network Layer. Flows to video services fall into three categories: flows that carry video traffic, flows that belong to the service but transport other type of information (e.g., the structure of the web page), and all remaining traffic flows traversing to-and-from the end-host network. For each network flow corresponding to video traffic, we compute the upstream and downstream average throughput as well as average packet and byte counts per second. We also compute the difference of the average downstream throughput of video traffic between consecutive time slots. This metric captures temporal variations in video content retrieval rate. Finally, we compute the upstream and downstream average throughput for service flows not carrying video and for the total traffic. Modern hardware can compute each of these features in-line with a single register (e.g., to store counters for throughput or timestamps for packet time arrivals).
Transport Layer. We extract transport-layer features from infor-mation in TCP/UDP headers, computing each feature separately for upstream and downstream traffic, as in previous work [26]. We calculate the features by analyzing individual packets, and their relative state in the lifetime of the flow. For TCP, we extract re-transmissions, window sizes, out-of-order packets, and TCP flag information. The rest of the features are computed for UDP, as well. We compute summary statistics such as mean, median, maximum, minimum, standard deviation, kurtosis, and skewness. The cost of computing each feature depends on whether the full state of the
flow is required: Features such as goodput and TCP flag counters (in the upper part of the table) require simple state and can be com-puted in line similarly to the network-layer ones. The remaining features require more complex mechanisms to inspect each packet and track state across packets belonging to the flow, as shown in the bottom of the table.
Application Layer. We use sequences of inferred video segment downloads to build up the feature set for the application layer. In particular, we compute the following features: the sizes of the downloaded segments (both for the entire flow history and the last ten segments); this provides insight into the amount of data per second of video delivered. Features such as the interarrival times for segment requests, completed downloads, and the number of outstanding downloads and active flows provide information on how many requests the player is capable of issuing (and complete) at any specific point in time. For each one of these features we com-pute the following statistics: minimum, mean, maximum, standard deviation and 50th, 75th, 85th, and 90th percentile. These features require a small amount of state to track, consisting of per flow streaming registers to track upstream packets and byte counters to infer segment sizes.
We compute these features at fixed time intervals and label all time slots with the video quality (in particular, startup delay, reso-lution, number of rebufferings and resolution switches) extracted using the Chrome extension. We consider bins of 5 and 10 seconds or at the end of each downloaded video segments. To decide on the bin size, we study the number of switches and rebufferings per time bin using our ground truth. The overwhelming majority of time bins have no bitrate switches nor rebuffering events. For example, at 5 seconds, more than 93% of all bins for Netflix have no quality switch. As the bin size increases, we have more switches per bin and we lose on the precision of switch detection. At the same time, if the time bin is too short it may only capture the partial download of a video segment, in particular when the network conditions are poor. We select 10-second bins, which represent the best tradeoff between the precision of detecting events and ensuring downloads of full segments per bin.
5.5
Model Generation
To generate our models, we experimented with different methods: Adaboost (as in prior work [26]), logistic regression, decision trees, and random forest. We evaluate methods based on precision, recall
Mazhar and
Shafiq [26]
Net
Net+Tran Net+App
All
0
25
50
75
100
Percentage
10.5 14.8 14.2 10.5 11.1 89.088.1 90.895.6 92.495.7 93.396.3 94.096.5FP Rate
Precision
Recall
Figure 2: Startup delay inference error based different fea-tures sets (aggregated into two-second bins based on real startup delay).
and false positive rate. Our analysis, omitted for brevity, finds that random forest achieves the highest accuracy for all our inference goals; hence, the rest of this paper focuses on the results of random forest models.
Training and testing sets. We generate different training sets: network-layer features (Net), transport-layer features (Tran), application-layer features (App), as well as a combination of features from different layers: Net+Tran, Net+App and all layers combined (All). For each target quality metric, we train 30 models in total: (1) varying across these six features sets and (2) using five differ-ent datasets, splitting the dataset with sessions from each of the four video services—Netflix, YouTube, Amazon Prime Video, and Twitch—plus a combined dataset with sessions from all services. For models that rely on transport-layer features, we omit YouTube ses-sions over UDP as we cannot compute all features. For each target quality metric, we evaluate models using 10-fold cross-validation. We do not present the results for models based only on transport-layer or application-transport-layer features, because the additional cost of collecting lightweight network-layer features is minimal compared to the more stateful features in the other layers, and these models are less accurate, in any case.
6
MAKING INFERENCE LIGHTWEIGHT
In this section, we evaluate the accuracy of various models for predicting streaming video quality, particularly evaluating models that incorporate only lightweight features against models that use more comprehensive feature sets. We find that the models that rely on only lightweight features (e.g., lightweight network-layer and application-layer features) perform nearly as well as models that rely on the complete set of features.
6.1
Startup Delay
For predicting startup delay, we train the models on the first ten seconds of each video session. We train one random forest regressor for each service feature set and service combination. We present the average results across the four video services. To allow direct comparison with Mazhar and Shafiq [26], we convert the output of our (more fine-grained) regression models into a binary classifica-tion problem to predict whether the video failed to start within the
0.0
0.2
0.4
Total Throughput Down
CUMSUM Segment Size
All Previous STD Segment Size
Total Throughput Up
Segment Request / Download Ratio
Service NonVideo Throughput Up
Packet Count Down
Average Packet IAT Up
# Parallel Flows
Service NonVideo Throughput Down
Netflix
0.0
0.2
0.4
Feature Importance
CUMSUM Segment Size
# Previous Segment Requests
All Previous Max Segment IAT Down
# Previous Segments Down
STD Segment IAT Up
STD Packet IAT Up
Average Packet IAT Up
All Previous STD Segment IAT Up
Average Packet IAT Down
Last 10 STD Segment Size
YouTube
Layer
Network
Application
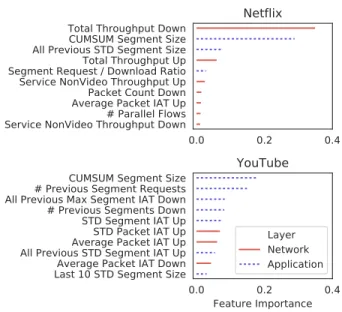
Figure 3: Startup delay feature importance for Netflix and YouTube models.
first five seconds. Figure 2 presents the precision, recall, and false positive rate of our models using different feature sets together with that of Mazhar and Shafiq’s model. The results show that the precision and recall of all of our models improve upon the state of the art. Interestingly, our results also show that the model us-ing a combination of features from network and application layer yields the highest precision and recall with tolerable false positive rate. These results also show that we can exclude Net+Tran mod-els, because transport-layer features are the costliest to track and Net+App models consistently achieve higher precision/recall and lower false positive rates in any case. Additionally, we find that solely using network-layer features achieves higher precision and recall compared to Mazhar and Shafiq [26], at the cost of higher false positive rate. Overall, the model that relies on network and application-layer features (Net+App) provides the best tradeoff be-tween accuracy and state required, but network operators may choose a model that uses only network-layer features, which result in the lowest monitoring overhead with a small sacrifice in the inference quality.
To further understand the effect of different types of features on the models, we study feature importance (based on the Gini index [8]) across the different services. Figure 3 ranks the ten most important features for both Netflix and YouTube for the Net+App model. Overall, application-layer features dominate YouTube’s chart with predominantly features that indicate how fast the client down-loads segments, such as the cumulative segment size and their inter-arrival times. We observe the same trend for Amazon and Twitch. In contrast, the total amount of downstream traffic (a network-layer feature) dominates Netflix’s list. Although this result seems to suggest a possible difference across services, this feature is also indicative of the number of segments that are being downloaded, meaning that ultimately this feature is indeed a key factor on how
(0,2] (2,4] (4,6] (6,8] (8,10] (10,inf) Startup time bin (based on real startup time) 30 20 10 0 10 20 30
Error in s (Real - Predicted)
Figure 4: Relative error in startup delay inference (by levels) using Net+App features cut at [-30, 30] on the y axis (For all four video services).
fast the client can begin video playback. In fact, all of these features are aligned with general DASH video streaming behavior where the video startup delay is associated with a buffer-level threshold, because once the client-side buffer reaches the threshold, playback begins. Hence, the faster the client reaches this threshold (by down-loading segments quickly), the lower the startup delay will be.
In contrast to models in previous work which make discrete pre-dictions about startup delay (i.e., good vs. bad), our model predicts startup delay as a continuous value. Thus, we can also study the magnitude of errors in our model prediction. Figure 4 shows the distribution of the relative errors for inferred startup delays split into two-second bins. Our models perform particularly well for startup delays of less than ten seconds with errors mostly within 1 second. Above this threshold we see that the precision degrades. This behavior is due to two reasons: (1) 91.2% of all sessions in our data have startup delays of less than ten seconds, meaning that the number of samples in the greater than ten-second range is small; and (2) as startup delays increase beyond ten seconds, it becomes more difficult for the model to be as precise. In particular, we see in our dataset instances with values ranging from ten seconds to multiple minutes. While this eventuality should be taken into ac-count in the design of any such model, also note that previous work has shown that startup delays above ten seconds can cause a rate of abandonment above 50% [23]. Hence, detecting that the startup delay has passed such threshold should be sufficient for an operator to identify a video session as poor quality.
6.2
Resolution
Next, we explore resolution inference. We divide each video ses-sion into ten-second time intervals and conduct the inference on each time bin. We train one random forest multi-class classifier for each service feature set and service combination. Each class of the classifier corresponds to one of the following resolution values: 240p, 360p, 480p, 720p, and 1080p. Similarly to the previous section, we present aggregated results for the different layers averaging across the studied services. We report the receiver operating char-acteristic (Figure 5a) and precision-recall (Figure 5b) curves for the models weighted average across the different labels to illustrate the performance of the classifier for different values of the detec-tion threshold. The models trained with applicadetec-tion layer features consistently achieve the best performance with both precision and
0.0
0.2
0.4
0.6
0.8
1.0
False Positive Rate
0.00
0.25
0.50
0.75
1.00
True Positive Rate
Net Mean ROC (AUC = 0.96 ± 0.02) Net+Tran Mean ROC (AUC = 0.97 ± 0.02) Net+App Mean ROC (AUC = 0.99 ± 0.01) All Mean ROC (AUC = 0.99 ± 0.01)
(a) ROC.
0.0
0.2
0.4
0.6
0.8
1.0
Recall
0.00
0.25
0.50
0.75
1.00
Precision
Net P/R curve (AP = 0.87)Net+Tran P/R curve (AP = 0.89) Net+App P/R curve (AP = 0.95) All P/R curve (AP = 0.95)(b) Precision-recall.
Figure 5: Resolution inference using different feature sets (For all four video services).
0.0
0.1
0.2
All Previous Average Segment Size
All Previous Max Segment Size
All Previous STD Segment Size
Last 10 Min Segment Size
CUMSUM Segment Size
Last 10 STD Segment Size
Last 10 Max Segment Size
Last 10 EWMA Segment Size
Last 10 Average Segment Size
# Previous Segment Requests
Netflix
0.0
0.1
0.2
Feature Importance
All Previous Max Segment Size
All Previous Average Segment Size
CUMSUM Segment Size
All Previous Min Segment Size
All Previous Max Segment IAT Down
Last 10 Average Segment Size
Last 10 EWMA Segment Size
Median Packet IAT Down
All Previous STD Segment Size
Last 10 Max Segment Size
YouTube
Layer
Network
Application
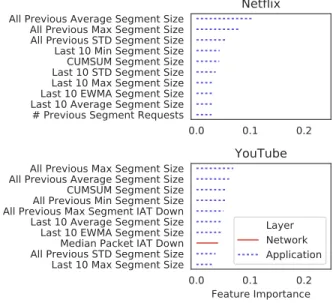
Figure 6: Feature importance for Netflix and YouTube service-specific models, for inferring video resolution.
recall reaching 91% for a 4% false positive rate. Any model not in-cluding application features reduces precision by at least 8%, while also doubling the false-positive rate.
4 2 0 2 4 Resolution Level Error (Real - Detected) 0.00 0.25 0.50 0.75 1.00 PDF of Errors NF (14.21 % of total)
YT (4.49 % of total) TW (5.63 % of total)AM (10.17 % of total)
Figure 7: Kernel Density Estimation function for the relative error in resolution inference (normalized to levels).
We next investigate the relative importance of features in Net+App model. Figure 6 reports the results for YouTube and Net-flix, which shows that most features are related to segment-size statistics. The same applies to the other services. This result con-firms the general intuition, since higher resolution means higher pixels-per-inch, thereby requiring more data to be delivered per video segment. Models trained with network and transport layer features infer resolution by relying on attributes related to byte count, packet count, bytes-per-packet, bytes-in-flight, and through-put. Without segment-related features, these models achieve com-paratively lower precision and recall.
We also quantify the error rate for resolution inference. Fig-ure 7 shows the kernel density estimation obtained plotting relative errors for the time slots for which the model infers an incorrect reso-lution. Recall that we model resolution using a multi-class classifier, resulting in discrete resolution “steps.” Hence, the error corresponds to distance in terms of the number of steps away from the correct resolution. As with the startup delay, errors tend to be centered around the real value, with the vast majority of errors falling within one or two resolution steps away the ground truth. For example, Netflix is the service with the higher number of mistakingly in-ferred time slots at 14%, but 83.9% of these errors are only one step away. Even given these error rates, this model still offers a better approximation of actual video resolution than previous models that only reflect coarse quality (i.e., good vs. bad).
6.3
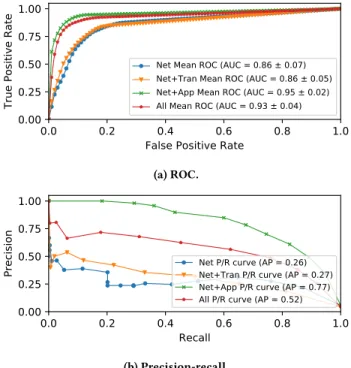
Rebuffering
When inferring rebuffering events, our model aims to infer, in ev-ery time bin, whether at least one rebuffering event took place. As we conduct our experiments, we observe that only YouTube video sessions experienced rebuffering in our dataset. Amazon, Twitch, and Netflix appear to avoid rebuffering by employing a much larger client-side application buffer. Hence, the results reported in Fig-ures 8a and 8b are for YouTube sessions only. We observe that the model trained with Net+App features achieves the best perfor-mance. False positive rate and precision are comparable or better to the other metrics (0.7% and 84.9% respectively), yet recall is only 60%. This result is still better than BUFFEST [22], which achieved 31% precision and 10% recall. This improvement results from the
0.0
0.2
0.4
0.6
0.8
1.0
False Positive Rate
0.00
0.25
0.50
0.75
1.00
True Positive Rate
Net Mean ROC (AUC = 0.86 ± 0.07) Net+Tran Mean ROC (AUC = 0.86 ± 0.05) Net+App Mean ROC (AUC = 0.95 ± 0.02) All Mean ROC (AUC = 0.93 ± 0.04)
(a) ROC.
0.0
0.2
0.4
0.6
0.8
1.0
Recall
0.00
0.25
0.50
0.75
1.00
Precision
Net P/R curve (AP = 0.26)Net+Tran P/R curve (AP = 0.27) Net+App P/R curve (AP = 0.77) All P/R curve (AP = 0.52)(b) Precision-recall.
Figure 8: Inferring rebuffering.
0.00 0.05 0.10 0.15
Feature Importance
All Previous Min Segment IAT Down Last 10 EWMA Segment Size Last 10 STD Segment Size All Previous Average Segment Size All Previous Min Segment IAT Up Last 10 Average Segment Size # Previous Segments Down Last 10 Max Segment Size All Previous STD Segment Size All Previous Average Segment IATYouTube
Layer
Network ApplicationFigure 9: Rebuffering presence feature importance for YouTube service-specific model.
use of segment-level information, as opposed to packet-level infor-mation used in BUFFEST [22]. Mazhar and Shafiq [26] report higher recall than our model, but we believe that this discrepancy is due to an artifact of their dataset, which includes an abnormally high frequency of rebuffering events: one out of four slots in their dataset experiences rebuffering, which is a much higher prior probability for rebuffering than would occur in real-world settings. We do not have access to their dataset. In reviewing their experiment setup, we observed that the network conditions in these experiments used both higher throughputs and higher packet loss rates (uniformly distributed between 0 and 100%). Such settings would lead YouTube to more easily move to HD quality while subsequently experiencing an abnormally high frequency of rebuffering events.
Figure 9 shows that the most important features are those asso-ciated with segment size, interarrival times, and total number of
0.0
0.2
0.4
0.6
0.8
1.0
False Positive Rate
0.00
0.25
0.50
0.75
1.00
True Positive Rate
Net Mean ROC (AUC = 0.81 ± 0.10) Net+Tran Mean ROC (AUC = 0.82 ± 0.12) Net+App Mean ROC (AUC = 0.90 ± 0.05) All Mean ROC (AUC = 0.89 ± 0.06)
(a) ROC.
0.0
0.2
0.4
0.6
0.8
1.0
Recall
0.00
0.25
0.50
0.75
1.00
Precision
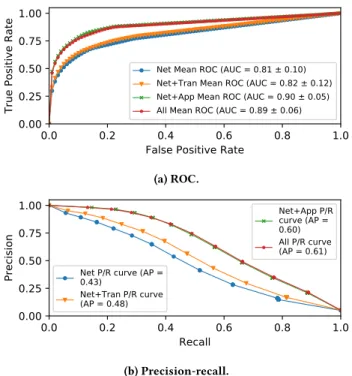
Net P/R curve (AP =0.43) Net+Tran P/R curve (AP = 0.48) Net+App P/R curve (AP = 0.60) All P/R curve (AP = 0.61) (b) Precision-recall.Figure 10: Inferring resolution switches (For all four video services).
downloads. Intuitively, these features capture the draining of the buffer. As the interarrival time increases and the number and size of downloaded segments decreases, the client-side buffer is drained at a rate that is faster than the buffer filling rate.
Finally, we seek to address whether the low recall achieved by the produced model could excessively impact its usage in real-world scenarios. In particular, we aim to understand if false negatives could prevent the user of the model from detecting presence of rebuffering in video sessions. We then evaluate how far false nega-tives are from a real rebuffering event;i.e. for every time slot where the model does not detect an existing rebuffering event, we examine the nearby time slots until we find a predicted rebuffering event. We measure the time that elapses between these two slots. Our results (not shown for lack of space) show that 26% of false-negatives occur a single time slot away from a real rebuffering event (i.e. at most 10 seconds away). Further, 41.6% of them are at most 30 seconds away. Allowing these relative errors would produce recall values of 78.9% and 91.9%, respectively.
6.4
Resolution Switches
Finally, we explore models to infer resolution switches. We divide video sessions into ten-second time intervals, and train random forest models to infer if at least one resolution switch occurred in each time bin. A resolution switch can either refer to a switch from a lower to a higher video resolution or vice-versa. Figures 10a and 10b show the results. As in previous sections, the Net+App model and the model that uses all features (All) are the most accurate. We see
0.0
0.1
0.2
# Previous Segments Down
All Previous Average Segment IAT Down
Total Throughput Up
All Previous Average Segment IAT
Byte Count Up
# Previous Segment Requests
Total Throughput Down
All Previous STD Segment IAT Up
Service NonVideo Throughput Up
CUMSUM Segment Size
Netflix
0.0
0.1
0.2
Feature Importance
Total Throughput Down
Total Throughput Up
CUMSUM Segment Size
# Previous Segments Down
All Previous Average Segment IAT Down
All Previous Average Segment Size
# Previous Segment Requests
All Previous Average Segment IAT
Last 10 Average Segment Size
All Previous STD Segment IAT Up
YouTube
Layer
Network
Application
Figure 11: Feature importance for predicting resolution switches in the service-specific Netflix and YouTube models.
that the average precision to detect resolution switches, however, is only 61%, even when using all features.
Figure 11 studies the ten most important features in the Net+App model for Netflix and YouTube. In contrast to the previous metrics, these models lack the presence of more dominant features that naturally reflect behavior associated with resolution switches. We believe that this lack of dominant features for resolution switch inference reflects the intricacy of ABR algorithms that rely on a mix of throughput estimate, buffer occupancy, and various parameters which may even be re-tuned as network condition changes[4].
Overall, we see that our inference methods for resolution switches performs relatively poorly compared with the other qual-ity metrics. Given that we find features are generally similarly important, and that resolution switches can be caused by condi-tions that are more nuanced compared with the other metrics, we argue that resolution switches may call for a different approach to reliably infer. We leave this for future exploration. Although, we plan to continue the investigation to achieve higher accuracy, we believe that by relying on the four target quality metrics together, we can improve the overall precision and recall to identify instances of poor video quality.
7
MAKING INFERENCE GENERAL
We now develop and evaluate a general model that infers video quality metrics across four popular video services: YouTube, Net-flix, Amazon Instant Video, and Twitch. We present results for startup delay, resolution, and resolution switches. Because the only video service that experienced rebuffering events in our dataset is YouTube, we do not consider rebuffering in this section. For each service, we compare the accuracy of the Net+App model trained with data using only that service against its accuracy when trained with data from all services. We find that combined models perform
(0,2] (2,4] (4,6] (6,8] (8,10](10,inf) Class 30 20 10 0 10 20 30
Error in s (Real - Pred)
service = Same-NF
(0,2] (2,4] (4,6] (6,8] (8,10](10,inf) Class
Error in s (Real - Pred)
service = Combined-NF
Figure 12: Startup delay inference error difference for Net-flix, general versus Netflix model (aggregated into two-second time intervals, based on real startup delay).
nearly as well as models that rely only on sessions from a sin-gle service across all quality metrics. This result suggests that our lightweight models generalize to a wide variety of video streaming services.
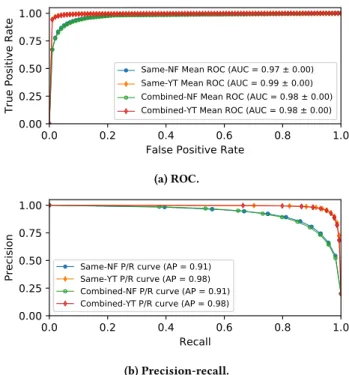
Startup Delay We first evaluate a general model for inferring startup delay. Figure 12 reports startup delay inference errors for Netflix split into two-second intervals for the model trained using solely Netflix sessions (Same-NF) and the one obtained by using our entire dataset (Combined-NF). The general model performs almost as well as the one obtained from tailored training of a regressor that is specific to Netflix. In particular, for startup delays between two and ten seconds, both models achieve errors mostly within one second. The biggest discrepancies occur in the remaining two classes, which have the lowest number of startup delay instances for Netflix, whereas other services experience more startup delays in those groups. In particular, YouTube has twice as many instances of less than two seconds startup delays (27% of them compared to 14% for all the other services). The most important features for the produced model include the cumulative segment sizes and their size distribution, two metrics that reflect the interarrival times for segment completions, and the average throughput achieved. These results are consistent with our service-specific analysis in Section 6.1. In summary, these results suggest it is possible to predict startup delay with a general model across multiple services. Resolution. Figures 13a and 13b show results for Netflix and YouTube comparing general and service-specific models for infer-ring resolution. The general model performs nearly as well as the per-service models across all of the video services. The four most important features are all related to segment size. The weighted av-erage and standard deviation of the sizes of the last ten downloaded segments along with the maximum and average segment sizes over all past observed segments are most important. Recall from Sec-tion 6.2 that the top features for each service-specific model reflect the same pattern. In summary, the results reflect a general obser-vation that segment sizes tend to vary across different resolutions, providing a solid basis for a general prediction model based on features related to segments.
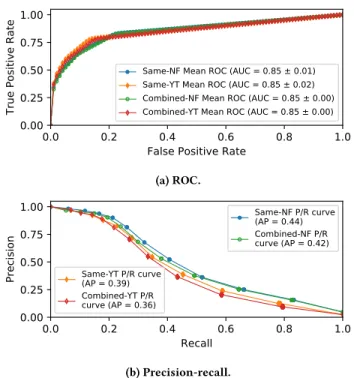
Resolution Switches. Figures 14a and 14b show that a general model achieves similar accuracy as per-service models for resolu-tion switches. The precision decreases by less than 1%, while the
0.0
0.2
0.4
0.6
0.8
1.0
False Positive Rate
0.00
0.25
0.50
0.75
1.00
True Positive Rate
Same-NF Mean ROC (AUC = 0.97 ± 0.00) Same-YT Mean ROC (AUC = 0.99 ± 0.00) Combined-NF Mean ROC (AUC = 0.98 ± 0.00) Combined-YT Mean ROC (AUC = 0.98 ± 0.00)
(a) ROC.
0.0
0.2
0.4
0.6
0.8
1.0
Recall
0.00
0.25
0.50
0.75
1.00
Precision
Same-NF P/R curve (AP = 0.91)Same-YT P/R curve (AP = 0.98) Combined-NF P/R curve (AP = 0.91) Combined-YT P/R curve (AP = 0.98)(b) Precision-recall.
Figure 13: Inferring resolution, general model.
recall decreases by no more than 2.5%, with an associated increase in the false positive rate of less than 1%. Amazon and Twitch show similar results, although the general models are slightly less accu-rate in these cases, likely due to the general challenges in inferring resolution switches for YouTube and Netflix, as described earlier Section 6.4. Nevertheless, even for resolution switches, which are difficult to infer, a general model is not significantly less accurate than the service-specific models.
8
RELATED WORK
Previous work has thoroughly explored video quality, as well as how different video quality metrics relate to user quality of expe-rience [21]. The methods to monitor these metrics, however, vary according to the vantage point. Streaming providers can directly instrument the player to report video quality [3, 7, 15, 23], but one cannot directly measure quality from within the network. There-fore, ISPs must infer video quality based on the observation of the packets traversing the network. A variety of approaches have been developed for modeling one or more video quality metrics or qual-ity of experience from network characteristics [10, 31, 37, 38, 41]. These models pre-date the wide-adoption of DASH. Hence, in practice, ISPs mostly rely on deep-packet inspection to identify video sessions within network traffic and then extract video qual-ity [24, 33, 40], which is becoming infeasible due to encryption of video sessions [5, 17]. This is the main challenge we address in this paper.
A number of prior studies also address the problem of inferring video quality from encrypted video traffic as we do in this paper. We already discussed the most relevant methods in Section 3. Di-mopoulos et al. [14] developed a method that runs on a web proxy
0.0
0.2
0.4
0.6
0.8
1.0
False Positive Rate
0.00
0.25
0.50
0.75
1.00
True Positive Rate
Same-NF Mean ROC (AUC = 0.85 ± 0.01) Same-YT Mean ROC (AUC = 0.85 ± 0.02) Combined-NF Mean ROC (AUC = 0.85 ± 0.00) Combined-YT Mean ROC (AUC = 0.85 ± 0.00)
(a) ROC.
0.0
0.2
0.4
0.6
0.8
1.0
Recall
0.00
0.25
0.50
0.75
1.00
Precision
Same-YT P/R curve(AP = 0.39) Combined-YT P/R curve (AP = 0.36) Same-NF P/R curve (AP = 0.44) Combined-NF P/R curve (AP = 0.42) (b) Precision-recall.Figure 14: Inferring resolution switches, general model.
in the network to infer quality of YouTube sessions. Their study only focuses on YouTube over TCP, so it is unclear whether the methods generalize to other video services or even to YouTube over QUIC (which is soaring at astonishing pace [28]). Second, they infer video quality metrics of full sessions, which is too coarse for some use cases such as online monitoring and optimization. Finally, the use of a web proxy raises privacy concerns. eMIMIC [25] improves on the accuracy of Dimopoulos et al. [14]. It relies on video segment detection to build parametric models of video session properties that translate into quality metrics. eMIMIC was evaluated for two undisclosed video services, where the model parameters had to be fine-tuned per service. Our work provides finer-grained inference targets and work per time slot.
Our approach of inferring video quality per time slots is most similar to the works by Mazhar and Shafiq [26] and BUFFEST [22]. BUFFEST [22] focuses only on rebuffering detection for YouTube. It introduces the method to identify video segments from en-crypted traffic that we leverage to compute application-layer fea-tures. BUFFEST implements a buffer level estimation emulator. It combines the estimated buffer levels with network layer metrics to feed a machine learning model and predict the presence of re-buffering at periodic time slots. Our rere-buffering models achieve higher accuracy than BUFFEST’s. Mazhar and Shafiq [26] use deci-sion trees to detect rebuffering events in real-time, whether video quality is high or low, and whether the video session has started or
not. They only evaluate their model for YouTube (although both for HTTPS and QUIC), and our evaluation in Section 3 shows that it does not generalize to the other video services we tested. Their models take as input network- and transport-level features, which add a level of indirection to video quality. Our work demonstrates that the use of input features computed over video segments can outperform transport features reducing the collection cost for the operator. Moreover, our reliance on video segments helps general-ize the method for different transport protocols and video services because we are removing transport overhead and any differences in the mapping of segments into packets. Video segments are the atomic unit of DASH video streaming and hence we can model video quality at finer granularity. In contrast to any of the existing work, our work evaluates a wide range of input features and shows that we can obtain accurate, general models to compute target quality metrics online with lightweight features.
9
CONCLUSION
In this paper, we developed and evaluated lightweight, general models to infer streaming video quality from encrypted traffic. We first demonstrated that existing models for inferring video qual-ity from encrypted traffic that are trained and evaluated only for YouTube are inaccurate when applied to a broader class of video services and not practical for on-path operation in real-world net-work deployments. Using these findings as motivation, we then developed models that: (1) rely on only lightweight features of the network traffic, towards facilitating on-path, real-time inference of video quality; (2) can accurately infer video quality metrics across four popular Internet streaming video services: Netflix, YouTube, Amazon Instant Video, and Twitch. We develop and evaluate our models using more than 11,000 video sessions gathered from both laboratory settings and real-world home network deployments. Ul-timately, we develop and present a model that accurately infers video quality metrics across all four of these video services, while relying on only lightweight features. In addition to simply reporting model accuracy, we also explore the relative feature importance in each of our models, lending intuition forwhy certain models perform—and generalize—better than others.
Our results suggest many immediate avenues for future work. First, the ability for a general model to accurately predict many video quality metrics based only on lightweight features in en-crypted traffic suggests that it may indeed be possible to implement and deploy such a model at various vantage points in the network, from the home network to the backbone. A clear avenue for future work involves operationalizing models that can operate at line rate, leveraging programmable network devices as needed to measure, extract, and compute model features. Second, it is clear that more work is needed to develop a general model to detect resolution switches in video. Finally, our models all initially identify video traffic from the DNS QNAME; currently, DNS queries are transmit-ted in cleartext, but with possible migration to DNS-over-TLS and DNS-over-HTTPS, another possible future avenue could involve coupling our work with future work to identify video traffic flows without the benefit of cleartext DNS queries.
![Figure 1: Using a per-service model to detect high (big- (big-ger than 5) startup delay using method from Mazhar and Shafiq [26].](https://thumb-eu.123doks.com/thumbv2/123doknet/11292113.280853/4.918.86.435.137.303/figure-using-service-detect-startup-method-mazhar-shafiq.webp)