Study of the effect of microstructural constituents on
fatigue crack propagation of High-performance PM
steels
Thèse
Saba Mousavinasab
Doctorat en génie des matériaux et de la métallurgie
Philosophiae doctor (Ph. D.)
Québec, Canada
© Saba Mousavinasab, 2017
Study of the effect of microstructural constituents on
fatigue crack propagation of High-performance PM
steels
Thèse
Saba Mousavinasab
Sous la direction de:
Carl Blais, directeur de recherche
iii
Résumé
Cette recherche est principalement planifiée pour améliorer les propriétés en fatigue des aciers MP afin qu'ils remplacent largement leurs contreparties corroyées, principalement en raison de leurs avantages en lien avec leur coût de production. L’atteinte de cet objectif est fait en déterminant la microstructure la plus efficace des aciers MP au cours de chargements cycliques. La microstructure la plus efficace est celle qui permet de réduire ou d'arrêter la propagation de fissures de fatigue par la combinaison appropriée de ses phases constitutives. Il existe quelques travaux sur ce sujet, cependant, ils n'ont pas atteint de conclusions cohérentes en raison du manque de données suffisantes et / ou une comparaison inappropriée. Par conséquent, l'effet de différentes phases constitutives d'une microstructure hétérogène d'un acier MP est encore ambigu et inconnu. Afin d'élucider cette question, il convient d'étudier différentes phases microstructurales et le comportement de propagation des fissures de fatigue dans celles-ci.
Notre étude commence par choisir deux aciers MP communs fabriqués à l'aide de deux techniques d'alliage soient : pré-mélangeage et pré-alliage, afin de produire respectivement des microstructures hétérogènes et homogènes. Deux types de traitements thermiques ont également été utilisés pour fournir différentes phases microstructurales qui sont nécessaires aux fins de cette étude. Les échantillons ont ensuite été testés en utilisant la charge cyclique et quatre ratios de contraintes pour étudier l'effet des conditions de fatigue. Une analyse quantitative des surfaces de rupture, qui comprend l'étude détaillée du cheminement des fissures en OM et en SEM a ensuite été effectuée sur les échantillons fracturés. Les données de vitesse de propagation de fissures de fatigue dans différents aciers MP ayant des microstructures différentes avec les données quantitatives acquises quant à leur parcours préférentiel nous ont amené à des résultats intéressants sur l'effet des constituants de microstructure sur le comportement de propagation de fissure de fatigue.
Il s'est avéré que la fissure de fatigue se propage plus rapidement à travers la phase la moins résistante parmi celles présentes dans la microstructure. Ainsi, la perlite n'était pas favorable à la propagation des fissures en compagnie de ferrite riche en Ni, alors qu’en présence de martensite, on a trouvé que les grains perlitiques étaient le chemin de fissure
iv
préféré. De plus, l'austénite résiduelle, qui a été identifiée dans la littérature comme étant une phase bénéfique pour le retard de fissure de fatigue, s'est révélée inefficace. Bien que les fissures de fatigue contournent ces régions, la déformation causée par ce changement de chemin de fissure n'a pas montré d'effet positif sur le retard de fissure de fatigue.
v
Abstract
This research is mostly planned to enhance the fatigue properties of PM steels inasmuch as they are extensively replacing their equivalent wrought steels due mostly to production cost benefits. This goal is going to be achieved through determining the most effective microstructure of PM steels in cyclic loadings. The most effective microstructure is the one that can reduce or stop the fatigue crack propagation through the proper combination of its constituent phases. There exists some researches on this topic, however, they did not reach consistent conclusions due to the lack of sufficient data and/or improper comparison. Therefore, the effect of different constituent phases of a heterogeneous microstructure of a PM steel is still ambiguous and unknown. In order to study this issue, diverse microstructures and the fatigue crack propagation behaviour through them should be studied.
Our research begins by choosing two common PM steels manufactured using two alloying techniques of admixed and pre-alloyed to produce heterogeneous and homogeneous microstructures respectively. Two types of heat-treatments namely sinter-hardening and oil-quenching were also utilized to provide more microstructural phases that is needed for the purpose of this study. The samples were then tested in cycling loading using different R-ratio in order to study the effect of fatigue conditions as well. Quantitative analysis of the fracture surfaces, which includes the detailed study of the crack path in OM and SEM, were then performed on the fractured samples. The fatigue crack growth rate data in different PM steels having different microstructures along with the quantitative data acquired from their crack path led us to interesting results on the effect of microstructural constituents on fatigue crack propagation behaviour.
It was found that the fatigue crack will propagate more rapidly through the weakest i.e. lowest strength phase among the ones present in the microstructure. Thus, pearlite was not favourable for crack propagation in the company of Ni-rich ferrite while in the presence of martensite, pearlitic grains were found to be the preferred crack path. Moreover, the retained austenite, which was identified in literature to be a beneficial phase for fatigue crack retardation, was found to be ineffective on the matter. Although fatigue cracks
vi
circumvented these regions, the deflection caused by this change of crack path did not show any positive effect on fatigue crack retardation.
vii
Table of content
Résumé ... iii
Abstract ... v
Table of content ... vii
List of Tables ... x
List of Figures ... xi
Acknowledgement ... xvi
Preface ... xvii
CHAPTER 1. INTRODUCTION ... 1
CHAPTER 2. A REVIEW: FATIGUE IN METALS ... 3
2.1 History and definition ... 3
2.2 Fatigue mechanism; fatigue crack initiation and propagation ... 3
2.2.1 Crack initiation ... 4
2.2.2 Crack propagation ... 5
2.3 Fatigue strength ... 6
2.4 Low cycle fatigue ... 7
2.5 Cyclic behaviour of materials ... 8
2.6 Principal factors influencing fatigue properties ... 9
2.7 Fatigue crack growth law ... 10
2.8 Short cracks propagation ... 11
2.9 Fatigue crack closure ... 13
2.10 The two-parameter approach ... 14
2.11 Fatigue tests ... 16
2.12 References ... 17
CHAPTER 3. RESEARCH BACKGROUND: FATIGUE IN POWDER METALLURGY ... 19
viii
3.1 Porosity ... 19
3.1.1 Description and parameters ... 19
3.1.2 Effect of porosity on fatigue ... 20
3.2 Microstructure ... 24
3.2.1 Effect of microstructure on fatigue ... 25
3.3 References ... 33
CHAPTER 4. STUDY OF THE EFFECT OF MICROSTRUCTURE HETEROGENEITY ON FATIGUE CRACK PROPAGATION OF LOW-ALLOYED PM STEELS ... 36
4.1 Introduction ... 38
4.2 Materials and experimental procedure ... 40
4.2.1 Materials ... 40
4.2.2 Fatigue crack growth tests ... 41
4.2.3 Characterization techniques ... 41
4.3 Results ... 42
4.3.1 Microstructure ... 42
4.3.2 Fatigue crack growth rate ... 44
4. Discussion ... 46
4.4.1 Fatigue crack growth behaviour ... 46
4.4.2 Crack closure analysis ... 50
4.4.3 Crack path analysis and fractography ... 52
4.5 Conclusions ... 58
4.6 References ... 60
CHAPTER 5. ROLE OF MICROSTRUCTURE HETEROGENEITY ON FATIGUE CRACK PROPAGATION OF LOW-ALLOYED PM STEELS IN THE AS-SINTERED CONDITION ... 63
5.1 Introduction ... 65
5.2 Materials and experimental procedure ... 67
5.2.1 Materials ... 67
5.2.2 Fatigue crack growth tests ... 67
5.2.3 Characterization techniques ... 68
5.3 Results ... 69
5.3.1 Microstructure ... 69
ix
5.4 Discussion ... 72
5.4.1 Fatigue crack growth behaviour ... 72
5.4.2 Crack closure analysis ... 77
5.4.3 Crack path analysis and fractography ... 79
5.5 Conclusion ... 86
5.6 References ... 88
CHAPTER 6. THE INFLUENCE OF DIFFERENT MICROSTRUCTURAL CONSTITUENTS ON THE FATIGUE CRACK PROPAGATION BEHAVIOUR OF A NICKEL PM STEEL ... 91
6.1 Introduction ... 93
6.2 Materials and methods ... 95
6.2.1. Materials ... 95
6.2.2. Fatigue crack growth tests ... 96
6.2.3. Characterization techniques ... 96
6.3 Results ... 97
6.3.1. Microstructure ... 97
6.3.2. Fatigue crack growth rate ... 101
6.4. Discussion ... 103
6.4.1. Fatigue crack growth (FCG) behaviour ... 103
6.4.2. Crack path analysis and fractography ... 107
6.4.3. Crack closure analysis ... 116
6.5 Conclusion ... 118
6.6 References ... 120
CHAPTER 7. GENERAL DISCUSSION ... 123
7.1. A comprehensive approach ... 123
7.2 Quantitative analysis of the crack path ... 124
7.3 Fractography ... 128
7.4 References ... 131
CHAPTER 8. THESIS CONCLUSION ... 132
8.1 key findings ... 132
x
List of Tables
Chapter 4.
Table 4-1- Main alloying elements of the studied materials (wt.%) ...40 Table 4-2- Phase volume fractions of the alloys (vol%) along with their microhardness values (HV). ...44
Chapter 5.
Table 5-1- Main alloying elements of the studied materials (wt.%) ...67 Table 5-2- Phase volume fractions of the alloys (vol%) along with their microhardness values (HV). ...70
Chapter 6.
Table 6-1- The cooling rates (°C) indifferent temperature ranges of the two types of heat-treatments used in
this study. ...95 Table 6-2- Phase volume fractions of the tested admixed PM steel (vol%) in different heat treatment
conditions along with their microhardness values (HV). ...101
xi
List of Figures
Chapter 2.
Figure 2-1- Schematic fatigue crack nucleation by cyclic slip [2]. ...5
Figure 2-2- Typical fatigue curves for ferrous and non-ferrous metals [12]. ...7
Figure 2-3- a) A sinusoidal stress vs. time fatigue loading curve and b) its relevant stress-strain hysteresis loop [15]. ...8
Figure 2-4- Schematic hysteresis loops for cyclic hardening at saturation [15]. ...9
Figure 2-5- Schematic crack growth rate versus stress intensity factor [10]. ...12
Figure 2-6- Fatigue crack growth rate for short and long cracks [10]. ...13
Figure 2-7- The effect of grain boundary on crack growth rate in an Al alloy [18]. ...13
Figure 2-8- ∆K-Kmax plots at two given crack growth rates [21]. ...15
Figure 2-9- A typical trajectory map along with different mechanisms that might happen in materials [21]. ...15
Chapter 3. Figure 3-1- 𝑑𝑎/𝑑𝑁-∆𝐾 curves for PM and conventional materials [10]. ...22
Figure 3-2- CSS curves of a cyclically loaded PM iron with different densities [10]. ...23
Figure 3-3- cyclic stress-strain curves with monotonic stress-strain curves for sintered iron at two densities [10]. ...23
Figure 3-4- Cyclic stress-strain curves and their monotonic ones for homogeneous Ni-Mo PM steel [10]. ...26
Figure 3-5- Martensite plate at tip of the pores resulting from the transformation of austenite induced by strain [8]. ...30
Chapter 4. Figure 4-1- Distribution of the pore a) size and b) shape for both admixed and pre-alloyed sinter-hardened PM steels. ...42
Figure 4-2- Microstructure of the a) admixed and b) pre-alloyed sinter-hardened PM steels, etched by Nital 2%. ...43
Figure 4-3- Fatigue crack growth rate vs. stress intensity factor range of the a) admixed and b) pre-alloyed sinter-hardened PM steels at different R-ratios. ...45
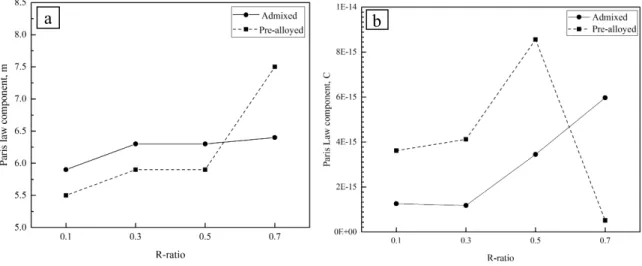
Figure 4-4- Variation of the a) slope (m) and b) the intercept (C) of the Paris regime versus the R-ratio. ...46
Figure 4-5- Variation of the FCG of admixed/FCG of pre-alloyed at different ∆Ks in the Paris regime. ...47
Figure 4-6- ∆K-Kmax plots of a) admixed b) pre-alloyed sinter-hardened PM steels, defining two limiting values at different crack growth rates. ...48
xii
Figure 4-7- Crack growth trajectory maps of the admixed and pre-alloyed sinter-hardened PM steels. ...49
Figure 4-8- fatigue crack growth rates of a) admixed and b) pre-alloyed sinter-hardened PM steels versus ∆K and ∆Keff. ...51
Figure 4-9- The ratios of the crack path/straight path for admixed and pre-alloyed sinter-hardened materials at four R-ratios. ...53
Figure 4-10- SEM micrograph of the Fe3C lamellae being pulled out during fatigue and then cut by the crack in the admixed PM steel tested at R=0.7 at the fracture surface. ...54
Figure 4-11- Fracture surfaces of the admixed sinter-hardened PM steels tested at a) R=0.1, b) R=0.7. More grains have been cut through at R=0.7 that shows the transgranular fracture. ...54
Figure 4-12- The ratios of the volume fraction of each phase in the crack path to its amounts in the material, for admixed sinter hardened PM steel at different R-ratios. ...56
Figure 4-13- SEM micrographs of the admixed sinter-hardened PM steel: a) the transverse section of the fatigue crack path through the Ni-rich ferritic regions (sinter necks), b) a secondary crack in the sinter neck. ...56
Figure 4-14- Fracture surfaces in the Paris regime of the a) admixed and b) pre-alloyed PM steels at R=0.5. ...58
Chapter 5. Figure 5-1- Microstructure of the a) admixed and b) pre-alloyed PM steels, etched by Nital 2%. ...69
Figure 5-2-Distribution of the pore a) size and b) shape for both admixed and pre-alloyed sinter-hardened PM steels. ...71
Figure 5-3-Fatigue crack growth rate vs. stress intensity factor range of the a) admixed and b) pre-alloyed PM steels at four tested R-ratios. ...72
Figure 5-4-Variation of the slope (m) of the Paris regime versus the R-ratio. ...73
Figure 5-5-Variation of the FCGs' ratios(admixed/pre-alloyed) against ∆K in the Paris regime. ...74
Figure 5-6-∆K-Kmax plots of a) admixed b) pre-alloyed PM steels, defining two limiting values at different crack growth rates. ...75
Figure 5-7- Crack growth trajectory maps of the admixed and pre-alloyed PM steels. ...76
Figure 5-8- Fatigue crack growth rates of a) admixed and b) pre-alloyed PM steels versus ∆K and ∆Keff. ...78
Figure 5-9-Profile roughness parameters for admixed and pre-alloyed at four R-ratios. ...80
Figure 5-10- Fracture surfaces of the admixed PM steels tested at a) R=0.1, b) R=0.7. Intergranular fracture is the principal mode of crack propagation in both micrographs. ...81
Figure 5-11- Fracture surface of the admixed PM steel at R=0.7. The grains have been cut by the crack showing the transgranular fracture in some parts of the fracture surface. ...82
Figure 5-12- The ratios of the volume fraction of each phase in the crack path to its amounts in the material, for admixed PM steel at different R-ratios. ...83
Figure 5-13- SEM micrograph of the fracture surface of the admixed PM steel at R=0.5. A secondary crack has passed through a sinter neck. ...84
xiii
Chapter 6.
Figure 6-1- Microprobe analysis of Ni concentration gradient in the as-sintered PM steel a) back scatter
electron micrograph b) line scan of Ni (wt.%) and c) X-ray map of Ni. ...98 Figure 6-2- Microstructures of the tested admixed PM steel in a) as-sintered, b) sinter-hardened and c)
oil-quenched conditions, etched using Nital 2%. ...100 Figure 6-3- Comparison of the distribution of pores a) size and b) shape in the tested admixed PM steel for the
three heat treatment conditions studied. ...101 Figure 6-4- Fatigue crack growth rate vs. stress intensity factor range of the tested admixed PM steel in
different heat treatment conditions (as-sintered, sinter-hardened and oil-quenched) and two R-ratios of 0.1 and
0.5...102 Figure 6-5-Variation of Paris law components; a) slope (m) and b) intercept versus the R-ratio. ...103 Figure 6-6- Variation of the calculated FCGs ratios in different heat-treatment conditions of the tested
admixed PM steel, against the ∆K in the Paris regime at two R-ratios. ...105 Figure 6-7- Variation of the calculated FCGs ratios of two R-ratios, in different heat-treatment conditions of
the tested admixed PM steel, against the ∆K in the Paris regime. ...107 Figure 6-8-Variation of profile roughness values for each microstructure (as-sintered, sinter-hardened and
oil-quenched) at two R-ratios. ...108 Figure 6-9- SEM micrographs of the fracture surfaces of the admixed PM steels in a,d) as-sintered, b,e)
sinter-hardened and c,f) oil-quenched conditions. The left column (a, b and c) are at R=0.1 and the right column(d,e
and f) are at R=0.5. ...110 Figure 6-10- SEM micrograph of cementite lamellae that are being pulled-out from their matrix in the
sinter-hardened PM steel at R=0.5. ...111 Figure 6-11- Ratios of the volume fraction of each phase in the crack path to its volume fraction in the
material for three heat-treatment conditions and two R-ratios studied. ...112 Figure 6-12- Fatigue crack growth rates of the tested admixed PM steel in a) as-sintered, b) sinter-hardened
and c) oil-quenched conditions versus ∆K and ∆Keff. Note that the filled dots are for ∆K and the hollow ones
are for ∆Keff. ...117
Chapter 7.
Figure 7- 1- a) SEM and b) optical micrographs of the fracture surface of the sinter-hardened admixed PM
steel tested at R=0.7. ...125 Figure 7-2- Optical micrographs of the crack path of FN0208 in a) as-sintered, b) sinter-hardened and c)
oil-quenched condition, along with d) crack path schemes. ...126 Figure 7-3- Schematic of roughness-induced crack closure a) a fully open crack b) a closed crack c) crack
deflection profile based on a model proposed by Suresh. ...127 Figure 7- 4- Fracture surface of the as-sintered admixed PM steel at R=0.5 with an overlaid xy grid. Arrows shows some points that were considered as transgranular fracture in this micrograph. ...129
xiv
xv
"Do not fear to be eccentric in opinion, for every opinion now accepted was once eccentric" Bertrand Russell
xvi
Acknowledgement
Every good thesis starts and goes on with a good advisor. I would like to express my special appreciation and thanks to my advisor Professor Carl Blais, you have been a tremendous mentor for me. I would like to thank you for encouraging my research and for allowing me to grow as a research scientist. Your advice on both research and my life has been priceless.
I would also like to extend my deep gratitude and respect to dearest Martine Demers and Andrée Lord. Living thousands of kilometres far from my mother, sometimes I needed a shoulder to cry on and that was when I always count on them. They have always been there for me during the challenging times of these past years and I was always being supported by their kindness and emotional supports. Many thanks also to the department's technicians especially Vicky Dodier, Daniel Marcotte and Nathalie Moisan who have all been a great help for me during my project.
My genuine appreciation goes to my lovely friends in Quebec, who have to be considered as my second family. I would like to especially thank my dearest Ranna, who has always encouraged me and given me confidence. I know her compliments were not true and she was just so kind to me, but I cannot deny that they did actually make me stronger and helped me through the tough times.
Words cannot express how grateful I am to my family for all of the sacrifices that they have made on my behalf. I would not have made it here without their support of all kinds. It must be very difficult to always encourage your child to do what's best for her while you know that will make you apart for a while or so. Thanks for being so understanding and supportive for every decision I made throughout my life.
Last by not the least, I would like to express my greatest gratitude to the love of my life, Amin. Sometimes you don't need an advice and all you really need is a hand to hold, an ear to listen and a heart to understand. Thank you for being all of them to me especially when I was intolerable. Thanks for believing in me and inspiring me through this challenging path. You are my favourite everything.
xvii
Preface
This thesis was prepared as an article insertion thesis comprising of eight chapters starting with the introduction, chapter 1 and ending with a conclusion, chapter 8. Chapter 2 and 3 present an overview of some basic knowledge about fatigue in metals and a thorough literature review on the most relevant works to this research, respectively. Chapters 4,5 and 6 regroup the published articles. Here are the information on the mentioned articles:
Mousavinasab. S., Blais. C., "Study of the effect of microstructure heterogeneity on fatigue crack propagation of low-alloyed PM steels", Materials Science and Engineering:
A 667 (2016) 444-453.
Mousavinasab. S., Blais. C., "Role of microstructure heterogeneity on fatigue crack propagation of low-alloyed PM steels in the as-sintered condition", metals 7(2) (2017) 60. Mousavinasab. S., Blais. C., "The influence of different microstructural constituents on the
fatigue crack propagation behaviour of a Nickel PM steel", International Journal of
Fatigue 99 (2017) 44–54.
General discussion, which consists of some extra data that have not been presented in the papers, is chapter 7. Conclusions and suggested future works are then presented in chapter 8. It has to be mentioned that in an effort to facilitate the referencing, appropriate references are listed at the end of each chapter.
Some results of this research were also presented as a poster in the International conference
on powder metallurgy and particulate materials: Powdermet 2016, which was held in June
2016 in Boston, MA, USA. This poster received a “Poster of Merit” award from the Metal Powders Industries Federation (MPIF)and was published in the "International Journal of
1
Chapter 1. Introduction
Powder metallurgy (PM) steels are increasingly replacing conventional steels because of the lower manufacturing costs associated with their near net shape processing as well as their sustainability. Regarding their specific microstructure-related features, namely porosity and heterogeneous microstructures, PM steels demonstrate different physical and mechanical properties compared to equivalent wrought steels. Since in most industrial applications, especially in the automotive industry, parts experience cyclic loads, fatigue of PM steels becomes an important mechanical property that requires more attention.
Porosity-related fatigue properties, including crack initiation and propagation in the presence of porosity, has been widely studied by several researchers. There exists almost nothing ambiguous on this topic in the literature and all researches are in agreement with the effect of porosity on fatigue properties. The problem that needs more clarification is fatigue behaviour associated with constituent phases in a heterogeneous microstructure, typical of PM steels. In other words, fatigue characteristics of PM steels such as fatigue crack propagation associated with different constituent phases, have to be thoroughly understood so that the proper microstructure can be identified for a specific application. There are some researches that have studied the effect of microstructure on fatigue crack initiation and propagation in PM steels, however the problem is still there since no unanimous conclusion was ever reached. To put it in another way, it has not yet been determined which microstructural phases may improve and which may degrade the fatigue properties of PM steels. This issue needs to be understood in order to make us capable of designing a proper alloy with an optimized microstructure that can enhance fatigue properties of PM parts. Therefore, the hypothesis is that the fatigue properties of a PM steel with a heterogeneous microstructure can be improved through a judicious combination of different microstructural phases.
The scope of this research is to find out the effect of different microstructural constituents of a PM steel having a heterogeneous microstructure on the fatigue crack propagation behaviour. Thus, the main objective of this research is to observe and follow the crack path through different microstructures in order to determine the interaction of the crack tip with
2
different phases. Our strategy was to design a comprehensive set of experiments along with different characterization methods that allow us to achieve quantitative conclusions on the matter. In order to achieve the above-mentioned goal, diverse microstructural constituents were characterized using different alloying techniques as well as the post-sintering heat-treatments. The samples were then tested in cycling loading i.e. went through fatigue experiments in a controlled temperature and humidity environment. The fatigue path was then studied using quantitative analysis of the fracture surfaces. Having fatigue crack growth rates in diverse microstructural phases along with different characterizations' techniques allowed us to generate a vast set of data to explore and compare. In other words, the comparison of the fatigue crack growth rates in different alloys containing different phases with the results of the quantitative analysis of the fracture surfaces has finally shed light to the existing problem of the fatigue behaviour of PM steels.
The most important basics about the fatigue properties of materials are presented in chapter
two whereas the research background containing the most relevant works to this study found in the literature is discussed in chapter three. Chapter four and five are about the effect of the microstructural phases in the sinter-hardened and as-sintered PM steels (respectively) on fatigue crack propagation behaviour through which the fatigue properties of the mentioned alloys were studied and discussed in detail but the comparison was only between the heterogeneous and homogeneous microstructures of each alloy. In other words, there were no comparisons between the fatigue behaviour of different heat-treated PM steels. It has to be mentioned that the difference between these two chapters is the difference in the heat-treatment i.e. different microstructures of the studied PM steels. Chapter six is about comparing and studying the fatigue crack propagation in three different heat-treatment conditions. Chapter seven presents supplementary information and analysis which are not discussed in the papers. Finally, chapter eight is to conclude and summarize the acquired results as well as to present some suggestions for the future works on this topic.
3
Chapter 2. A Review: Fatigue in metals
To study fatigue properties of PM materials, it is essential to know some basics of fatigue itself. This section is an introduction to fatigue as a material property in metallic structures, which includes a brief history and definition, fatigue mechanisms and modeling laws, fatigue strength and parameters affecting it, low cycle fatigue, cyclic behaviour of materials, short cracks propagation, crack closure and eventually fatigue tests.
2.1 History and definition
Fatigue damage refers to a change in materials properties caused by a cyclic loading in which its repetition leads to fracture [1]. Fatigue was first reported in the 19th century during the development of the industrial revolution. In those days, fatigue was a mysterious problem since it could not be seen and failure occurred without any notice. August Wöhler who has performed a major research on fatigue, stated that fatigue could occur at stresses below the static strength of the material when the load is repeated many times. He also recognized that there should be no small radii in the geometry of the structure to be protected from fatigue fracture. At that time, it was thought that fatigue could be just an engineering problem [2, 3]. In the beginning of the 20th century, Ewing and Humfrey [4] took a huge step towards understanding fatigue by showing that fatigue could also be a material-related phenomenon. Using microscopic investigation they found out that the mechanism of fatigue starts with the nucleation of a small crack followed by crack growth that eventually leads to a complete failure [2, 3]. In the middle of 20th century Peterson [5] and Timoshenko [6] developed their research on the topics of fatigue strength limit and stress concentration.
2.2 Fatigue mechanism; fatigue crack initiation and propagation
Fatigue life until fracture consists of two main periods; the crack initiation period and the crack propagation period. These two main periods can be influenced by different factors or the same factor but in different ways, thus distinguishing between these two is of great
4
importance especially in fatigue predictions. It is to be mentioned that the crack initiation period itself can be split into crack nucleation and micro-crack growth periods [2].
2.2.1 Crack initiation
Fatigue crack initiation and propagation are both a result of cyclic slip, which conveys cyclic plastic deformation and dislocation activities. This plastic deformation is limited to a small number of grains, since fatigue occurs at stresses far below the yield stress of the material. Thus, micro-plasticity occurs in grains located at the surface of the materials because of their lower constraint on slip. Furthermore inhomogeneous stress distribution which could be the result of any kind of geometrical discontinuity on the surface, will cause stress concentration that also favours the initiation of cracks on the surface [2]. Researches carried out by Forsyth demonstrate that fatigue damage is mainly related to surface as well [7, 8]. He also stated in another publication reasons for crack initiation at the surface, including preferred sites for dislocation nucleation and higher mobility of dislocations near the surface [9]. It is to be mentioned that inclusions and pores can also contribute to crack nucleation since they can change the stress distribution at the micro-level by acting as stress concentration sites [2].
Cyclic shear stress is a prerequisite for cyclic slip. The shear stress on crystallographic planes varies from grain to grain and is not distributed homogenously through the material. Its distribution depends on size and shape of the grains, crystallographic orientation of the grains and elastic anisotropy of the material. Slip will occur in surface grains in which the mentioned conditions are more favourable than for other surface grains. When slip happens in a surface grain, a step is formed on the surface of the material as it can be seen in Figure 1-1.a. In most environments, a strongly adhesive oxide layer will form on the new surface that cannot be removed readily. Moreover, strain hardening on the slip band can also occur during the increase of the load, which implies that not all dislocations go back to their original positions. Thus, fatigue is not a fully reversible phenomenon according to the formation of the adhesive layer as well as strain hardening. Upon unloading in a loading cycle, reversed slip preferably occurs on the adjacent slip planes of the same slip band (Figure 2-1.b). Cracks are then initiated from surface irregularities (intrusions and extrusions) that were caused by slip bands [1, 2]. These slip bands are called persistent slip
5
bands that appear after cyclic deformation and persist even after electropolishing [10]. The intrusion-extrusion crack initiation mechanism often occurs in pure metals and some alloys in which no pores and inclusions exist. Nevertheless, in commercial materials that contain the aforementioned defects, fatigue crack will start from these metallurgical stress concentration sites [11].
From the description of crack initiation presented above, it can be concluded that in crack initiation period, fatigue is a phenomenon mostly related to the surface finish of materials.
Figure 2-1- Schematic fatigue crack nucleation by cyclic slip [2].
2.2.2 Crack propagation
After crack nucleation at the surface of the material, cracks start to propagate on planes that are oriented at 45° to the applied load, at which they grow a few micrometer per cycle. This stage which is known as stage I, may be considered as an extension of the nucleation process [10]. The presence of a micro-crack leads to inhomogeneous stress distribution at a micro-level, with a stress concentration at the tip of the micro-crack. Consequently, more than one slip system may be activated. Besides, according to the fact that the constraint on slip displacement will be increased due to the presence of neighbouring grains, accommodation to the slip displacement is too difficult with just one slip system. As a result, stage II is initiated and micro-cracks will deviate from their initial slip band orientation and the preferred orientation generally becomes perpendicular to the applied load [2]. a b c d e free surface new fresh surface 1st cycle 2nd cycle extrusion slip bands
6
Since micro-crack growth depends on cyclic plasticity, any barriers to slip could act as a barrier to crack growth as well. So micro-crack growth rate can be slowed down or even stopped when a micro-crack reaches material structural barriers such as grain boundaries. However, micro-crack growth rate can increase after passing the barrier. Thus, there is inhomogeneous crack growth initially, but the situation will change whenever a crack passes a large number of grains and crack growth occurs. Since the coherency of the crack front should be retained, cracks cannot have an optional direction in each grain or they cannot grow with an independent rate from other growth rates in the adjacent grains. Hence, there would not be large gradient of crack growth rates at this stage. Crack growth rate is related to the crack growth resistance of the material and is no longer affected by surface aspects [2].
The relative significance of crack initiation and propagation periods depends on stress amplitude, component geometry, nature of the material, temperature and environment [1].
2.3 Fatigue strength
Before entering this section, it is important to define some parameters in fatigue. These parameters are: • Stress range ∆𝜎 = 𝜎)*+− 𝜎)-. • Stress amplitude 𝜎* = 𝜎)*+− 𝜎)-. 2 • Mean stress 𝜎) = 𝜎)*+ + 𝜎)-. 2 • Stress ratio 𝑅 = 𝜎)-. 𝜎 )*+
Where 𝜎)*+ and 𝜎)-.are maximum and minimum stress levels respectively. Fatigue life or
the behaviour of the material under fatigue traditionally described with S-N curves also called Wӧhler curves, which represent stress amplitude versus number of cycles to failure [10]. S-N curves for materials are obtained by measuring fatigue strength at diverse stress levels. A typical S-N curve is shown in Figure 2-2 for steel and aluminum alloys. It can be seen that the curve for steel becomes horizontal at a certain stress called fatigue limit or endurance limit, while non-ferrous metals such as aluminum show a gradual decrease in
7
stress by increasing the number of cycles. In the latter case, fatigue strength is given at an
arbitrary number of cycles e.g. 108 [12].
Basquin equation (Equation 2-1) describes a relation between stress amplitude and number of reversals to failure, which is twice the number of cycles to failure.
𝜎* = ∆2 3 = 𝜎4 5 2𝑁 4 6 Equation 2- 1
Where 𝜎* is the stress amplitude, 𝜎45 is the fatigue strength coefficient, 𝑁
4 is the number of
cycles to failure and b is the fatigue strength exponent. It is to be considered that this relationship is for high cycle fatigue, a more common case of fatigue, which occurs when the stress level is low and there is no measurable plastic deformation. This kind of fatigue is related to the elastic behaviour of a material, while the low cycle fatigue is associated with macroscopic plastic deformation [2, 10].
Figure 2-2- Typical fatigue curves for ferrous and non-ferrous metals [12].
2.4 Low cycle fatigue
Low cycle fatigue is a different phenomenon from high cycle fatigue, since plastic deformation befalls in each cycle. While high cycle fatigue, as mentioned in the previous section, occurs in an elastic state. Applications such as a pressure vessel or a power generator, are subjected to low cycle fatigue, thus experience small numbers of load cycles, e.g. 1000 cycles, through their fatigue life. In this kind of fatigue, high stress levels are
Number of cycles to failure, N
Ca lc ul at ed b en di ng s tr es s, M P a Steel Aluminium Fatigue limit
8
present, crack nucleation occurs rapidly and the duration of visible crack growth is hardly observed [2].
Coffin [13] and Manson [14] observed a linear relationship between the strain amplitude and number of cycles for low cycle fatigue if plotted on a logarithmic scale. The Manson-Coffin relationship is presented in Equation 2-2.
27 8 = ∆9:; 3 = 𝜀4 5 2𝑁 4 = Equation 2- 2
Where ∆𝜀>? is the plastic strain amplitude, 𝜀45 is the ductility coefficient in fatigue, 𝑁
4 is the
number of cycles to failure and c is the ductility component in fatigue. "c" is the slope of the mentioned linear relationship, by which the fatigue life is longer for the smaller value of this term [10].
2.5 Cyclic behaviour of materials
As previously defined, fatigue occurs in materials as a result of a time-dependant stress or strain loading spectrum, which in a simple form could be a sinusoidal spectrum (Figure 2-3.a). By recording the stress as a function of the strain, a stress-strain hysteresis loop could be generated and assigned to each cycle, as it has been shown in Figure 2-3.b [15].
Figure 2-3-a) A sinusoidal stress vs. time fatigue loading curve and b) its relevant stress-strain hysteresis loop[15].
According to different cyclic behaviour of materials, the stress amplitude, under constant strain, might not be stable throughout successive cycles. Some materials, usually ones that are already hardened, may show cyclic softening that implies that the stress amplitude
9
decreases progressively until a stable condition named saturation is reached. The reason for this decrease in stress is said to be related to the freedom of dislocations from their initial locations. However, some materials may show cyclic hardening or, in other words the gradual increase in the stress amplitude, which is usual for initially soft materials due to the blocking of their free dislocations. After a number of cycles, which is low in comparison to the fatigue life, both of the mentioned cyclic behaviours would approach a stabilized condition (saturation), where the stress remains almost constant. If a stabilized condition
did not appear, data for half of the number of failure cycles (0.5Nf) could be used instead
[2, 15].
Figure 2-4 shows the schematic cyclic strain curve that can be plotted using stress-strain data pairs obtained from fatigue tests performed at different load levels. The CSS curve should be considered as a pendant to monotonic stress-strain curve obtained from tensile test, in order to determine the cyclic behaviour of a material. [15].
Figure 2-4- Schematic hysteresis loops for cyclic hardening at saturation [15].
2.6 Principal factors influencing fatigue properties
One of the main factors that can affect and reduce the fatigue strength of a material is the presence of a stress raiser that is either caused by geometrical discontinuities or by metallurgical defects such as porosity and inclusions. Stress distribution in material containing stress raisers will not be uniform, thus there will be a stress concentration
Cyclic stress-strain curve (CSSC)
10
region. The ratio of the maximum stress to the nominal stress is called stress concentration
factor (Kt). Effect of these stress raisers can be studied using notched specimens [12].
Another factor that could affect the fatigue strength is the size of a specimen or a part. The larger the specimen, the higher the amount of its surface area. According to the fact that fatigue starts from surface, larger specimens have lower fatigue strength compared to exactly the same structure but smaller size specimens. In addition, if a stress gradient, due to a stress raiser exists in a specimen, it is usually decreased by increasing the size of the specimen. As a result, the volume of material that is experiencing high stress will increase [2, 12].
Mean stress is another influencing factor on fatigue properties. Increasing the mean stress implies an increase of maximum stress, which results in reduction of fatigue limit of a specimen. Surface characteristics such as surface roughness and surface residual stresses, type of loading, environment and temperature could also affect the fatigue life. It is worth noting that fatigue properties can be related to tensile properties of a material as well, meaning that the parameters that affect tensile properties could also affect fatigue properties. For instance solid solution alloying and grain size reduction could give rise to increased fatigue strength [2, 12].
2.7 Fatigue crack growth law
Determining and predicting the fatigue life which is an important issue in fatigue studies is highly dependent on determining the crack growth behaviour. Analyzing the fatigue crack growth can be done using linear elastic fracture mechanics (LEFM) although there is a plastic zone at the crack tip. The only assumption to be made is that the crack exists in the structure [10, 15]. Using this approach and doing some modification on the stress intensity factor concept proposed by Irwin [16], Paris developed the following empirical relationship called Paris law.
@*
@A= 𝐶∆𝐾
11
Where a is the crack length, N is the number of cycles, ∆𝐾 is the stress intensity factor and C and m are empirical constants depending on different factors such as material and test conditions. He stated that a defect, such as a crack, in a structure would grow by a rate 𝑑𝑎 𝑑𝑁 if subjected to fatigue, and that the driving force for that growth is the local stress intensity range (∆𝐾). Plotting crack growth rate versus stress intensity factor on a logarithmic scale results in a curve which is shown schematically in Figure 2-5 [10, 15]. Three distinct regions are shown on this curve in which crack growth rate is affected by different factors. In region I, crack grows less than a lattice space for each cycle. Microstructure, stress ratio (R) and the environment have a huge effect on crack growth. Region II is where the microstructure, environment and stress ratio have a smaller influence on crack propagation rate and Paris law can be applied. The lower limit in this region is called threshold stress intensity factor (∆𝐾CD) below which the crack will not propagate. Finally, in region III the crack growth mechanism is the same as in static loading for example cleavage and intergranular. All influencing factors for region I also affects the crack propagation rate in this region except the environment [1, 10].
2.8 Short cracks propagation
A crack will be defined as a short crack if its length is smaller than microstructural units such as a grain or a precipitate. This short crack regime is associated with crystallographic propagation in stage I. Linear elastic fracture mechanics (LEFM) theory and the Paris law driven from it, can no longer be applied to these short cracks that are propagating at the surface of materials or from the root of a notch. As mentioned earlier, by applying LEFM theory to long cracks, a threshold stress intensity factor exists below which there would be no crack propagation. However, short cracks could grow at ranges below the threshold determined for long cracks which has been shown in Figure 2-6 [10].
12
Figure 2-5- Schematic crack growth rate versus stress intensity factor [10].
The growth rate of these short cracks is irregular. This irregularity is due to the fact that in stage I of crack propagation, the crack growth rate could decrease when the growing cracks along slip planes reach a microstructural barrier such as grain boundary; while this rate would increase when some of these cracks pass the barrier. This increase will be continued until those cracks approach the next grain boundary or barrier. This process will repeat several times until the transition to stage II occurs, in which the propagation rate will increase [1]. Figure 2-7 illustrates the above-mentioned mechanism for an Al alloy.
Although some crack might pass microstructural barriers, some may get arrested by microstructural barriers. One of the blocking mechanisms at grain boundaries is the rotating angle of the sliding plane of the adjacent grain with respect to the crack plane. The crack cannot pass a grain boundary unless the rotating angle remains very low [17]. Therefore, their propagation is strongly dependant on the microstructure.
log ∆K lo g(d a/ dN ) 𝑑𝑎 𝑑𝑁= 𝐶∆𝐾) Rapid propagation No propagation III II I
13
Figure 2-6- Fatigue crack growth rate for short and long cracks [10].
Figure 2-7- The effect of grain boundary on crack growth rate in an Al alloy [18].
2.9 Fatigue crack closure
The crack closure phenomenon which is the contact of fatigue crack surfaces in the presence of tensile stress, was first introduced by Elber [19]. As the crack propagates through the material, a plastically deformed region will be generated at the tip of it while the surrounding region remains elastic. This crack tip plasticity was mentioned to be the
14
reason for premature contact of the crack surfaces or, in other words, closure of the crack, which could reduce the crack growth driving force. Thus, by noticing that the crack might not grow unless it is fully open, Elber suggested that in crack growth analysis, one should use ∆𝐾E44 instead of using ∆𝐾, at which 𝐾)-. has been replaced by 𝐾F> (𝐾F>is related to stress intensity factor when the crack in fully open) [1, 20].
In addition to crack tip plasticity, other justifications have also been suggested for the crack closure phenomenon including surface roughness, phase transformations and asperities from oxides at the tip of the crack [10].
2.10 The two-parameter approach
Generally, there are five local parameters in fatigue namely; Kmin, Kmax, Kmean, R and ∆K.
According to the Paris law, explained earlier, the local stress intensity range (∆K) is the only driving force for fatigue crack propagation and a threshold amount exists for this parameter below which cracks will not propagate. However, in a two-parameter approach
proposed by Sadananda and Vasudevan [21], there are two parameters, ∆K and Kmax, that
will act as driving forces in fatigue crack propagation. Hence, in this unified approach, there exist two thresholds which should be met simultaneously for crack propagation to take place.
If it is accepted that there are two driving forces for fatigue crack propagation, it is then crucial to present the fatigue crack growth rates (@A@*) versus these two parameters (∆K and Kmax) instead of just one parameter as in the Paris law. This kind of representation would
make a three-dimensional (3D) plot that might not be practical and/or convenient to use. So,
Sadananda and Vasudevan proposed a two-dimensional ∆K-Kmax plot that can be drawn at any
crack growth rate, defining the limits of these two parameters at that specific rate. A schematic
example of this kind of plots is presented in Figure 2-8. If these curves are plotted at @*
@A= 0,
a fundamental threshold curve is obtained that defines two thresholds, ∆K*th and K*max,th, below
15
Figure 2-8- ∆K-Kmaxplots at two given crack growth rates[21].
Another application of the two-parameter approach is that the fatigue crack growth
mechanisms can be determined using the trajectory maps derived from ∆K-Kmax plots.
Trajectory maps are obtained from the variations of the limiting values of ∆K and Kmax
with crack growth rate (Figure 2-8). In these kinds of plots, a reference line at 45°, where
∆K*= K*max, is drawn in order to illustrate the deviations of trajectory. This reference line
demonstrates the pure fatigue crack growth behaviour and any deviations from this line, according to the angle of deviation, could be attributed to the effect of environment or monotonic fracture on fatigue crack growth behaviour [22]. A typical trajectory map along with different mechanisms is shown in Figure 2-9.
16
2.11 Fatigue tests
Fatigue tests with different types of load, specimens, environments and equipment can be done usually for two main objectives, namely: engineering and research. While the former objective is dealing with the fatigue properties of materials, joints, structures, etc, the latter is about understanding the concept of fatigue and its variables. In conventional fatigue tests, the material should be given a cyclic load with a determined stress amplitude and the number of cycles to failure should be recorded. The cyclic load could be applied in the form of either rotating bending or direct stress [2].
There is also another type of fatigue test that is not about obtaining the S-N curve or the fatigue strength of a material. The fatigue crack propagation test involves the measurement of the fatigue crack growth rate. The result of this test is a plot of 𝑑𝑎 𝑑𝑁 versus ∆𝐾, where 𝑑𝑎 𝑑𝑁 is obtained from a crack length vs. number of cycles curve and ∆𝐾at the crack tip could be computed from crack length and load [10].
17
2.12 References
[1] C. Bathias, Fatigue of materials and structures vol. 53: Wiley. com, 2013.
[2] J. Schijve, Fatigue of structures and materials: Springer, 2001.
[3] J. Schijve, "Fatigue of structures and materials in the 20th century and the state of
the art," International Journal of Fatigue, vol. 25, pp. 679-702, 2003.
[4] J. A. Ewing and J. C. W. Humfrey, "The fracture of metals under repeated
alternations of stress," Philosophical Transactions of the Royal Society of London.
Series A, Containing Papers of a Mathematical or Physical Character, vol. 200, pp.
241-250, 1903.
[5] R. E. Peterson, "Discussion of a century ago concerning the nature of fatigue, and
review of some of the subsequent researches concerning the mechanism of fatigue,"
ASTM Bulletin, vol. 164, pp. 50-6, 1950.
[6] S. Timoshenko, "Stress concentration in the history of strength of materials," Proc
Soc Exp Stress Anal, vol. 12, pp. 1-12, 1954.
[7] P. J. E. Forsyth, "Some metallographic observations on the fatigue of metals," J.
Inst. Metals, vol. 80, 1951.
[8] P. J. E. Forsyth, "Exudation of material from slip bands at the surface of fatigued
crystals of an aluminium-copper alloy," Nature, vol. 171, pp. 172-173, 1953.
[9] P. J. Forsyth, "Fatigue behaviour and its dependence on microstructure," Fatigue:
Relations between metallurgical and mechanical aspects, pp. 1-25, 1973.
[10] M. A. Meyers and K. K. Chawla, Mechanical behavior of materials vol. 547: Cambridge University Press Cambridge, 2009.
[11] K. S. Chan, "Roles of microstructure in fatigue crack initiation," International
Journal of Fatigue, vol. 32, pp. 1428-1447, 2010.
[12] G. E. Dieter, Mechanical metallurgy vol. 3: McGraw-Hill New York, 1976.
[13] L. Coffin Jr, "LOW CYCLE FATIGUE--A REVIEW," General Electric Co. Research Lab., Schenectady, NY1962.
[14] R. W. Smith, M. H. Hirschberg, and S. Manson, "Fatigue behavior of materials under strain cycling in low and intermediate life range," DTIC Document1963. [15] U. Krupp, Fatigue crack propagation in metals and alloys: Wiley. com, 2007. [16] G. R. Irwin, "Handbuch der Physik, Vol. VI," ed: Springer, Berlin, 1958.
18
[17] T. Zhai, X. P. Jiang, J. X. Li, M. D. Garratt, and G. H. Bray, "The grain boundary geometry for optimum resistance to growth of short fatigue cracks in high strength Al-alloys," International journal of fatigue, vol. 27, pp. 1202-1209, 2005.
[18] A. F. Blom, A. Hedlund, and W. Zhao, "Short fatigue crack growth behaviour in Al 2024 and Al 7475," Mechanical Engineering Publications, The Behaviour of Short
Fatigue Cracks, pp. 37-66, 1986.
[19] W. Elbert, "The significance of fatigue crack closure," in Damage Tolerance in
Aircraft Structures: A Symposium Presented at the Seventy-third Annual Meeting American Society for Testing and Materials, Toronto, Ontario, Canada, 21-26 June 1970, 1971, p. 230.
[20] E. Wolf, "Fatigue crack closure under cyclic tension," Engineering Fracture
Mechanics, vol. 2, pp. 37-45, 1970.
[21] K. Sadananda and A. K. Vasudevan, "Crack tip driving forces and crack growth representation under fatigue," International Journal of Fatigue, vol. 26, pp. 39-47, 2004.
[22] K. Sadananda and A. K. Vasudevan, "Fatigue crack growth mechanisms in steels,"
19
Chapter 3. Research background: Fatigue in powder metallurgy
Powder metallurgy (PM) has been introduced widely into industry due to its almost near-net shape capacity and low processing costs. According to the fact that in industrial applications, particularly in the automotive industry, parts often experience cyclic loading; it is of great importance to understand fatigue in PM parts. It has been demonstrated in earlier studies that the fatigue strength of PM materials cannot be reported as a fixed percentage of their ultimate tensile strength since it depends on their specific features [1, 2]. Therefore, this section is related to fatigue properties of PM steels according to their specific features such as porosity and inhomogeneity in constituent phases of the microstructure.
3.1 Porosity
3.1.1 Description and parameters
The main specific feature in the microstructure of powder metallurgy steels is the presence of porosity, which is related to density as shown in Equation 3-1.
𝑃 = 1 −KK
L Equation 3- 1
Where P is porosity, 𝜌is apparent density and 𝜌N is bulk density of the material. Several
researches have been done on the effect of porosity on mechanical properties of PM components, all concluding that a porous structure adversely affects mechanical properties [3-5]. Porosity reduces the effective load bearing cross section, through which the mechanical properties such as strength and ductility will degrade. Besides, porosity increases the internal surface area that affects surface sensitive properties including fatigue strength [6]. Moreover, as mentioned earlier, pores may change the stress distribution at the micro-level leading to stress concentration at the pores. Hence, porosity and its amount is an important parameter that affects mechanical properties, such as fatigue strength, in a way that, the lower the amount of porosity, the better the mechanical properties [7]. It is to be noted here that in low densities PM materials, i.e. high porosity, total porosity is the overcoming parameter on mechanical properties, whereas in high densities, i.e. low porosity, pore characteristics
20
including size, shape and distribution plus matrix microstructure and inclusions happen to be the dominant parameters [8].
Another porosity-related parameter that can affect mechanical properties is the type of porosity. Two types of porosity can be found in PM components, namely interconnected and isolated pores. The former one has a more pronounced effect on ductility. Indeed, an interconnected pore structure in which pore channels reach the surface are called open porosity as well. Presence of this kind of porosity implies that sinter necks between particles are small, which could lead to failure due to highly localized ductile rupture, and as a result the macroscopic ductility decreases. In contrast, in the case of isolated pores or closed porosity, the contribution of the larger volume of the material to deformation, may result in an increase in macroscopic ductility [3, 7]. Danninger et al. stated that the strength to weight ratio is small in the presence of interconnected porosity and the contribution of the metallic phase to mechanical properties is low, which is the same condition as a chain with intermittent thin and thick links where the weight and strength are determined by heavy and thin links respectively [3]. The shape of the pores can also be a significant parameter on mechanical properties, by being a determining factor for the intensity of stress concentration. This implies that angular pores create a higher stress concentration compared to round pores [9]. Size and distribution of pores are also important parameters of a porous structure that need to be considered in studying fatigue strength of a PM component. To put it in a nutshell, porosity, which is the main characteristic of PM materials, affects fatigue in different aspects through the volume fraction of pores, their size, shape, type and distribution. These parameters are themselves a function of powder characteristics and processing routes such as powder size distribution, alloying additives, compaction pressure and sintering temperature.
3.1.2 Effect of porosity on fatigue 3.1.2.1 Crack initiation and propagation
Crack nucleation in conventional materials would occur from stress raisers sites such as slip bands, inclusions, precipitates and notches, whereas in PM materials pores can change the stress distribution and act as stress concentrations sites. The same as for other defects that
21
contribute to fatigue crack nucleation in conventional materials, the location of the pores should also be considered when studying fatigue of PM parts [10]. Holmes and Queeney demonstrated that high stress concentration at pores, especially surface pores, results in localized slip that could initiate crack nucleation. Moreover, the number of cycles for crack initiation decreases with increasing volume faction of porosity. They presented three reasons for their observations namely, the stress concentration caused by pores, the reduction of effective load bearing cross-section and pore structure being a crack precursor [4].
In addition to the aforementioned effects of porosity on crack initiation, crack propagation rate is also influenced by porosity. The fatigue crack growth versus stress intensity factor curve (𝑑𝑎 𝑑𝑁-∆𝐾) can also be plotted for PM irons and steels, which is basically the same as the one for wrought materials. Figure 3-1 compares 𝑑𝑎 𝑑𝑁-∆𝐾 curves for both PM and wrought materials, which have been studied under identical conditions. It can be observed that near the threshold regime, PM and conventional materials have almost identical behaviour, while in the Paris regime, PM showed higher propagation rates due to the sensitivity of material parameter (C in equation 1-3), to porosity. This sensitivity is such that the coefficient C increases with increasing porosity, leading to a higher crack growth
rate compared to wrought steels in a comparable ∆𝐾. Effect of porosity could also be
noticed in Figure 3-1 [10, 11].Furthermore, it has also been reported that for a volume
fraction of porosity above 8%, ∆𝐾CD is affected by porosity. The threshold stress intensity
range decreases as porosity increases [12].
As for the effect of pore shape on fatigue crack growth, round pores decrease crack propagation rate by blunting the crack tip [13], whereas angular pores with sharp edges favour crack propagation by acting as linkage sites [14].
22
Figure 3-1- 𝑑𝑎 𝑑𝑁-∆𝐾 curves for PM and conventional materials [10].
3.1.2.2. Cyclic stress-strain curve (CSSC)
The whole concept of cyclic stress strain curves of PM materials is the same as the ones for wrought materials. The only difference is related to special plasticity behaviour of PM parts, which is the pronounced yielding that could occur locally in sintered necks (between pores), at macroscopic elastic condition. The CSS curves of a cyclically loaded PM iron with different densities, which have been plotted by Klumpp [15], highlight the particular plasticity behaviour of powder metallurgy materials. These curves are shown in Figure 3-2. It can be seen that for a constant stress amplitude, the amount of plastic strain is increased by decreasing density. It is to be mentioned here that the plastic strain is proved to be a damaging parameter in fatigue [10].
The deteriorating effect of porosity on fatigue can also be seen in Figure 3-3, which shows cyclic stress-strain curves along with monotonic stress-strain ones for sintered iron at two densities. From this figure, the occurrence of cyclic softening is seen for both curves as well [10].
23
Figure 3-2- CSS curves of a cyclically loaded PM iron with different densities[10].
Figure 3-3- cyclic stress-strain curves with monotonic stress-strain curves for sintered iron at two densities [10].
3.1.2.2. S-N curves
The same as for conventional materials, the fatigue life data of PM materials in a LCF regime should be presented on a plastic strain versus number of cycles plot (Coffin-Manson plot). Lindstedt and Karlsson [16] obtained such curves for Ni-Mo PM steels at different densities through which they observed that the strain life is diminished whenever porosity
24
increases. The difference between strain life curves is also enlarged by decreasing the porosity which suggests that the microstructural effect is reduced as porosity increases [10]. There also exists researches on high cycle fatigue (HCF) of PM irons that have studied the effect of porosity on fatigue limit, by which it can be stated that the fatigue limit will increase with increasing density [15, 17].
In the case of comparing the S-N curve of PM materials with their equivalent wrought ones, it has been demonstrated that the S-N curve of the PM iron, shifts towards the lower stress amplitudes and this shift could have been increased by increasing porosity, which is said to be related to the rise in the amount of crack initiation sites [18].
3.2 Microstructure
Apart from porosity, the other specific feature of PM materials is their heterogeneous microstructure or in a more detailed description, the inhomogeneity in constituent phases of the microstructure. Microstructure of a PM material depends on the production process and the alloying technique. There are four main alloying techniques used in powder metallurgy namely admixed, diffusion alloyed, pre-alloyed and hybrid [11]. Excluding the pre-alloyed technique, the other three typically result in a heterogeneous microstructure. This heterogeneity occurs mainly due to incomplete diffusion of alloying elements that occurs due to low diffusion rates of alloying elements, large particle size, high repulsion between elements due to their chemical potential and some processing variables such as insufficient sintering temperature and time [6, 11]. Heterogeneity/homogeneity of a microstructure has a complex effect on fatigue properties, for example from the classical metallurgical view, one might say that the homogeneous structures such as the one obtained with pre-alloyed materials, are preferred in fatigue sensitive applications. However, there exist some investigations that have demonstrated that heterogeneous microstructures could be considered as a reinforced structure the same as for composite materials, through which fatigue properties increase [11].
Effect of the microstructure of a PM material on different aspects of fatigue such as cyclic behaviour, fatigue strength and crack initiation and propagation has been studied by several researchers, some of them are presented in the following sections.
25 3.2.1 Effect of microstructure on fatigue 3.2.1.1 CSS curves and fatigue strength
Bertilsson and Karlsson obtained the CSS curves and their pendant monotonic ones for both homogenous and heterogeneous Ni-Mo PM steels at different densities. Figure 3-4 shows these curves for the homogeneous one that contains pearlite. A similar cyclic behaviour was also observed for the inhomogeneous microstructure of this alloy in which pearlite, ferrite and martensite were the microstructural constituents. The cyclic behaviour is such that cyclic softening and hardening have occurred at low and high strain amplitude, respectively. For both alloys studied, with homogenous and heterogeneous microstructure, they concluded that the ultimate tensile strength and yield strength increase with reducing porosity [19]. According to the Bertilsson and Karlsson research, it may be concluded that the microstructure and its homogeneity have almost no influence on cyclic softening or hardening behaviour of materials and it is the alloying element that is responsible for the type of cyclic behaviour.
Furthermore, in another research by Esper et al., dynamic behaviour of Cu-Ni and Fe-Cu-C PM steels were investigated and it was concluded that the former alloy showed cyclic hardening whereas the latter presented cyclic softening. Since the equivalent wrought steels were reported to have the same behaviour, it was deduced that the matrix microstructure is responsible for the dynamic behaviour of PM and wrought steels, and porosity has almost no effect on this behaviour for PM materials [20].
As for the influence of matrix microstructure on fatigue strength, it has been shown by Lindqvist [21] that the fatigue strength of PM irons would have been improved using Ni, Mo, Cu and C as alloying elements, which could be related to matrix strengthening due to solid solution hardening. Similar to conventional steels, the higher the amount of carbon content or any other favourable alloying elements, the higher the strength of the material [10].
26
Figure 3-4- Cyclic stress-strain curves and their monotonic ones for homogeneous Ni-Mo PM steel [10].
3.2.1.2 Crack initiation and propagation
As previously discussed, fatigue crack initiation and propagation are results of a plastic deformation. Therefore, anything that could affect the plastic deformation of a material, whether it is a wrought material or a PM one, will affect its fatigue crack initiation and propagation. Since the microstructure of a material can change the plastic deformation behaviour, it can probably affect the fatigue crack initiation and growth as well [22]. - Crack initiation
Fatigue crack initiation occurs whenever a stress raiser such as slip bands, inclusions, pores and notches, is present in the material. In PM materials, cracks will most probably nucleate at pores, since they play the role of stress raisers and in some instances may be surrounded by mechanically weak areas such as Ni-rich austenite [23-25]. There exist some contradictory results, with pores being the dominant crack initiation sites, when a heterogeneous microstructure is present.
In a study by Abdoos et al. [22] on fatigue behaviour of a diffusion alloyed PM steel (Distaloy AE), with the composition of Fe-4Ni-1.5Cu-0.5Mo -0.3 and 0.5 C, it was found out that in contradiction to previous studies demonstrating that sinter necks are the weakest
![Figure 2-3-a) A sinusoidal stress vs. time fatigue loading curve and b) its relevant stress-strain hysteresis loop[15]](https://thumb-eu.123doks.com/thumbv2/123doknet/6428849.170481/25.918.194.722.693.920/figure-sinusoidal-stress-fatigue-loading-relevant-stress-hysteresis.webp)
![Figure 2-7- The effect of grain boundary on crack growth rate in an Al alloy [18].](https://thumb-eu.123doks.com/thumbv2/123doknet/6428849.170481/30.918.248.705.474.818/figure-effect-grain-boundary-crack-growth-rate-alloy.webp)
![Figure 3-2- CSS curves of a cyclically loaded PM iron with different densities[10].](https://thumb-eu.123doks.com/thumbv2/123doknet/6428849.170481/40.918.229.682.110.435/figure-css-curves-cyclically-loaded-iron-different-densities.webp)
![Figure 3-4- Cyclic stress-strain curves and their monotonic ones for homogeneous Ni-Mo PM steel [10]](https://thumb-eu.123doks.com/thumbv2/123doknet/6428849.170481/43.918.249.663.109.441/figure-cyclic-stress-strain-curves-monotonic-homogeneous-steel.webp)