Distortion products in auditory fMRI
research: Measurements and solutions
The MIT Faculty has made this article openly available.
Please share
how this access benefits you. Your story matters.
Citation
Norman-Haignere, Sam, and McDermott, Josh H. “Distortion
Products in Auditory fMRI Research: Measurements and Solutions.”
NeuroImage 129 (April 2016): 401–413 © 2016 Elsevier
As Published
http://dx.doi.org/10.1016/J.NEUROIMAGE.2016.01.050
Publisher
Elsevier
Version
Author's final manuscript
Citable link
http://hdl.handle.net/1721.1/112184
Terms of Use
Creative Commons Attribution-NonCommercial-NoDerivs License
Distortion Products in Auditory fMRI Research: Measurements
and Solutions
Sam Norman-Haignere1,* and Josh H. McDermott1
1Department of Brain and Cognitive Sciences, MIT
Abstract
Nonlinearities in the cochlea can introduce audio frequencies that are not present in the sound signal entering the ear. Known as distortion products (DPs), these added frequencies complicate the interpretation of auditory experiments. Sound production systems also introduce distortion via nonlinearities, a particular concern for fMRI research because the Sensimetrics earphones widely used for sound presentation are less linear than most high-end audio devices (due to design constraints). Here we describe the acoustic and neural effects of cochlear and earphone distortion in the context of fMRI studies of pitch perception, and discuss how their effects can be minimized with appropriate stimuli and masking noise. The amplitude of cochlear and Sensimetrics earphone DPs were measured for a large collection of harmonic stimuli to assess effects of level, frequency, and waveform amplitude. Cochlear DP amplitudes were highly sensitive to the absolute frequency of the DP, and were most prominent at frequencies below 300 Hz. Cochlear DPs could thus be effectively masked by low-frequency noise, as expected. Earphone DP amplitudes, in contrast, were highly sensitive to both stimulus and DP frequency (due to prominent resonances in the earphone’s transfer function), and their levels grew more rapidly with increasing stimulus level than did cochlear DP amplitudes. As a result, earphone DP amplitudes often exceeded those of cochlear DPs. Using fMRI, we found that earphone DPs had a substantial effect on the response of pitch-sensitive cortical regions. In contrast, cochlear DPs had a small effect on cortical fMRI responses that did not reach statistical significance, consistent with their lower amplitudes. Based on these findings, we designed a set of pitch stimuli optimized for identifying pitch-responsive brain regions using fMRI. These stimuli robustly drive pitch-responsive brain regions while producing minimal cochlear and earphone distortion, and will hopefully aid fMRI researchers in avoiding distortion confounds.
Introduction
Nonlinearities in cochlear mechanics can introduce audio frequencies not present in the sound signal that enters the ear (Goldstein, 1967; Robles et al., 1991; Pressnitzer and Patterson, 2001). These added frequencies are known as distortion products (DPs). DPs complicate the interpretation of auditory experiments because the spectrum of the stimulus
*Corresponding author: MIT, 43 Vassar Street, 46-4141C, Cambridge, MA 02139, svnh@mit.edu.
Publisher's Disclaimer: This is a PDF file of an unedited manuscript that has been accepted for publication. As a service to our
customers we are providing this early version of the manuscript. The manuscript will undergo copyediting, typesetting, and review of
HHS Public Access
Author manuscript
Neuroimage. Author manuscript; available in PMC 2017 April 01.
Published in final edited form as:
Neuroimage. 2016 April 1; 129: 401–413. doi:10.1016/j.neuroimage.2016.01.050.
Author Manuscript
Author Manuscript
Author Manuscript
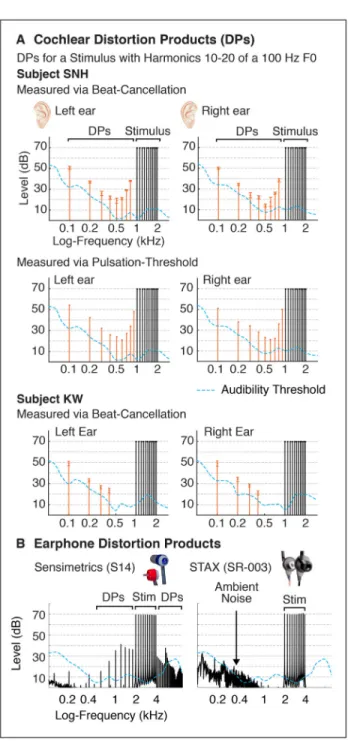
transduced by the cochlea and sent to the brain can differ from that intended by the experimenter (McAlpine, 2004; Bendor and Wang, 2005; Hall and Plack, 2009; de Cheveigné, 2010; Gockel et al., 2011). An example is shown in Figure 1A, which plots the cochlear DPs produced by a stimulus composed of harmonics 10–20 of a 100 Hz
fundamental frequency (F0) (measured psychophysically in both ears of two participants, as described in the Methods). Although the stimulus did not contain any power below the tenth harmonic, audible DPs were present at many lower harmonics of the F0.
Sound system nonlinearities can also produce DPs. This fact is illustrated in Figure 1B, which shows DPs produced by two earphone models that have been used in auditory fMRI experiments: Sensimetrics earphones (model S14) and STAX earphones (SR-003). While STAX earphones produce virtually no measurable DPs at moderate sound levels (e.g. 70–80 dB), Sensimetrics earphones produce substantial DPs at many frequencies. Despite their high distortion levels, Sensimetrics earphones have other desirable properties that have made them standard in auditory neuroimaging research: they are small, MRI-safe, and unlike STAX earphones, provide hearing protection via screw-on earplugs (needed to attenuate scanner noise).
This paper is intended to document the properties of cochlear and Sensimetrics earphone DPs as well as their effects on neural responses, and to provide tools researchers can use to control for their effects. We focus on DPs in the context of pitch perception, where they are of particular importance. The paper is organized into three parts. First, we separately characterize the acoustic properties of cochlear DPs (Experiment I) and earphone DPs (Experiment II) most relevant to neuroimaging studies. Second, we measure the effects of cochlear and earphone DPs on cortical responses as measured by fMRI (Experiments III&IV). Third, using the insights from these experiments, we illustrate how stimuli can be designed to avoid the effects of DPs (Experiment V). FMRI responses to these stimuli can be used to identify cortical “pitch regions”, which respond preferentially to sounds with pitch (Patterson et al., 2002; Penagos et al., 2004; Hall and Plack, 2009; Norman-Haignere et al., 2013). The stimulus set can be downloaded from our website: http://web.mit.edu/ svnh/www/Resolvability/Efficient_Pitch_Localizer.html.
A short synopsis of each experiment is also provided in the Results section, so that the basic logic and design can be understood without referring to the detailed Methods.
Methods
Experiment I: Psychophysical Measurements of Cochlear DP Properties
Background and motivation—Many studies have measured the cochlear distortion products produced by pairs of tones (Plomp, 1965; Goldstein, 1967; Smoorenburg, 1972). By contrast, here we characterize DPs produced by harmonic sounds with many frequency components, like those commonly used in neuroimaging experiments of pitch. Our findings build on prior work by Pressnitzer and Patterson (2001), who also measured DPs produced by harmonic complexes with many frequency components, and we note similarities and differences between our measurements and theirs throughout the Methods and Results sections.
Author Manuscript
Author Manuscript
Author Manuscript
We had three primary goals: (1) to provide useful heuristics for predicting the amplitudes of DPs produced by different harmonic complexes, (2) to provide techniques for minimizing DP amplitudes, and (3) to design noise that can energetically mask all of the DPs produced by a set of stimuli. The use of masking noise to avoid effects of DPs is a standard approach in psychophysical and neuroimaging studies (Licklider, 1954; Houtsma and Smurzynski, 1990; Penagos et al., 2004; Hall and Plack, 2009; Norman-Haignere et al., 2013), but designing effective masking noise requires knowledge of the amplitudes of the DPs produced by a stimulus set.
Beat-cancellation method—The beat-cancellation technique is a well-known
psychophysical method for estimating the amplitude of cochlear DPs (Goldstein, 1967). The essential insight underlying the method is that a DP, like any other audio frequency
component, is a sinusoid. As such, the DP can be cancelled by the addition of another sinusoid with equal amplitude, opposite phase, and the same frequency as the DP. Normally, the effect of this cancellation would be difficult to detect because of the other harmonically related frequencies in the stimulus (Moore et al., 1986). The beat-cancellation method addresses this problem by presenting two different tones in addition to the harmonic complex of interest: one designed to make the DP audible via beating (the “beat tone”, fBEAT) and one designed to cancel the DP (the “cancellation tone”). The beat tone is given a slightly different frequency from the DP being measured (e.g. fBEAT = fDP + 3, in Hz), resulting in amplitude fluctuations, or beating, as the two tones shift in and out of phase. The amplitude of the beat tone is first adjusted by the listener until audible beating can be heard (beating is maximal if two frequencies are equal in amplitude). The cancellation tone is then given the same frequency as the DP being measured, and its phase and amplitude are adjusted by the listener until beating is rendered inaudible. The amplitude of the cancellation tone that eliminates the beating is taken as an estimate of the DP’s amplitude.
We note that the DP amplitudes estimated using this procedure are referenced to the input to the ear. They thus reflect both the amplitude of the DP on the basilar membrane, and the effects of attenuation in the outer/middle ear. These estimates are nonetheless useful in designing stimuli because they provide a measure of the stimulus level that would be needed to produce an equivalent basilar membrane response for each DP.
Because the judgments involved in measuring DPs in this way are subtle, it is generally not possible to employ naïve listeners as subjects. Instead, DPs were measured in both ears of two psychoacoustically experienced listeners (one of whom was the first author), and the results compared with those from the prior literature.
Pulsation-threshold method—We measured cochlear DPs in one listener (author SNH) using a second technique, known as the ‘pulsation-threshold’ method (Smoorenburg, 1974; Shannon and Houtgast, 1980), to ensure that our results were robust to the specific method used. The method entails alternating the DP-producing stimulus with a pure tone of the same frequency as the DP to be measured. When the amplitude of the pure tone equals the amplitude of the DP, they fuse perceptually and are heard as a single continuous frequency without alternation. When the pure tone is weaker than the DP, it is perceived as continuing behind the DP, which is treated as an energetic masker, similar to the classic continuity
Author Manuscript
Author Manuscript
Author Manuscript
illusion produced by the periodic alternation of tones and noise bursts (Warren, 1970; Bregman, 1994). Critically, when the pure tone exceeds the level of the DP, it is perceived as pulsing on and off, since the DP can no longer mask the tone. The maximum pure-tone level at which no pulsation is heard thus provides an estimate of the DP’s level.
The DP-producing stimulus and the pure tone were both pulsed on and off at a rate of 4 Hz with 10 ms linear ramps applied to the onset and offset of each pulse. The listener then adjusted the level of the pure-tone to identify the maximum level without audible pulsation. Dependence on DP frequency and stimulus frequency—We first measured DPs generated by a single stimulus with harmonics 10–20 of a 100 Hz F0, in sine phase (Figure 1A). Each harmonic had equal power, and the overall level summed across all harmonics was 80 dB SPL. Since cochlear DPs are thought to be mostly limited to frequencies below those present in the stimulus (Goldstein, 1967), we measured the amplitude of DPs
generated at lower-numbered harmonics. DPs at harmonics 1–8 were measured in both ears of SNH using both the beat-cancellation and pulsation-threshold methods. DPs at the ninth harmonic were only measured using the pulsation-threshold method, because it was not possible to remove audible beating using the cancellation tone. This could be due to interactions between the cancellation tone and the stimulus (e.g. suppressive effects) which cause the DP’s level to change with the level of the cancellation tone (Shannon and Houtgast, 1980). DPs in KW were measured at the first four harmonics of the F0 using the beat-cancellation method. DPs produced at higher harmonics in KW (the 5th and 6th were tested) were too low in amplitude to produce clear beating and were thus omitted.
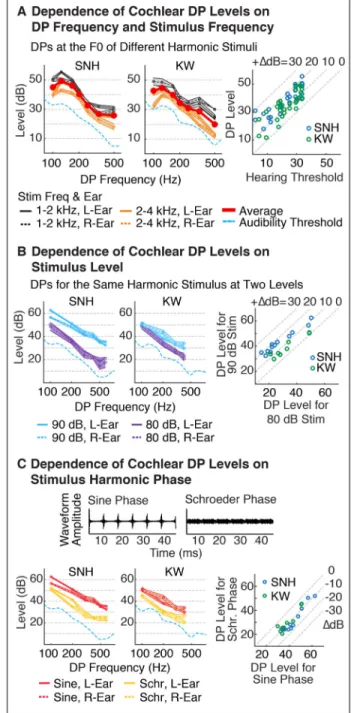
We next measured DPs at the F0 for several different harmonic complexes with different F0s and different frequency ranges (Figure 2A). We focused on F0 DPs, because like Pressnitzer and Patterson (2001), we found they had larger amplitudes than most other harmonics (e.g. see Figure 1A), and because they are particularly relevant to pitch
perception. Each complex had harmonics that spanned either a low (1 – 2 kHz) or high (2 – 4kHz) frequency range. The stimuli had one of the following seven F0s: 100, 125, 167, 200, 250, 333, 500 Hz. All harmonics included in a stimulus had equal power and were added in sine phase. The overall level was fixed at 80 dB SPL. DPs were measured using beat-cancellation.
Dependence on Stimulus Amplitudes—We measured the DPs produced by a harmonic complex presented at 2 different overall sound levels (80 and 90 dB SPL via beat-cancellation) (Figure 2B). The complex included harmonics 10–20 of a 100 Hz F0, and we measured the DPs produced at harmonics 1–6 of the F0 in SNH and at harmonics 1–4 in KW. We focused on DPs generated at these lower harmonics, because they are far from the frequencies present in the stimulus and can thus more substantially alter the excitation pattern on the cochlea.
Dependence on Stimulus Phases—Pressnitzer and Patterson (2001) showed that DP amplitudes can be altered by changing the phase of stimulus harmonics. In particular, they found that “Schroeder phase” harmonics produced lower amplitude DPs than harmonics with a fixed phase (e.g. cosine or sine phase). Here, we sought to replicate and quantify the
Author Manuscript
Author Manuscript
Author Manuscript
magnitude of this reduction. DPs were measured for a stimulus with harmonics 10–20 of a 100 Hz F0 in either sine phase or negative Schroeder phase (via beat-cancellation):
(1)
where θi is the phase in radians of the i-th harmonic in the complex (e.g. for a complex with
harmonics 10–20, i would take values from 1 to 11), and N is the total number of harmonics in the complex. Schroeder phase relations minimize amplitude modulation in the audio waveform by spreading out the phases of the individual harmonics around the unit circle, so as to avoid constructive summation (see Figure 2C). The stimuli were presented at a relatively high level (90 dB SPL) because with the reduction in DP amplitudes caused by Schroeder phase, DPs were close to audibility thresholds for lower levels.
Audibility Thresholds—Audibility thresholds were measured in both ears of subjects SNH and KW using a 3-up, 1-down adaptive procedure. On each trial subjects judged which of two intervals contained a tone. The tone was reduced in level after three correct trials (in-a-row), and increased in level after each incorrect trial. The initial step size for the level changes was 5 dB. After 4 reversals, the step size was reduced to 1 dB and 6 additional reversals were measured. The average level across the last 6 reversals was taken as an estimate of each subject’s audibility threshold.
Headphone calibration—Cochlear DP measurements were made in a double-walled, sound-attenuating booth (Industrial Acoustics). Sounds were presented through Sennheiser HD280 Pro headphones, which we calibrated using a Svantek 979 sound meter attached to a GRAS microphone with an ear and cheek simulator (Type 43-AG). The frequency response of the earphones was measured using pink Gaussian noise and was inverted to present sounds at the desired level. DPs for the HD280 Pro headphones were minimal, and below audibility thresholds at all frequencies tested.
Experiment II: The Acoustic Properties of Sensimetrics Earphone DPs
Background and motivation—Presenting sounds in the context of an MRI experiment involves three challenges: (1) all equipment must be non-ferrous (2) hearing protection is typically needed to attenuate scanner noise and (3) both the earphones and any hearing protection must fit in a narrow space between a subjects’ head and the coils used to detect radio frequency signals. Sensimetrics earphones have become a popular choice for presenting sounds in the MRI scanner because they are small, non-ferrous, and provide hearing protection via screw-on earplugs. However, the piezoelectric material used to shrink the device to a size amenable to modern head coils makes it more susceptible to distortion (based on our correspondence with the manufacturer).
Similar to our experiments testing cochlear DPs, our measurements were intended to provide useful heuristics for minimizing and masking the effects of earphone DPs. For comparison, we also measured DPs produced by a pair of ‘electrostatic’ earphones produced by STAX, which have less distortion. These earphones are no longer in widespread use in fMRI
Author Manuscript
Author Manuscript
Author Manuscript
research because they do not provide hearing protection, and thus must be paired with sound attenuating ear muffs, which often do not fit in modern head coils.
Earphone Calibration and Distortion Measurements—Earphone DP measurements were made from the right earphone of a pair of Sensimetrics earphones (model S14) (Figure 3). We have made similar measurements for several pairs of Sensimetrics earphones and have found their distortion characteristics to be consistent across pairs. DPs were measured across a large battery of harmonic stimuli (each 1 second in duration). The F0s of the complexes varied in semitone steps between 100 and 400 Hz. The frequency range of the harmonic tones in each stimulus spanned an octave (e.g. 1–2 kHz for a stimulus with harmonics 10–20 of a 100 Hz F0), and the lowest harmonic number in the complex varied between 3 and 15 (e.g. 3–6, 4–8, 5–10, etc.). Each complex was presented at six different sound levels (65, 70, 75, 80, 85, and 90 dB SPL), and two different phase relations (sine phase and negative Schroeder phase), yielding a total of 3,900 stimuli. DPs were detected and measured for each stimulus by 1) computing the power spectrum of the waveform recorded by the sound meter and 2) comparing the measured power at each harmonic to the expected power based on either the input signal or the noise floor of the measurements (whichever was largest). Harmonics that exceeded the expected level by 5 dB SPL were considered DPs. DP amplitudes were highly reliable across independent measurements (varying on average by less than 1 dB SPL).
Experiment III: The Cortical Effects of Cochlear and Earphone DPs
Motivation—Our strategy to explore cortical effects of DPs was to measure fMRI
responses to stimuli that are known to evoke a weak cortical response when DPs are masked (details below). If DPs can influence cortical responses, they might produce an increase in the response to such stimuli when masking noise is omitted.
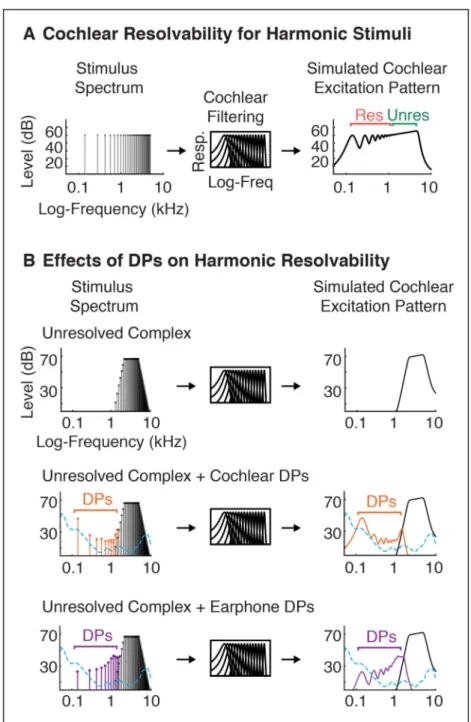
Prior research has revealed cortical regions in humans that respond preferentially to sounds with pitch (Patterson et al., 2002; Penagos et al., 2004; Hall and Plack, 2009; Puschmann et al., 2010; Barker et al., 2013; Norman-Haignere et al., 2013). These regions respond strongly to so-called “resolved” harmonics, which produce detectable peaks in the excitation pattern of the cochlea, and weakly to “unresolved” harmonics, whose frequencies are too closely spaced to produce detectable peaks after cochlear filtering (see Figure 4A for an illustration of resolvability) (Penagos et al., 2004; Norman-Haignere et al., 2013). We utilized the weak response to unresolved harmonics to explore the neural effects of DPs, reasoning that DPs can introduce resolved harmonics not present in the original stimulus (details below), potentially inflating cortical responses to stimuli that would otherwise be completely unresolved.
The distinction between resolved and unresolved harmonics stems from longstanding debates about the mechanisms underlying pitch perception (Goldstein, 1973; Terhardt, 1974; Houtsma and Smurzynski, 1990; Meddis and Hewitt, 1991; Shackleton and Carlyon, 1994; Cariani and Delgutte, 1996). Psychophysically, resolved harmonics produce a more robust pitch percept than unresolved harmonics (Houtsma and Smurzynski, 1990; Shackleton and Carlyon, 1994), consistent with their more robust neural response. This finding has been
Author Manuscript
Author Manuscript
Author Manuscript
taken as evidence for the importance of “spectral” mechanisms that utilize peaks in the cochlear excitation pattern to infer the fundamental frequency of a set of harmonics. Nonetheless, the fact that unresolved harmonics produce a pitch percept at all suggests that “temporal” pitch cues (periodic fluctuations in the amplitude envelope of a set of unresolved harmonics) are sufficient to generate a pitch percept. But because unresolved harmonics can produce DPs that are themselves resolved, it is important to control for DPs in both
psychophysical and neural studies of pitch.
The resolvability of individual harmonics primarily depends on their harmonic number relative to the F0, and not their absolute frequency (Houtsma and Smurzynski, 1990; Shackleton and Carlyon, 1994; Bernstein and Oxenham, 2005). This property is presumed to reflect the scaling of cochlear filter bandwidths with frequency (Glasberg and Moore, 1990). Harmonics are equally spaced on a linear scale, but cochlear filter bandwidths scale with frequency, such that individual harmonics become less resolved on the cochlea with increasing harmonic number. In the absence of DPs, sounds with only high-numbered harmonics (> 10) are believed to not produce detectable peaks in the cochlea’s excitation pattern. However, distortion can reintroduce low-numbered harmonics not present in the original signal, creating resolvable harmonic peaks on the cochlea that would otherwise be absent (Figure 4B).
We tested whether cortical pitch regions respond to resolved harmonics introduced by cochlear or earphone distortion, as might be expected if the DPs produced are sufficiently high in level. We measured responses to resolved and unresolved harmonics in either the presence or absence of noise designed to energetically mask DPs (Figure 5), a common approach for minimizing effects of distortion (Licklider, 1954; Houtsma and Smurzynski, 1990; Penagos et al., 2004; Hall and Plack, 2009; Norman-Haignere et al., 2013). If DPs drive cortical responses, one would expect their presence to increase the response to unresolved harmonics in the absence of masking noise, because the DPs produced in this situation could effectively act as resolved frequency components.
In a follow-up experiment (Experiment IV, described below), we isolated the effects of cochlear DPs by using STAX earphones, which themselves produce little distortion (Figure 1B).
Participants—Eight individuals participated in the experiment (2 male, 6 female, all right-handed, ages 19 to 26, mean age: 23). All subjects completed a single, 2-hour scanning session; 1 subject completed two sessions because not enough runs were collected in the first session. All subjects were non-musicians (with no formal training in the 5 years preceding the scan), native English speakers, and had self-reported normal hearing. All participants gave informed consent.
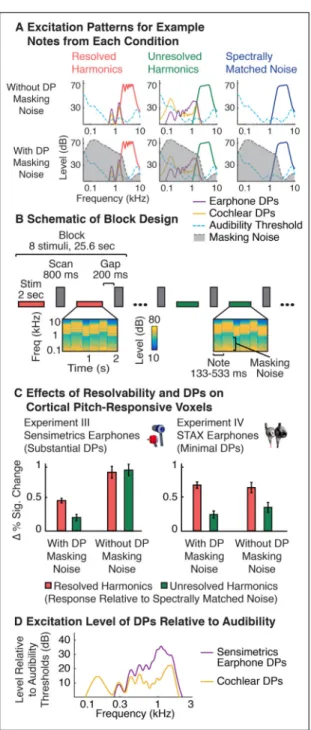
Stimuli—There were 6 stimulus conditions in the experiment, organized as a 3 × 2 factorial design: resolved harmonics, unresolved harmonics and spectrally-matched noise were each presented with and without DP masking noise (Figure 5A). The stimuli were similar to those used in a previous paper from our lab (Norman-Haignere et al. 2013), and all differences are noted below. Stimuli were presented in a block design with 8 stimuli from the same
Author Manuscript
Author Manuscript
Author Manuscript
condition presented successively in each block (Figure 5B). A 1.2 second pause occurred after each stimulus to allow time for a single scan/volume to be collected (“sparse sampling”; Hall et al., 1999). Each stimulus lasted 2 seconds and was composed of 6 different notes.
Stimulus conditions differed in the acoustic composition of individual notes. Resolved harmonic stimuli were composed of notes with low-numbered harmonics, and unresolved stimuli were composed of high-numbered harmonics. The harmonic composition of each note was controlled by bandpass-filtering a harmonic complex tone. The filter passband for resolved and unresolved stimuli spanned harmonics 3–7 and 15–35, respectively. All harmonics within the passband had the same amplitude, and harmonics outside the passband were attenuated according to their distance from the edge of the passband on a
log-frequency scale (75 dB/octave attenuation). We manipulated the harmonic content of each note via filtering – as opposed to including a fixed number of equal-amplitude components, as was done for the distortion measurements – in order to avoid sharp spectral boundaries, which might otherwise provide a weakly resolved spectral pitch cue (Small & Daniloff, 1967; Fastl, 1980). Gradually attenuating harmonics also helps to minimize the importance of higher-amplitude cochlear DPs generated at frequencies near the passband (see Figure 1A), since they remain lower in amplitude than the attenuated stimulus frequencies near the passband. To minimize adaptation, individual notes within a stimulus varied in frequency and duration (see Figure 5B). We have previously shown that such note-to-note variation increases the overall response of pitch regions to both harmonic tones and noise, facilitating their measurement (Norman-Haignere et al., 2013).
All of the conditions had matching frequency ranges. To accomplish this, we used different F0s for the resolved and unresolved stimuli, motivated by prior work showing that F0 differences between resolved and unresolved stimuli cannot explain the higher response to resolved harmonics (Penagos et al., 2004; Norman-Haignere et al., 2013). The mean F0s for resolved and unresolved notes were 700 Hz and 140 Hz, respectively; this 5-fold F0 difference exactly offset the 5-fold difference in the harmonic numbers included, yielding matched frequency ranges (i.e. 700 * [3–7] = 140 * [15–35]). The F0 of the notes in each stimulus varied within a one-octave range centered on the mean for that condition (sampled from a uniform distribution on a logarithmic frequency scale). The same harmonics (3–7 or 15–35) were present in each note, and the frequency range of the notes thus varied along with the F0. The note-to-note change in F0 was constrained to be greater than 3 semitones so that all frequency/pitch changes were clearly audible, and to be less than 9 semitones to avoid unnaturally large jumps in pitch. Noise stimuli were composed of bandpass-filtered Gaussian noise, with filter passbands matched to those of the harmonic stimuli.
Figure 5A shows simulated excitation patterns for an example note from each condition. These excitation patterns were computed from a gammatone filter bank (Slaney, 1998; Ellis, 2009) designed to approximate the filtering that occurs on the basilar membrane of the cochlea. As is evident from the figure, cochlear filtering has the effect of smoothing the frequency spectrum. Because low-numbered harmonics are relatively far apart on the frequency scale of the cochlea, they produce visible peaks in the excitation pattern, and are thus resolved, whereas high-numbered harmonics (and noise) do not produce such peaks.
Author Manuscript
Author Manuscript
Author Manuscript
The level of the noise sounds was set 5 dB higher than the level of the harmonic tones, which approximately equates them in perceived loudness (Norman-Haignere et al., 2013). The absolute/overall volume was individually set to a comfortable level for each subject at the start of the scan: subjects listened to a sample note from each condition presented in a loop and were asked to adjust the overall volume to a ‘loud but comfortable’ level (sound levels ranged from 75 – 88 dB SPL, mean level = 82 dB SPL).
Distortion Product Masking Noise—The excitation pattern of the noise used to mask distortion products is shown in Figure 5A. The spectrum of the noise was designed to be 10 dB higher than the level needed to energetically mask all cochlear and earphone DPs generated at harmonics below those in the stimulus (based on our measurements of cochlear and earphone DPs, and previously established psychophysical thresholds for tone-in-noise detection, Moore et al., 2000). We used pink Gaussian noise (10 dB/octave attenuation) bandpass filtered with a lower-cutoff 6 semitones below the F0 and an upper-cutoff at the 13th harmonic of the F0. The spectrum level of the masking noise at the F0 was 5 dB below the spectrum level of the unresolved harmonics. The noise shifted up and down in frequency in concert with the F0 of each note in order to consistently mask the harmonic DPs
produced. The same masking noise was used for all conditions to ensure that response differences were not due to differences in the acoustics of the noise.
Procedure—Subjects completed between 8 and 12 “runs” per scanning session (each 409.6 seconds), where each run included 1 stimulus block per condition (each 25.6 seconds) and four blocks of silence (each 19.2 seconds) that were evenly spaced throughout the run to provide a baseline. After each run, subjects were given a short break (~30 sec). Subjects performed a “1-back” task (responding whenever successive 2-second stimuli were identical) across stimuli in each block to help them attend consistently to all of the sounds. Each block included 6 unique stimuli and 2 back-to-back repetitions (8 stimuli per block). Data Acquisition, Preprocessing, and Regression Analyses—All data were collected using a 3T Siemens Trio scanner with a 32-channel head coil (at the Athinoula A. Martinos Imaging Center of the McGovern Institute for Brain Research at MIT). T1-weighted structural images were collected for each subject and registered to the functional volumes (1 mm isotropic voxels). Each functional volume comprised 12 slices oriented parallel to the superior temporal plane and covering the portion of the temporal lobe superior to and including the superior temporal sulcus (3200 ms TR, 800 ms TA; the first 5 volumes were discarded to allow for T1 equilibration). Each slice was 4 mm thick and the in-plane slice resolution was 2.1 mm × 2.1 mm with a 96 × 96 matrix (30 ms TE, 90 degree flip angle, 0.4 mm slice gap). iPAT (Griswold et al., 2002) was used to minimize acquisition time (800 milliseconds per volume).
Preprocessing and regression analyses were carried out using FSL 4.1.3 and FMRIB software libraries (Analysis Group, FMRIB, Oxford, UK; Smith et al., 2004). Functional images were motion-corrected, spatially smoothed with a 3 mm FWHM kernel, and high-pass filtered (250 sec cutoff). Each run was fit with a general linear model (GLM) in the native functional space. The GLM included a separate regressor for each stimulus condition (modeled with a gamma hemodynamic response function) and 6 motion regressors (3
Author Manuscript
Author Manuscript
Author Manuscript
rotations and 3 translations). Statistical maps from this within-run analysis were then registered to the anatomical volume using FLIRT (Jenkinson and Smith, 2001) followed by BBRegister (Greve and Fischl, 2009).
ROI Analysis of Pitch-Responsive Regions in Auditory Cortex—We used a region-of-interest (ROI) analysis to probe pitch-responsive voxels. In each subject, we identified pitch-responsive voxels as those with the most significant response preference for harmonic tones over spectrally matched noise, irrespective of whether the tones were resolved or unresolved or whether there was masking noise present. We used this contrast (tones > noise) because it is standard in the field (Patterson et al., 2002; Penagos et al., 2004; Hall and Plack, 2009), and because it is unbiased with respect to the question of interest (whether DPs alter cortical responses to harmonic sounds).
The ROI that was analyzed comprised the top 10% of the voxels in the superior temporal plane when ranked by statistical significance, the same criterion used in our prior work characterizing pitch responses (Norman-Haignere et al., 2013). We used this selection criterion, rather than a fixed significance cutoff, because absolute significance values vary substantially across subjects for reasons unrelated to neural activity (e.g. differences in the amount of head motion; Van Dijk et al., 2012). We then measured the average response of the selected voxels to each stimulus condition, using independent data from that used to select voxels. This analysis was implemented using the same leave-one-run-out design described previously (Norman-Haignere et al., 2013).
Experiment IV: Isolating Cortical Responses to Cochlear DPs using STAX Earphones Motivation—Our findings from Experiment III suggested substantial effects of DPs on the cortical fMRI response, but could not distinguish between effects of DPs introduced by the cochlea, and those introduced by earphones. We thus conducted a similar experiment using earphones with little distortion (STAX earphones, see Figure 1B). These earphones are less commonly used because they do not provide hearing protection for subjects, in contrast with Sensimetrics earphones, which have screw-on earplugs. Using STAX earphones thus required using a quieter scanning sequence (Schmitter et al., 2008; Peelle et al., 2010) that would not pose any risk to subjects’ hearing.
Participants—Eight individuals participated in the experiment (2 male, 6 female, all right-handed, ages 19 to 27, mean age: 23). All subjects were non-musicians (with no formal training in the 5 years preceding the scan), native English speakers, and had self-reported normal hearing. All subjects completed a single, 2-hour scanning session, and gave informed consent.
Stimuli—The design was similar to that of Experiment III, but with a few minor changes described below. There were again 6 conditions in a 3 × 2 design: resolved harmonics, unresolved harmonics, and spectrally matched noise, each presented with and without background masking noise. The filter passbands for the resolved and unresolved notes spanned harmonics 3–6 and 15–30, respectively. The average F0 was 666 Hz for resolved notes and 133 Hz for unresolved notes. The average frequency range of the notes was thus
Author Manuscript
Author Manuscript
Author Manuscript
2–4 kHz. Each stimulus was 2 seconds in duration as in Experiment I, and included 6–12 notes of equal duration that varied in frequency from note to note over a 10-semitone range. The level of the harmonic tones was fixed at 80 dB SPL, and the level of the noise was set 5 dB higher (85 dB SPL) to approximately equate the tones and noise in perceived loudness. Distortion Product Masking Noise—Unlike Experiment III, the noise used to mask DPs did not vary with the F0 of the notes. This choice was motivated by the empirical observation in Experiment I that cochlear DP amplitudes mostly depend on the DP’s absolute frequency (Figure 2A), rather than the harmonic number of the DP or frequency range of the stimulus. Thus, cochlear DPs could be effectively masked using a fixed noise stimulus that had greater power at frequencies with higher DP amplitudes. We do not believe the difference in masking noise used in Experiments III and IV substantially affected the results because cortical responses in the presence of masking noise were similar across the two experiments (Figure 5C).
To create our noise masker, we measured cochlear DPs produced at the first and second harmonic by unresolved complexes with three different F0s (100, 133, and 178 Hz). These measurements gave estimates of DP amplitudes at each of 6 different absolute frequencies (100, 133, 178, 200, 267, and 356 Hz). We interpolated these 6 values to produce an estimated ‘distortion spectrum’, intended to approximate the amplitude of DPs produced at each frequency. For frequencies below 100 Hz, the distortion spectrum was set to the amplitude of the 100 Hz DP (the lowest F0 in the stimulus set), and for frequencies above 356 Hz the distortion spectrum was set to the amplitude of the 356 Hz DP (a conservative choice, since cochlear DPs had lower amplitudes at higher frequencies, see Figure 2A). We then shaped the spectrum of broadband noise (extending from 60 Hz to 8 kHz) so that the excitation level at the output of a gammatone filter (simulating cochlear filtering) was always 15 dB higher than that needed to energetically mask DPs from the distortion spectrum (Moore et al., 2000). DPs were measured for subject SNH in both ears using the beat-cancellation technique. To be conservative, we used the maximum DP across ears to estimate the distortion spectrum. The maximum levels for the six measured DPs were 48 dB (for the DP at 100 Hz), 42 dB (133 Hz), 42 dB (178 Hz), 36 dB (200 Hz), 32 dB (267), and 32 dB (356 Hz).
Procedure—Stimuli were again presented in a sparse, block design. Each block included four, 2-second stimuli. After each stimulus, a single scan was acquired (1.7 seconds), preceded and followed by a 200 ms buffer of silence. The time between scan acquisitions was thus 4.1 seconds, and each block lasted 16.4 seconds. Subjects again performed a 1-back task, detecting a single, 1-back-to-1-back repeat of a stimulus in each block. Blocks were again grouped into runs, with blocks of silence (also 16.4 seconds) interspersed throughout to provide a response baseline in the absence of sound.
Data Acquisition and Analyses—All acquisition parameters and analyses were the same as Experiment III with the exception of the quieter sequence. For the quiet sequence, each functional volume comprised 18 slices, designed to cover the portion of the temporal lobe superior to and including the superior temporal sulcus (4.1 s TR, 1.7 s TA, 45 ms TE, 90 degree flip angle; the first 4 volumes of each run were discarded to allow for T1
Author Manuscript
Author Manuscript
Author Manuscript
equilibration). Voxels were 3 mm isotropic (64 × 64 matrix, 0.6 mm slice gap). The acquisition noise of the scanner had an overall sound level of 75–80 dB SPL (measured using an MRI-compatible microphone), which is at least 10 dB quieter than typical EPI sequences (Peelle et al., 2010). The sequence is quieter because the gradient changes are designed to be sinusoidal (rather than square), producing a narrow-band noise whose frequency can be adjusted to align with troughs in the acoustic transfer function of the scanner (Schmitter et al., 2008).
Experiment V: Designing a Pitch Localizer with Minimal DPs
Motivation—Using the insights from Experiments I–IV, we designed a set of stimuli that produce minimal DPs with Sensimetrics earphones and that can be used to localize pitch-responsive cortical regions (Figure 6). These stimuli were used in a previously published paper that focused on the effect of harmonic resolvability on pitch responses (see the “efficient pitch localizer” described in Norman-Haignere et al., 2013). In the 2013 paper, these localizer stimuli were used to demonstrate significant pitch-responsive voxels in each of 12 individual subjects and to probe the functional anatomy of pitch-responsive regions in four individual subjects, who completed additional runs of the localizer to more robustly measure pitch responses in their individual brain.
In this paper, we report the levels of the cochlear and earphone DPs produced by these stimuli and explain why they minimize cochlear and Sensimetric earphone DPs given the findings from Experiments I&II. We also present the results of a whole-brain ‘group analysis’, which identifies pitch-responsive voxels across a large number of subjects aligned to a fixed anatomical template brain. This analysis was enabled by data from additional subjects scanned since the publication of our 2013 paper (yielding 21 subjects in total). Participants—Twenty-one non-musician subjects (no formal training in the 5 years preceding the scan) participated in the experiment (7 male, 14 female, all right-handed, ages 19 to 27, mean age: 23). Data from a subset of twelve subjects were used in the 2013 paper. All subjects gave informed consent.
Stimuli—We used resolved harmonics because they most effectively drive pitch-responsive regions (Penagos et al., 2004; Norman-Haignere et al., 2013). Perceptually, DPs have relatively little effect on the perception of resolved harmonics, but they can substantially change the frequency spectrum of the stimulus transduced by the ear – making it difficult to match the spectrum of a noise stimulus to that of a harmonic tone complex. We thus sought to minimize the influence of DPs even when using resolved stimuli.
The stimuli were designed in the same way as Experiment IV, but with parameters chosen to minimize DPs. Each note included harmonics 3–6 of the F0 added in Schroeder phase, which reduces the amplitude of cochlear and earphone DPs (Figures 2C&3D), but has little effect on the perception of resolved harmonics (because phase relations are typically not detectable for frequency components that do not interact in the cochlea, as is the case for harmonics that are individually resolved; Houtsma and Smurzynski, 1990). The mean F0 was set to 333 Hz, yielding an average frequency range of 1–2 kHz. This frequency range is near one of the resonances of the earphones (Figure 3A), which we found minimizes
Author Manuscript
Author Manuscript
Author Manuscript
earphone DPs (Figure 3B–C). These F0s also avoid the more substantial cochlear DPs produced at the lower F0s (Figure 2A).
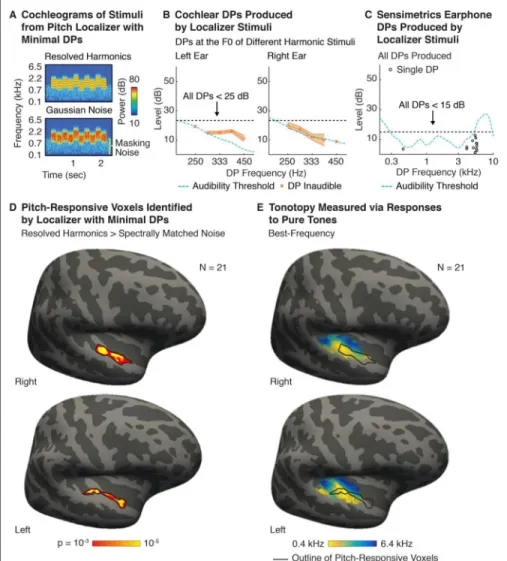
Distortion Product Measurements and Masking Noise—Cochlear DPs were measured at the F0 of five harmonic stimuli that spanned the range of F0s featured in the localizer (250, 289, 333, 385 and 445 Hz). Earphone DPs were measured for 11 harmonic stimuli with different F0s, spaced 1 semitone apart, that again spanned the range of F0s tested (from 250 to 445 Hz). These measurements were used to design masking noise. The spectrum level of the noise was set to ensure that all measured cochlear and earphone DPs were at least 15 dB below the level that would be just detectable (Moore et al., 2000). Below 890 Hz (the maximum possible frequency of the second harmonic), the level of the masking noise was set to mask DPs up to 40 dB SPL (DPs never exceeded 25 dB SPL in this spectral region). Above 890 Hz, the level was set to mask DPs up to 30 dB SPL (DPs never
exceeded 15 dB SPL in this spectral region).
Measuring Cortical Pitch Responses using the Localizer Stimuli—We tested whether our stimuli could effectively localize the pitch-responsive regions described in prior work (Patterson et al., 2002; Penagos et al., 2004; Norman-Haignere et al., 2013). The procedure and analyses were identical to that described in Norman-Haignere et al., 2013, except that we performed a whole-brain, group analysis to identify voxels in a standardized template brain (MNI305 FsAverage template) that are consistently responsive to pitch (aligning data from individual subjects to the template brain). Responses were measured to the harmonic tone and noise stimuli using a sparse, block design, like that described in Experiments III&IV (5 stimuli per block, 3.4 second TR). Seven subjects completed a large number of blocks (39–54 per condition) and fourteen subjects completed a smaller number of blocks (9–18 per condition). This split was motivated by the fact that individual-subject statistics benefit from a large amount of data per subject, while group-level statistics are most sensitive to the number of subjects tested. Here, we focus on group-level statistics, to complement the analyses of individual subjects from our prior work (Norman-Haignere et al., 2013). All of the data was included in the analysis, and we used a weighted least-squares random effects analysis to account for the differences in variance/SNR across subjects, due to variable amounts of data (as implemented by FsFast).
For comparison with the group pitch map, we computed a group tonotopic map, plotting the frequency that best drove each voxel’s response, averaged across all of the subjects tested after alignment to the template. Individual-subject tonotopic maps, measured using the same procedure, are reported in Norman-Haignere et al. (2013). Although the exact anatomical location of each subject’s tonotopic map is variable, the high-low-high gradient in primary auditory cortex is sufficiently stereotyped to be identifiable in a group map (see Figure 6E), providing a useful summary representation. Tonotopy was computed using responses to pure tones of six different frequency ranges (centered on 200, 400, 800, 1600, 3200 and 6400 Hz) (for details, see Norman-Haignere et al., 2013). For each voxel and subject, we measured the frequency that produced the highest response, and averaged this value across the 21 subjects tested (after alignment to a template brain), excluding voxels in each subject that were not
Author Manuscript
Author Manuscript
Author Manuscript
significantly modulated by frequency (p > 0.05 in a 1-way ANOVA across the different frequencies tested).
Results
Experiment I: Cochlear DP Amplitudes
Figure 1A shows cochlear DPs produced by a stimulus with high-numbered harmonics (10– 20) of a low-frequency F0 (100 Hz). In subject SNH, an audible DP was generated at each lower harmonic not present in the stimulus. DPs measured using the beat-cancellation and pulsation-threshold method yielded a similar pattern: for harmonics below the 7th, the amplitude of DPs rose with decreasing frequency/harmonic number (similar to the results of Pressnitzer and Patterson, 2001). This rise in level at low frequencies was also evident in the DPs measured by subject KW. DP levels were also high at frequencies near those in the stimulus, likely due to the influence of so-called “cubic” DPs (which have been extensively characterized by measuring DPs for pairs of tones, see Discussion). Here, we focused on DPs generated at or below the 6th harmonic because these can more substantially change the overall excitation pattern in the cochlea and are more likely to influence listeners’ perception of pitch (for the range of F0s tested in this study; Moore et al., 1985).
Notably, the rise we observed in DP amplitudes at low frequencies appeared to track the rise in pure tone detection thresholds below 500 Hz (Figure 1A), similar to the results of
Pressnitzer and Patterson (2001). This finding could be related to effects of middle-ear attenuation at low frequencies (Moore et al., 1997): because DPs generated in the cochlea are not subject to middle-ear attenuation, one might expect their level relative to an externally produced stimulus to grow with increasing middle-ear attenuation, because more stimulus power is needed to produce an equivalent cochlear response. Thus greater middle-ear attenuation at low frequencies could produce both higher audibility thresholds and higher measured DP levels. However, for any single harmonic complex, a rise in DP levels at low frequencies could in principle reflect an effect of harmonic number rather than absolute frequency. To address this possibility, we measured DPs produced at the F0 for a range of different harmonic complexes (Figure 2A). Each stimulus included harmonics within one of two fixed frequency ranges (1–2 and 2–4 kHz), and the F0 varied across stimuli (the overall stimulus level was fixed at 80 dB SPL). In both subjects tested, we observed a similar rise in DP levels at low frequencies, even though the DP was always at the F0 (i.e. the first harmonic). This finding suggests that the level of DPs far from the stimulus primarily depends on the frequency being measured, rather than the DP’s harmonic number relative to the F0. The rise in DP amplitudes we observed at low frequencies paralleled audibility thresholds (Figure 2A), consistent with the hypothesis that DP amplitudes are linked to audibility thresholds due to the effects of middle-ear attenuation. There was also a small but significant effect of stimulus frequency range (p < 0.001 in both subjects via a paired t-test), with larger DPs on average for lower-frequency stimuli (the average difference in level was 6 dB for SNH and 9 dB for KW). The effect of stimulus frequency was nonetheless much smaller than the effect of DP frequency, which produced a ~25 dB drop in level between 125 and 500 Hz in both subjects.
Author Manuscript
Author Manuscript
Author Manuscript
We next measured the DPs produced by a single stimulus presented at two different sound levels (80 and 90 dB SPL) (Figure 2B). On average, DPs produced by the 90 dB stimulus were 12 dB higher than those produced by the 80 dB stimulus. However, the size of this effect differed somewhat depending on the subject and frequency tested (varying between 2 and 21 dB across all DPs tested). In both subjects, DPs at higher frequencies tended to be the most sensitive to changes in stimulus level, producing a significant correlation between the effect of stimulus level and absolute frequency (r > 0.73 and p < 0.05 in both subjects tested).
Finally, we measured the effect of harmonic phase relationships that alter the shape of the stimulus waveform. Figure 2C shows waveforms for harmonics 10–20 of a 100 Hz F0 added in either sine phase – which produces a waveform with prominent peaks – or ‘negative Schroeder’ phase – which minimizes waveform peaks (Schroeder, 1970). Consistent with the results of Pressnitzer and Patterson (2001), we found that adding harmonics in Schroeder phase reduced DP amplitudes (Figure 2C). DPs produced by Schroeder phase harmonics were on average 10 dB lower than DPs produced by sine phase harmonics (12 dB lower in SNH and 8 dB lower in KW).
Collectively these results suggest the following properties of cochlear DPs: (1) for a fixed sound level, the amplitude of low-frequency cochlear DPs depends primarily on the frequency of the DP (likely because of the frequency-dependence of audibility), (2)
increases in sound level produce increases in DP level, but these increases depend somewhat on DP frequency, and (3) DP levels can be minimized by adjusting the phase of stimulus harmonics (e.g. using Schroeder phase harmonics).
Experiment II: The Acoustic Properties of Earphone DPs
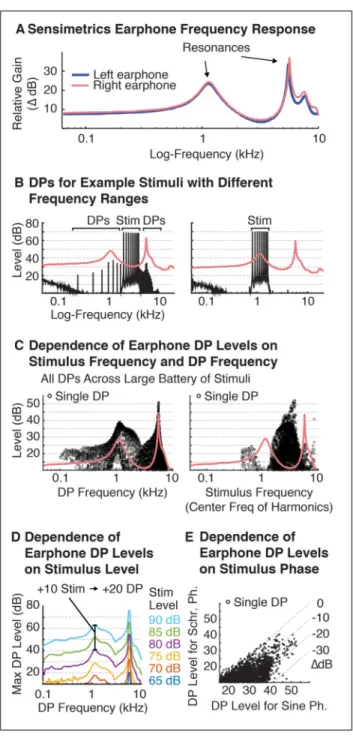
Figure 3A shows the frequency response of Sensimetrics earphones, which has two prominent resonances at ~1.1 and ~5.5 kHz. We found these resonances had two important effects. First, stimuli far from the earphone resonances tended to produce larger DPs. An example of this effect is shown in Figure 3B, which plots the DPs produced by harmonics far from (2–4 kHz) or near to an earphone resonance (0.8–1.6 kHz). The effect presumably reflects the fact that the inverse of the earphone transfer function must be applied to stimuli before delivery through the earphones. Thus, to achieve uniform output levels, the input level at frequencies far from the resonance must be higher than the input level at frequencies close to a resonance. If earphone DPs grow with input level (as seems to be the case), one would expect larger DPs at frequencies far from the resonances. Second, because the DPs produced are themselves subject to resonances in the earphone transfer function, DPs near earphone resonances tended to have higher amplitudes. These two trends are summarized in Figure 3C, which plots DP levels across a large battery of stimuli as a function of either the frequency of the DP (left) or the center-frequency of the stimulus that produced it (right). Figure 3D shows the maximum DP produced at each frequency across the battery of harmonic stimuli tested, as a function of stimulus level. This analysis revealed that Sensimetrics earphone DPs were highly sensitive to stimulus level: a 10 dB increase in stimulus level reliably lead to a 20 dB increase in DP amplitude. Thus, Sensimetrics earphone DPs are on average much more sensitive to absolute stimulus levels than are
Author Manuscript
Author Manuscript
Author Manuscript
cochlear DPs, for which a 10 dB stimulus increment increased DP amplitudes by an average of only 12 dB.
Finally, we hypothesized that earphone DPs might be caused by compression of high waveform amplitudes. If this were the case, earphone DP amplitudes, like those of cochlear DPs, could be reduced using harmonics in Schroeder phase, which reduces the waveform crest factor (Schroeder, 1970). Consistent with this hypothesis, Schroeder phase relations reduced DP amplitudes relative to sine phase harmonics. The magnitude of this reduction was somewhat variable across stimuli (SD=6.5 dB) for reasons that remain unclear to us (the variation was replicable and thus does not reflect measurement error). However, on average, DPs for Schroeder phase stimuli were 10 dB lower than that for sine phase stimuli (Figure 3E), similar to the effect of Schroeder phase on cochlear DP amplitudes.
Collectively, these results show that earphone DPs can be minimized by: (1) using stimuli with frequencies nearby an earphone resonance (e.g. near 1 kHz), (2) using lower sound levels, and (3) using stimuli with flatter waveforms.
Experiment III–IV: The Cortical Effects of Cochlear and Earphone DPs
To test for possible effects of DPs on fMRI responses, we measured the response of cortical regions that respond to pitch, which are known to respond preferentially to sounds with spectrally ‘resolvable’ harmonics (Penagos et al., 2004; Norman-Haignere et al., 2013), the primary cue for human pitch perception (Houtsma and Smurzynski, 1990; Shackleton and Carlyon, 1994). Harmonic resolvability primarily depends on the harmonic number relative to the F0, with lower harmonic numbers better resolved (Shackleton and Carlyon, 1994; Bernstein and Oxenham, 2005) (see Figure 4A). Notably, DPs at low-numbered harmonics can create resolvable frequencies not present in the stimulus (Figure 4B), potentially inflating cortical responses to stimuli intended to contain exclusively unresolved harmonics. We tested this possibility by measuring the response of cortical “pitch regions” to resolved harmonics, unresolved harmonics and spectrally-matched noise, either with or without background noise designed to energetically mask both cochlear and earphone DPs (see Figure 5A–B). If DPs only minimally influence cortical responses, then we should observe a response preference for resolved harmonics compared with unresolved harmonics (Penagos et al., 2004; Norman-Haignere et al., 2013), irrespective of DP masking noise. In contrast, if DPs drive cortical responses, the response to unresolved stimuli should be inflated by the presence of DPs in the absence of masking noise. Because Sensimetrics earphones were used in Experiment III, the cortical responses measured in this experiment could reflect the influence of cochlear or earphone DPs. To isolate the role of cochlear DPs, we subsequently conducted an additional experiment (Experiment IV) using STAX earphones, which have minimal distortion (Figure 1B).
Figure 5C plots the response of pitch-responsive voxels relative to spectrally-matched noise, a contrast standardly used to assess pitch responses (Patterson et al., 2002; Penagos et al., 2004; Hall and Plack, 2009; Norman-Haignere et al., 2013). In the presence of DP masking noise, the response to resolved harmonics was substantially larger than the response to unresolved harmonics in both Experiment III (t(7) = 5.72, p < 0.001) and Experiment IV (t(7) = 6.85, p < 0.001), replicating prior reports (Penagos et al., 2004; Norman-Haignere et
Author Manuscript
Author Manuscript
Author Manuscript
al., 2013). Without DP masking noise, however, responses to resolved and unresolved harmonics delivered via Sensimetrics earphones were similar (t(7) = 0.40, p = 0.70; Experiment III), producing an interaction between the effects of harmonic resolvability and masking noise (F(1,7) = 18.32, p < 0.01). This effect was specific to Sensimetrics
earphones: the effect of masking noise was much less pronounced with STAX earphones (Experiment IV) and we observed a significant response preference for resolved harmonics, even in the absence of noise (t(7) = 3.21, p < 0.05), with no significant interaction between resolvability and masking noise (F(1,7) = 1.39, p = 0.28). Given that cochlear DPs were present in both experiments, these findings suggest that 1) earphone DPs were the primary cause of the inflated responses to unresolved harmonics in Experiment III, and 2) cochlear DPs by themselves had a minimal effect on cortical responses. The larger effect of earphone DPs (compared to cochlear DPs) is plausibly explained by their higher amplitudes relative to listeners’ audibility thresholds (Figure 5D). Earphone DPs could also explain the greater responses we observed for resolved harmonics without masking noise in Experiment III, since they result in sound energy at frequencies that would otherwise be absent from the stimulus. This added sound energy could drive neural responses without necessarily altering the clarity of listeners’ pitch percept (since the stimulus already contains resolved
harmonics).
We note that in both Experiments III & IV, there was a significantly greater response to unresolved harmonics compared with spectrally matched noise, even when using STAX earphones (Experiment IV), which produce minimal DPs, and DP masking noise (t(7) = 5.02, p < 0.01). This finding replicates prior reports showing that even pitch stimuli without any resolved harmonics produce an enhanced neural response in pitch-responsive cortical regions (Penagos et al., 2004; Hall and Plack, 2009; Norman-Haignere et al., 2013). This response enhancement for unresolved harmonics is nonetheless much weaker than that observed for resolved harmonics, consistent with their weaker pitch percept.
Experiment V: Designing a Pitch Localizer with Minimal DPs
Although STAX earphones produce minimal distortion, they do not provide hearing
protection and thus cannot be used with standard imaging sequences (a quieter sequence had to be used in Experiment IV). We thus designed a stimulus set that produces minimal distortion even with Sensimetrics earphones and that can be used to identify
pitch-responsive regions (Figure 6). This stimulus set was tested in a smaller number of subjects in an earlier publication (Norman-Haignere et al., 2013); here we analyze its distortion characteristics and present a group analysis across a larger set of subjects.
The stimulus set consisted of resolvable harmonics and spectrally matched Gaussian noise (cochleograms of example stimuli are shown in Figure 6A). To minimize earphone DPs, we (1) used stimuli with frequencies near the 1 kHz resonance of the earphones (2) added harmonics in Schroeder phase and (3) presented sounds at a moderate sound level (75 dB SPL). Cochlear DPs were also minimized by using Schroeder phase, and avoiding F0s with very low frequencies (all F0s were above 250 Hz). The level of both cochlear and earphone DPs were minimal for all frequencies tested, never exceeding 25 and 15 dB, respectively (Figure 6B&C). As a result, all DPs could be easily masked with a fixed noise of modest
Author Manuscript
Author Manuscript
Author Manuscript
level (visible in the cochleograms of example stimuli in Figure 6A). Figure 6D shows these stimuli effectively identify pitch-responsive voxels across a large cohort of 21 subjects (aligned to a template brain), in both the left and right hemisphere (harmonic tones > spectrally-matched noise; voxel threshold p < 0.001, cluster-corrected to p < 0.05).
Consistent with prior reports (Patterson et al., 2002; Penagos et al., 2004; Norman-Haignere et al., 2013), pitch-responsive voxels overlapped the low-frequency area of primary auditory cortex (Figure 6E) (near lateral Heschl’s gyrus) and extended into non-primary regions anterior to tonotopic cortex. An earlier paper demonstrated that this localizer also has sufficient power to reliably identify pitch-responsive voxels within individual subjects (Norman-Haignere et al., 2013).
Discussion
Our results characterize several properties of distortion products that are relevant to auditory neuroimaging. For stimuli presented at a moderate sound level (e.g. 80 dB), audible DPs are generated at a range of frequencies by the nonlinearities in the cochlea (i.e. level-dependent amplification) as well as the Sensimetric earphones commonly used to present sounds in the scanner. Earphone DPs had particularly high amplitudes relative to listeners’ audibility thresholds and had a substantial effect on cortical fMRI responses when not masked. By contrast, the effects of cochlear DPs on cortical fMRI responses were modest and did not reach statistical significance. Fortunately, cochlear and earphone DPs had stereotyped properties that could be used to minimize their effects on cortical fMRI responses via appropriate stimulus design and the use of masking noise.
Acoustic Properties of Earphone Distortion Products
Sensimetrics earphones have grown in popularity because they are well suited to modern scanning environments. Yet in our experience, many auditory researchers are unaware of the substantial distortion they can produce, and the manufacturers provide little relevant
information. At present, we are unaware of alternative earphones that have substantially better distortion levels without sacrificing the attractive properties of Sensimetrics
earphones. STAX earphones, while small, do not provide hearing protection, and earmuffs, which in principle could be placed around the earphones, typically do not fit inside modern head coils. We have found that Nordic Neurolab earphones, which are also small and hearing-protective, exhibit similarly high levels of distortion (data not shown). Thus at present, careful stimulus design is needed to avoid earphone distortion in auditory neuroimaging experiments.
One practically important finding is that earphone distortion amplitude is highly sensitive to stimulus level. Regardless of the specific stimulus tested, decreasing stimulus levels by 10 dB lowered DP levels by 20 dB. Thus, decreasing stimulus levels will almost always result in lower absolute and stimulus-relative distortion levels. Figure 3D provides an estimate for the maximum DP level likely to be produced at different frequencies as a function of the overall stimulus level. We have found these distortion levels to be relatively stable across different pairs of earphones, and these measurements may be useful in choosing appropriate stimulus levels for experiments.
Author Manuscript
Author Manuscript
Author Manuscript
Our second finding is that the earphone frequency response, which for Sensimetrics earphones has two prominent resonances, is critical to predicting and minimizing DP levels. Stimuli with frequencies far from earphone resonances produce the largest DPs, likely because more gain is needed to produce a desired sound level. DP amplitudes also depend on the frequency of the DP produced because the DPs are themselves affected by the earphone resonances. As a consequence, DPs are largest for stimulus frequencies far from the earphone resonances and DP frequencies near the resonances. Band-limited stimuli between 2–4 kHz, like those used in Experiment IV, thus typically produce the largest DPs, since those frequencies fall between the two prominent resonances, and the DPs produced at higher and lower frequencies fall near the resonances. By contrast, stimuli with power concentrated near 1 kHz, like those in Experiment V, produce minimal DPs, since this is near the lower earphone resonance, and the DPs produced tend to fall outside of the earphone resonances.
Our third finding is that stimuli with harmonics in sine phase produced larger earphone DPs than stimuli with harmonics in Schroeder phase, presumably because Schroeder phase minimizes peaks in the waveform envelope. Thus for stimuli with many harmonics it can be useful to use Schroeder phase harmonics.
Acoustic Properties of Cochlear Distortion Products
Most prior work characterizing cochlear DPs has focused on the DPs produced by pairs of tones (Plomp, 1965; Goldstein, 1967; Smoorenburg, 1972). This work has converged on the idea that for pairs of tones, fh and fl, two primary types of DPs are produced: a “quadratic” DP at the difference frequency (fh − fl), and a “cubic” DP at the frequency fl − (fh − fl) (often written as 2*fl − fh). For tone pairs, cubic DPs typically have the highest amplitude and thus have been the focus of much prior work. They are highly dependent on the frequency ratio between the tone pair, and are typically largest for tone pairs that fall within a cochlear filter bandwidth (Goldstein, 1967). Quadratic DPs, by contrast, are typically low in amplitude for pairs of tones. However, for a tone with many consecutive harmonics, the constructive summation of quadratic DPs produced by all tone pairs can produce substantial DPs at frequencies far from the stimulus (Pressnitzer and Patterson, 2001).
Our results are broadly consistent with those of Pressnitzer and Patterson (2001) who demonstrated (1) audible DPs at harmonics far from those in the stimulus for complex tones with many harmonics and (2) substantial effects of harmonic phase on DP amplitudes. Pressnitzer and Patterson (2001) also showed that for a fixed harmonic complex, the DPs produced tend to follow the shape of audibility thresholds at low frequencies. Our findings demonstrate that this result is not an effect of harmonic number, and is true across a range of different harmonic complexes with fixed sound level. This finding is of practical utility because it means that a single fixed noise stimulus can often be used to mask DPs across a range of stimuli. Our results additionally extend prior work by (1) showing that the effect of stimulus level on DPs is frequency-dependent and somewhat variable between listeners, and (2) quantifying the effect of Schroeder phase, which tended to reduce cochlear DP
amplitudes by approximately 10 dB relative to same-phase harmonics (e.g. all harmonics in sine phase).
Author Manuscript
Author Manuscript
Author Manuscript
We note that a limitation of our study is the small number of subjects from whom we measured cochlear DPs. In practice, measuring cochlear DPs (using psychophysical
methods, e.g. beat-cancellation) requires a substantial amount of training and time from each subject, making it impractical to measure DPs from large numbers of non-expert subjects. Consistent with prior reports (e.g. Pressnitzer and Patterson, 2001), the absolute level of cochlear DPs varied somewhat across our two subjects. However, the qualitative properties of cochlear DP amplitudes – their relation to audibility thresholds, their dependence on harmonic phase, and their reduction at lower stimulus levels – were consistent across the two subjects tested.
The neural effects of DPs that we observed were based on a larger set of eight subjects. We note that it is not obvious how to account for the observed neural effects without positing that cochlear DPs have lower amplitude than earphone DPs (consistent with our
psychophysical/acoustic measurements). In Experiment III (using Sensimetrics earphones, with substantial distortion), we observed a substantial effect of DP masking noise on cortical responses, and in Experiment IV (using STAX earphones, with minimal distortion), almost no effect. Cochlear DPs were present in both experiments, and if they were prominent, we would have expected to observe an effect of masking noise in both experiments. Our fMRI measurements are thus qualitatively consistent with the behavioral measurements in the two subjects we tested.
Pitch-Responsive Cortical Regions
Our findings add to a growing a literature demonstrating pitch-responsive cortical regions (Patterson et al., 2002; Krumbholz et al., 2003; Gutschalk et al., 2004; Chait et al., 2006; Hall and Plack, 2009; Barker et al., 2011, 2012, 2013) whose response is driven primarily by resolved harmonics (Penagos et al., 2004; Norman-Haignere et al., 2013). Our method for localizing these regions, like those employed by most labs working in this area, contrasts responses to sounds with and without pitch, such as harmonic tones and spectrally matched noise. It is important to note that this contrast leaves open the question of what information the identified regions code about fine-grained spectral structure, and in particular whether they code the fundamental frequency of harmonic tones (Bendor and Wang, 2005). Such coding could be investigated using alternative methods such as fMRI adaptation or multi-voxel pattern analysis, which can detect finer-grained differences in neural tuning; these methods will undoubtedly complement ROI-based methods going forward.
What do the present results imply for research on the neural basis of pitch? Although many early neuroimaging studies measured responses to pitch in the absence of masking noise (e.g. Griffiths et al., 1998; Patterson et al., 2002; Krumbholz et al., 2003; Hall et al., 2005), the headphones used were typically large (possible because of the larger head coils being used at the time) and had low distortion levels (Palmer et al., 1998). Our results suggest that the effect of DPs on responses measured in these early studies was likely modest, since the earphones used had low distortion levels, and we found that cochlear DPs have only a small effect on cortical responses measured with fMRI. Nonetheless, DP amplitudes depend somewhat on the acoustic properties of the particular stimuli tested (Figure 2), and there is no guarantee that their effect on cortical responses will always be minimal. Thus, care must