HAL Id: hal-03096222
https://hal.archives-ouvertes.fr/hal-03096222
Submitted on 4 Jan 2021HAL is a multi-disciplinary open access archive for the deposit and dissemination of sci-entific research documents, whether they are pub-lished or not. The documents may come from teaching and research institutions in France or abroad, or from public or private research centers.
L’archive ouverte pluridisciplinaire HAL, est destinée au dépôt et à la diffusion de documents scientifiques de niveau recherche, publiés ou non, émanant des établissements d’enseignement et de recherche français ou étrangers, des laboratoires publics ou privés.
Kinetics of liquid metal infiltration in TiC-SiC or SiC
porous compacts
Jérôme Roger, M. Salles
To cite this version:
Jérôme Roger, M. Salles. Kinetics of liquid metal infiltration in TiC-SiC or SiC porous compacts. Journal of Alloys and Compounds, Elsevier, 2020, pp.158453. �10.1016/j.jallcom.2020.158453�. �hal-03096222�
1
Kinetics of liquid metal infiltration in TiC-SiC or SiC porous compacts
J. Roger a,*, M. Sallesa
a Université de Bordeaux, CNRS, Laboratoire des Composites ThermoStructuraux,
UMR 5801, 33600 Pessac, France * Corresponding author: e-mail: [email protected]
Abstract
TiSi2/SiC composites are promising materials for high temperature applications. The synthesis
of these composites by metal infiltration is an interesting method that is not still mastered. This study aims at identifying the thermodynamic and kinetic processes involved during the synthesis of TiSi2/SiC composites by capillary infiltration of liquid silicon or Si-Ti molten
alloys in porous compacts. Three cases were examined to produce dense TiSi2/SiC materials:
1) the infiltration of molten TiSi2 in pure SiC compacts at 1550°C, 2) the reactive infiltration
of the molten eutectic Ti0.16Si0.84 alloy in SiC+TiC compacts at 1380°C, and 3) the reactive
infiltration of pure liquid silicon in SiC+TiC compacts at 1450°C. The effect of a TiC excess was considered for each reactive case. The infiltration kinetics and the filling percentage were measured from the monitoring of the weight gain increase. The decisive role played by thermodynamics on the infiltration progress is confirmed. It induces the dissolution and diffusion of Ti atoms from TiC which results in the presence of free silicon in the infiltrated areas. Excess content of TiC is not found favorable to the infiltration. This original study based on thermodynamic calculations and kinetic measurements at high temperatures provides decisive results for a complete understanding and improvements of the examined processes.
Keywords: A Ceramics; A Composite materials; B Liquid-solid reactions; C Diffusion; C Phase diagrams; C Microstructure
2 1. Introduction
Natural infiltration of molten metal into ceramic preforms without external pressure is an efficient process in the fabrication of composites [1]. This can be a solution to the availability of improved materials for application in extremely hostile environmental conditions [2-4]. Of the many materials researched and developed, recent interest has been focused on SiC ceramic-reinforced metal-matrix composites. SiC composites are valued for their low density, high strength, high thermal expansion, and chemical stability. In view of these physical and chemical advantages, SiC ceramics are widely used in machinery manufacturing, aerospace, chemical equipment, electronic devices and other fields [5-7]. In particular, ceramic matrix composite (CMC) materials combine silicon carbide ceramics are poised to replace metal alloy components in the hottest parts of turbine engines [2,3]. However, it is known from many experimental studies of such composites that, the infiltration of high melting point metals such as nickel and titanium is possible but the reactivity of these metals with SiC makes them unusable at high temperatures [8,9]. Liquid Silicon Infiltration process (LSI) is also developed to produce SiC-based composites and to realize near-net formed ceramic components but the use of these materials is limited to the melting temperature of silicon (1410°C) [10-13]. Another solution to increase the performances consists in the association of SiC with another ceramic phase. On this way, TiSi2 is very attractive for high temperature applications. Indeed, this
compound exhibits a congruent melting at high temperature (1500°C), a low density (4.08 g.cm
-3), a high modulus at room temperature (255.6 GPa) and excellent oxidation resistance [14,15].
Moreover, it is in equilibrium with SiC up to 1462°C, putting it to use in a wide variety of applications such as components for advanced propulsion systems, energy conversion devices, and other high-temperature structures [16,17,18]. Few data on this topic are available in literature. For example, it can be mentioned the synthesis of composites with a (Mo,Ti)Si2-SiC
matrix by infiltration of alloyed melts of Si, Ti and MoSi2 in more or less porous carbon
preforms [19,20]. But the mechanisms and their kinetics were not considered. The development of this process requires a better knowledge and a thorough understanding of the limitations due
3
to the thermodynamic and kinetic processes involved. In a previous article, we examined the possibility to synthesize SiC-TiSi2 composites by capillary infiltration for three main different
chemical configurations: two reactive cases (TiC+SiC/Ti,SiLiquid) and one “unreactive” case
(SiC/TiSi2,Liquid) [21]. From this first work, it was shown that the synthesis of this kind of
material by infiltration at elevated temperature is mainly controlled by the reactivity. The aim of this additional study is to provide significant information about the kinetics of the capillary infiltration at the working temperature by regulated put in touch of molten silicon or Si-Ti alloys with SiC-TiC or SiC porous compacts. These compacts are similar to the samples of our previous study. The infiltration progression of the liquids into each compact was monitored in situ by the measurement of the weight gain versus time. From these results, it is expected to determine the limiting thermodynamic, and kinetic phenomena and finally to identify the most promising way.
2. Experimental
2.1 Thermodynamic assessments of the Ti-Si-C system
This work was based on thermodynamic calculations using Thermo-Calc software [22] and the thermodynamic description reported by Y. Du et al. [23] to identify the configurations likely to form SiC/TiSi2 composites. The aim was to obtain a composite with an isovolumic fraction of
SiC and TiSi2. The corresponding composition is indicated by a black 5-pointed star on the
calculated Ti-Si-C phase diagram at 25°C (Figure 1-a)). From the Ti-Si phase diagram shown in Figure 1-b), three liquids were considered for the infiltration. These liquids are obtained from the melting of pure Si (Tmelting = 1410°C), the eutectic alloy Ti0.16Si0.84 (Tmelting = 1330°C) and
TiSi2 (Tmelting = 1500°C).
2.2 Materials and experimental procedures
4
Compacts were prepared from commercial α-SiC or β-SiC powders (d50 = 2 µm, 99.8% purity,
Alfa Aesar GmbH & Co KG, Germany) and TiC powder (d50 = 2 µm, 99.5% purity, Alfa Aesar
GmbH & Co KG, Germany). Liquids were obtained from melting of TiSi2 powder (d50 = 44
µm, 99.5% purity, Alfa Aesar GmbH & Co KG, Germany); TiSi2 powder + silicon powder
(eutectic alloy) (d50 = 44 µm, 99.999% purity, Alfa Aesar GmbH & Co KG, Germany) and
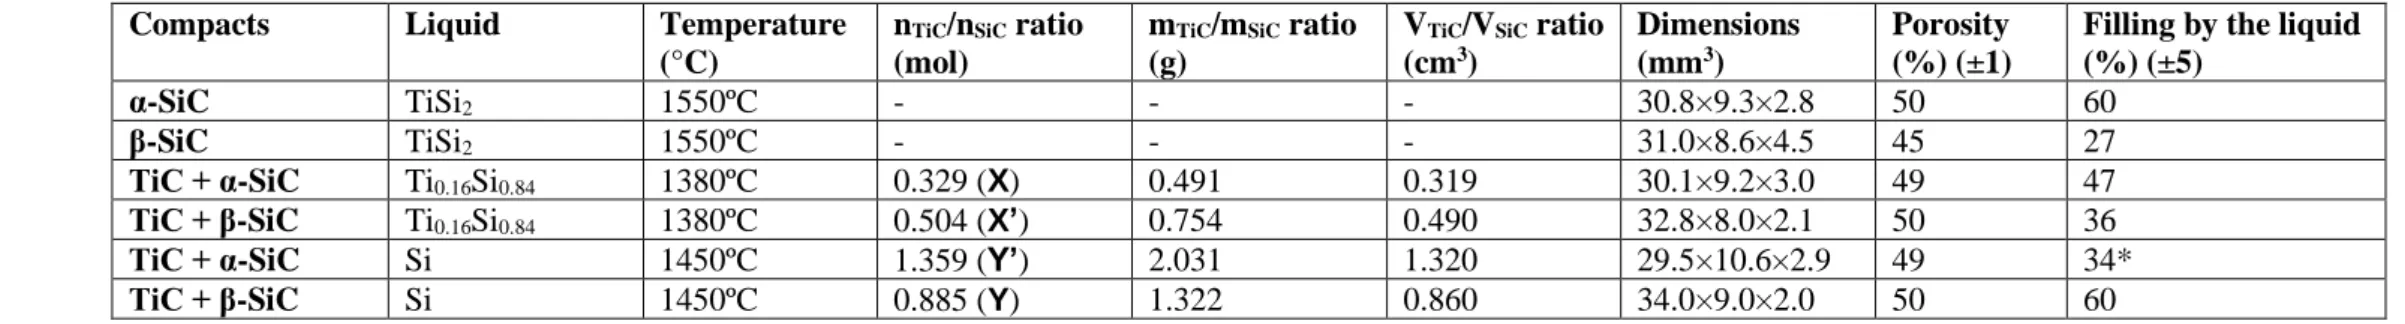
silicon chips (1-3 mm, 99.9999%, Strem Chemicals, Inc., Germany). Pure SiC powders and SiC+TiC powders mixtures were used for the preparation of porous SiC and TiC-SiC compacts, respectively. To fill totally the porosity of the compacts, of about 50%, after infiltration of the Ti0.16Si0.86 and pure Si liquids, the SiC/TiC ratios in the compacts were adjusted and these
compositions are respectively called X and Y (Table 1). Two other related compositions with an excess of TiC called X’ and Y’ (Table 1) were also considered. Mixed TiC and SiC powders were blended in a mixture of alcohol (50 vol%) and water (50 vol%). After drying, all powders were uniaxially cold pressed into rectangular compacts at 100 MPa using a stainless-steel die with an addition of 1 cm3 of commercial ethanol. Then, after drying in the atmosphere for 12
h, the green compacts were presintered at 1500°C for 1 h under high vacuum (2.10-4 mbar) to
obtain strengthened porous ceramics. Details characteristics of the six samples of this study are given in Table 1. Pore-size distributions of each type of sample were obtained from mercury intrusion porosimetry (Autopore IV, Micromeritics Instrument Corp., USA) for similar samples with volumes close to 1 cm3. The porosity ε of the samples was calculated by applying the
formula 𝜀 = 1 −𝑑𝑎
𝑑𝑡 with the apparent density 𝑑𝑎 obtained from mercury intrusion porosimetry
and the true density 𝑑𝑡 measured from helium pycnometry (AccuPyc 1340, Micromeritics
Instrument Corp., USA). The pore size distributions of the consolidated compacts are shown in Figure 2. The pore size distribution of the porous compacts presents a single peak with a narrow width, signifying a uniform pore size distribution centered on 0.35-0.46 (pure SiC) and 0.51 µm (SiC+TiC mixtures). The dimensions and the porosity percentage of all compacts are given in Table 1.
5
The setup of the infiltration experiments is schematically represented in Figure 3-a). For each test, the graphite crucible was either spray-coated with a protective boron nitride (BN) layer for pure-silicon liquid or protected by an alumina coating for the Ti-Si alloys. Each compact was drilled at the top to be held with a graphite hanger and a SCS-6TM fiber. This assembling is
suspended to an analytical balance with a resolution of 0.3µg (ANR DS1070, Setaram Instrumentation, France) to numerically record the weight variation every second. The heat treatments for the capillary infiltration experiments were performed at 1380, 1450 or 1550°C. The natural infiltration processing was carried out in a vacuum greater than 5×10⁻³ mbar and
the temperature was regulated with a bichromatic pyrometer (Modeline 5, Ircon, USA). The temperature was increased to the infiltration temperature at a heating rate of 20°C.min-1, kept
constant for 15 minutes before the contact with the liquid in order to melt either the silicon or the Ti-Si alloys and to stabilize the temperature of the liquids. Then, the crucible containing the melt was mechanically driven through an automatic jack to initiate and to maintain the contact between the compact and the liquid at the working temperature. When the infiltration weight gain was stabilized, the contact with the liquids was broken and the temperature was directly decreased at a rate of 30°C.min-1. The typical shape of the curves for the infiltration of molten
silicon in a SiC compact is shown in Figure 3-b) [24]. Figure 3-c) shows a TiSi2-infiltrated
compact.
2.3 Microstructural characterization of infiltrated composites
After cooling, the infiltrated compacts were cross-cut in the length and embedded in epoxy resin under vacuum. The cross-section was ground and polished to a 1µm diamond finish. An overview of each sample was obtained from about 100 pictures taken with an optical Nikon ME600L microscope; the overall image was reconstructed with Image Analysis System (ImageJ) [25]. The microstructures of the samples were examined with a FEI Quanta 400FEG scanning electron microscopy (SEM) operated at 10 kV. From backscattered-electrons (BSE) micrographs and Image Analysis System (ImageJ), it was possible to estimate the depth of the infiltration fronts, and the phases present in the different areas of the samples. The atomic
6
composition profiles in the infiltration area of each compact were obtained from an electron probe microanalyzer (EPMA, Cameca SX-100) with wavelength-dispersive spectrometers (WDS). The errors of quantifications via WDS technique are estimated to be ±2%. Because of the smallness of the grains, a large scanning probe surface of 30×30 µm2 with steps of 60 or 90
µm was used for WDS measurements.
3. Results
3.1 Thermodynamic calculations
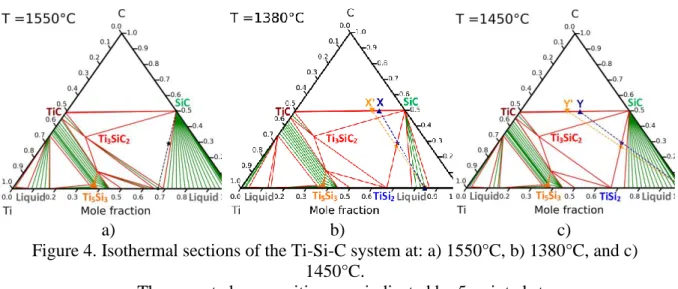
The selection of the compositions of the liquids and their operating temperature was based on thermodynamic calculations detailed in a previous paper [21]. Three compositions were identified from the Ti-Si phase diagram (Figure 1-b)) corresponding to three different ways of synthesis. The first case involves the infiltration of molten TiSi2 in SiC compacts at 1550°C,
i.e. 30°C above its melting temperature. The corresponding section of the Ti-Si-C phase diagram calculated at 1550°C is shown in Figure 4-a). This section reveals that SiC and molten TiSi2 are not in equilibrium at this temperature and, therefore, they should react to from Ti3SiC2
compound with a decrease of the titanium fraction in the liquid. At the cooling, this ternary compound reacts with the liquid to precipitate TiSi2 and SiC grains with a final composition
close to 51 vol% of SiC and 49 vol% of TiSi2. A black five-pointed star in Figure 4-a) indicates
the final composition of this TiSi2-SiC ceramic. The second case implies the infiltration of
Ti0.16Si0.84 eutectic liquid which reacts with TiC to form SiC+TiSi2 according to Equation 1:
𝑻𝒊𝑪(𝑺)+ 𝟕𝟓
𝟏𝟑 𝑻𝒊𝟎.𝟏𝟔𝑺𝒊𝟎.𝟖𝟒 (𝑳) 𝟐𝟓
𝟏𝟑 𝑻𝒊𝑺𝒊𝟐(𝑺)+ 𝑺𝒊𝑪(𝑺)
Equation 1
For an initial porosity of 50%, the mole and mass ratios between TiC and SiC were calculated equal to 𝑛𝑇𝑖𝐶
𝑉𝑛𝑆𝑖𝐶 = 0.329 and
𝑚𝑇𝑖𝐶
𝑚𝑆𝑖𝐶 = 0.491, respectively. This composition is identified by a blue
7
the ceramic is composed of 52 vol% of SiC and 48 vol% of TiSi2, It is marked by a blue
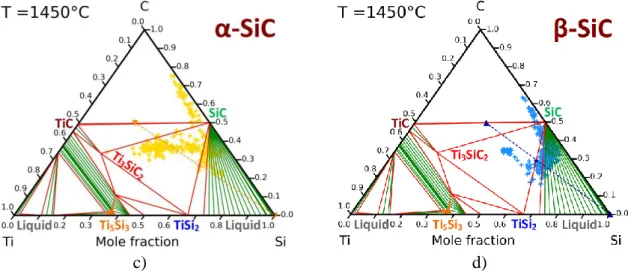
five-pointed star in Figure 4-b). The third case consists of the reactive infiltration of molten pure Si in SiC-TiC compacts at 1450°C. The corresponding section of the Ti-Si-C phases diagram at 1450°C is given in Figure 4-c). It shows clearly that molten pure Si reacts with TiC to generate TiSi2 and SiC according to Equation 2:
𝑻𝒊𝑪(𝑺)+ 𝟑 𝑺𝒊(𝑳) 𝑻𝒊𝑺𝒊𝟐(𝑺) + 𝑺𝒊𝑪(𝑺)
Equation 2 For an initial porosity of 50%, the required mole and mass ratios between TiC and SiC were found equal to 𝑛𝑇𝑖𝐶
𝑛𝑆𝑖𝐶 = 0.885 and
𝑚𝑇𝑖𝐶
𝑚𝑆𝑖𝐶 = 1.322, respectively. This composition is identified by
a blue Y in Figure 4-c). The final composition is expected to reach 51 vol% of SiC and 49 vol% of TiSi2. In both reactive cases, two compacts were elaborated and infiltrated, one realized with
α-SiC and the other one with β-SiC. As reported in Table 1, one compact contains the theoretical 𝑛𝑇𝑖𝐶
𝑛𝑆𝑖𝐶 ratio to produce a composite containing only of TiSi2 and SiC. The other one
contains a TiC excess to limit the local formation of remaining pure silicon. The excess of TiC is expected to compensate for the eventual losses of titanium and carbon in the melt. The samples containing TiC in excess should include a weak quantity of the ternary compound Ti3SiC2 without deleterious effects. The corresponding compositions called X' and Y' are
indicated in Table 1 and localized in Figures 4-b,c).
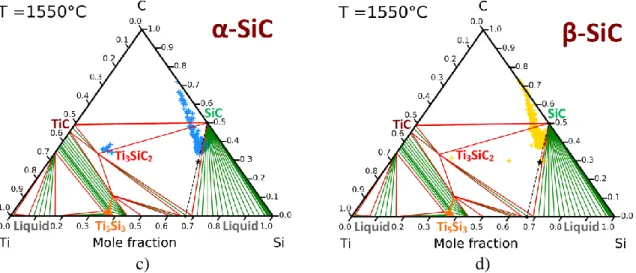
3.2 Thermodynamics and kinetics of the infiltration of SiC and TiC+SiC compacts 3.2.1 SiC compacts infiltrated by molten TiSi2
The time dependence of the weight gain normalized to the porosity during molten TiSi2 filling
in the two samples of pure α-SiC and β-SiC are shown in Figures 5-a,b). Both curves exhibit quite similar shapes with two main steps: a rapid weight gain followed by a stabilization with fluctuations of the weight due to variations of the meniscus. The 𝑘𝑇𝑖𝑆𝑖𝛼𝑆𝑖𝐶2 and 𝑘𝑇𝑖𝑆𝑖
2
𝛽𝑆𝑖𝐶
filling kinetics during the first step were linearly fitted, as shown in Figures 5-a,b). The values are found to be
8 equal to 𝑘𝑇𝑖𝑆𝑖𝛼𝑆𝑖𝐶2 = 1.45×10⁻² g.mm-2.s-1 and 𝑘𝑇𝑖𝑆𝑖
2
𝛽𝑆𝑖𝐶
= 9.61×10⁻³ g.mm-2.s-1. The filling percentages
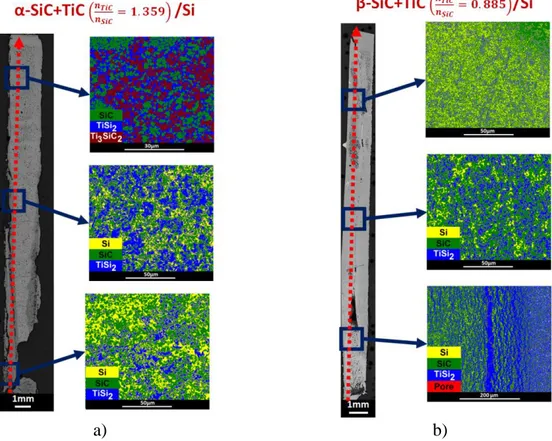
at the break of the contact with the liquid are estimated to be 60% and 27% of the theoretical mass filling for α-SiC and β-SiC compacts, respectively. Figures 6-a,b) show the optical and the colored backscattered electrons cross-section images of the α-SiC and β-SiC compacts infiltrated by molten TiSi2. These figures confirm that both compacts are partially infiltrated
and that the filling of the α-SiC/TiSi2 compact is clearly better. For both compacts, remaining
non-infiltrated areas are present all along of the height with very large areas for the β-SiC compact. In addition, the growth of a Ti3SiC2-rich layer with a thickness of about 150μm at the
bottom and along the lower faces of the two compacts (Figures 6-a,b)) is observed. The colored backscattered-electrons images (Figures 6-a,b)) evidenced the presence of SiC and TiSi2 but
also the existence of remaining porosities and some traces of free silicon. The BSE images taken at half of the infiltration height show that the microstructures are composed of SiC, TiSi2
micronic grains with more or less extended Si-rich areas (Figures 7-a,b)). WDS profiles along the length of the two compacts following the red dotted lines in Figures 6-a,b) are shown in Figures 8-a,b). In these figures, the short-dotted lines indicate the expected final composition; red is associated to Si, blue to C and orange to Ti. The same code is used for all samples. The positions of these WDS quantification are localized by Greek crosses in the phases diagrams in Figures 8-c,d), the final expected composition is indicated by a black 5-pointed star. The positions of these crosses and the profiles not only confirm the presence of Ti3SiC2 at the bottom
of each sample, but also the presence of porosities corresponding to a shift towards high fractions of carbon. This is due to the fact that porosities filled by the epoxy resin induce an overestimation of the carbon content. In both cases, it is found that the titanium content is lower than expected while the content of carbon is larger. This is correlated to the fact that the infiltration is incomplete because of the growth of the Ti3SiC2-rich layer. The local presence of
free silicon indicates that the composition of the liquid is depleted in titanium due to the growth of this layer which contains about 50 at.% of titanium. Finally, both samples are mainly composed of the phases SiC and TiSi2, as expected, but with some remaining volume percent
9
of free silicon and porosities. The formation of the Ti3SiC2-rich layer is presumably at the origin
of the slowing down and the stopping of the infiltration which occurs after durations of only 40 and 25 seconds for the α-SiC and β-SiC compacts, respectively. This difference indicates also that β-SiC is probably more reactive, as already proposed previously [21]. Indeed, the infiltration kinetic normalized to the porous section for α-SiC compact is more important (1.45×10² g.mm-2.s-1) and the infiltration percentage is also more elevated (60%) than for the
β-SiC compact. The system with α-SiC powder seems interesting but the difficulty lies in avoiding the premature termination of the infiltration due to the Ti3SiC2-containing layer.
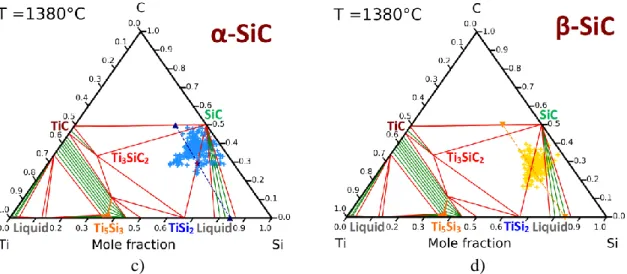
3.2.2 TiC/SiC compacts infiltrated by the eutectic liquid
The normalized weight gain curves during the infiltration of the compacts made of α-SiC or β-SiC and TiC by the Ti0.16Si0.84 eutectic liquid are shown in Figures 9-a,b). The curve for the
α-SiC+TiC compact has only one weight gain regime whereas the curve for the β-α-SiC+TiC compact has two successive weight gain regimes before the stabilization of the mass. The 𝑘𝑇𝑖𝛼𝑆𝑖𝐶+𝑇𝑖𝐶0.16𝑆𝑖0.84 and 𝑘𝑇𝑖
0.16𝑆𝑖0.84
𝛽𝑆𝑖𝐶+𝑇𝑖𝐶
filling kinetics during the first step were linearly fitted, as shown in Figures 9-a,b). The values are calculated to be equal to 𝑘𝑇𝑖𝛼𝑆𝑖𝐶+𝑇𝑖𝐶0.16𝑆𝑖0.84 = 1.34×10⁻² g.mm-2.s-1 and
𝑘𝑇𝑖
0.16𝑆𝑖0.84
𝛽𝑆𝑖𝐶+𝑇𝑖𝐶
= 1.58×10⁻³ g.mm-2.s-1. The final filling percentages are estimated to be 47% and
36% for α-SiC+TiC and β-SiC+TiC compacts, respectively. The optical cross-sections of the α-SiC+TiC and β-SiC+TiC compacts infiltrated by the Ti0.16Si0.84 liquid at 1380°C are shown
in Figures 10-a,b). For both compacts, the infiltrated areas are limited to the bottom and the faces with an elongated U-shaped border of the infiltrated zone. Layered structures along the faces of the two compacts are apparent. These structures are mainly composed of TiSi2 + SiC
but they also contain locally more or less important quantities of free silicon. The BSE images taken at half of the infiltration height show that the grains are small and composed of SiC, TiSi2
for both compacts with local traces of free-Si in the β-SiC+TiC compact (Figures 11-a,b). Within the infiltrated areas, it is also found some remaining porosities, especially for the
α-10
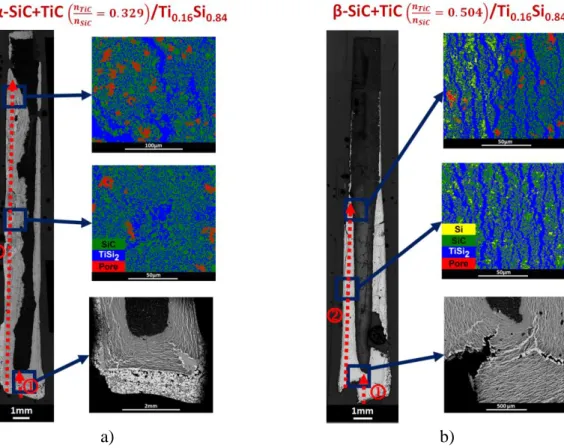
SiC+TiC compact. The WDS profiles on the length of the two compacts are drawn in Figures 12-a,b), and the positions of the corresponding compositions are indicated on the phase diagrams at 1380°C given in Figures 12-c,d). It is visible that the analysis points performed on 30×30 µm2 areas are relatively close to the expected final compositions localized by
five-pointed stars. The cloud of points for the α-SiC+TiC compact is slightly shifted to larger carbon contents; this confirms the presence of remaining porosities. The cloud of points for the β-SiC+TiC compact is practically centred on the expected composition thanks to a smaller quantity of pores. This difference can be justified by the excess in TiC of the β-SiC+TiC compact which promotes the densification and limits the presence of pores in the infiltrated areas. But, this rapid closing of the pores has as deleterious effect to limit the infiltration, that is why this sample is less well infiltrated. The outer layered structures and the rapid pore closure can be explained by the elevated volume expansion induced by the formation of a large quantity of TiSi2. This volume expansion induces also the formation of cracks in the lower part of each
compacts. That is why the infiltrations are partial as pores are no more accessible to the liquid flow.
3.2.3 SiC/TiC compacts infiltrated by molten silicon
The time dependence of the normalized weight gain during molten silicon filling in the α-SiC/TiC and β-α-SiC/TiC compacts are shown in Figures 13-a,b). The curves of these two compacts are not similar even if they exhibit two weight gain regimes. The main difference lies in the values and the variation of the kinetics. Indeed, the linear fitting of the 𝑘𝑆𝑖𝛼𝑆𝑖𝐶+𝑇𝑖𝐶 and
𝑘𝑆𝑖𝛽𝑆𝑖𝐶+𝑇𝑖𝐶 kinetics during the first step (Figures 13-a,b)) lead to values equal to 𝑘𝑆𝑖𝛼𝑆𝑖𝐶+𝑇𝑖𝐶 =
5.50×10⁻³ g.mm-2.s-1 and 𝑘𝑆𝑖𝛽𝑆𝑖𝐶+𝑇𝑖𝐶= 1.92×10⁻² g.mm-2.s-1. The final filling percentages are also
very different as they are found to be close to 34% and 60% of the theoretical mass filling for the α-SiC+TiC and β-SiC+TiC compacts, respectively. Figures 14-a,b) show the optical cross-sections and the colored backscattered electrons images of the α-SiC+TiC and β-SiC+TiC compacts infiltrated by liquid silicon at 1450°C. For both compacts, the liquid has reached the
11
top face but it remains non-infiltrated or partially infiltrated areas. The α-SiC+TiC compact has cracks which seem to induce matter losses along the faces during the infiltration. So, it is assumed that the calculated filling percentage of this compact is probably underestimated. The BSE image taken in the upper part of the α-SiC+TiC compact shows micronic grains of SiC, TiSi2 and Ti3SiC2 (Figure 15-a)). The BSE images taken from α-SiC+TiC and β-SiC+TiC
compacts show that the microstructure at mid-height is composed of micronic grains of SiC, TiSi2 for both samples with local traces of free-Si in the β-SiC+TiC compact (Figures 15-b,c)).
The WDS profiles on the length of the compacts are shown in Figures 16-a,b) and the positions of these compositions are given in the phases diagrams in Figures 16-c,d). Globally, the atomic concentration profiles for both compacts confirm the presence of an excess of silicon; a deficiency of titanium; and the presence of porosities revealed by jumps of the carbon fraction. However, the α-SiC+TiC compact has clearly a different composition on its upper half which is made of a mixture of the SiC, TiSi2 and Ti3SiC2 phases. It can be deduced that the deficiency
in titanium is caused by the dissolution of a fraction of the TiC grains in the liquid and the diffusion of Ti and C atoms to the outer melt through the infiltrated liquid. This effect visibly occurs along all the β-SiC+TiC compact and only on the lower half of the α-SiC+TiC compact. This compact has a different behavior because of an initial over concentration of TiC. This TiC excess has two main effects: 1) a lower infiltration kinetic because of the precipitation of larger quantities of SiC and TiSi2 which also induce the apparition of cracks; 2) the rapid saturation
of the infiltrated liquid which limits the dissolution effect on the upper areas leading to the precipitation of SiC, TiSi2 and Ti3SiC2.
4 Discussion
A comparison of the infiltration kinetics for the six samples is given in Figure 17-a). The corresponding filling percentages estimated from the theoretical weight gains for a complete filling are compared in Figure 17-b). From these data, it appears that the compacts containing an excess in TiC exhibit the lowest infiltration kinetics (Figures 9-b), 13-b)) and their filling
12
percentages are also low (Figures 10-b), 14-b)). It must be kept in mind that the estimated filling percentage of the α-SiC+TiC compact infiltrated by molten silicon is probably underestimated due to matter loses. The deleterious effects of a TiC excess come from a rapid precipitation of SiC and TiSi2, which slows down and blocks the liquid flow. However, a larger content of TiC
than theoretically needed limits the losses by dissolution and diffusion in the liquid; and consequently, it limits the unwanted presence of free silicon. This effect was obtained for the α-SiC+TiC compact infiltrated by molten silicon as shown in Figure 14-a) and Figure 15-a). It was not evidenced for the β-SiC+TiC compact infiltrated by liquid eutectic as remaining free silicon is locally present in Figure 10-b) and Figure 11-b). The most probable reason is that the precipitation of large quantities of TiSi2 induce the opening of cracks in which the eutectic
liquid penetrates leading at the colling to the precipitation of TiSi2+Si. It is also evidenced from
these results that the use of the eutectic liquid gives the most undesirable results because of the rapid growth of laminated structures along the faces with a significant volume of solid TiSi2
(Figures 10-a,b)). The infiltration of pure silicon gives better results but the dissolution and the diffusion of titanium in the liquid leads to the presence of unreacted silicon, as shown in Figures 14-a,b) and Figures 15-b,c). The infiltration are practically homogeneous (Figures 14-a,b)) and the filling percentages elevated (Table 1). These behaviors are induced by the activity gradients between the liquid and the grains of the compact, as already reported previously for similar samples [21]. These systems tend to evolve towards balancing of the activities of all components and especially titanium. Indeed, it was found that the activity of titanium is higher in TiC than in the eutectic liquid and a fortiori in pure molten silicon. This driving force is necessary for precipitating SiC and TiSi2. But the predominant behavior is the saturation in
titanium and carbon of the liquid whether infiltrated or not. Such behavior is all the more problematic since it occurs in a liquid phase which therefore has very high diffusion coefficients. An excess of TiC should promote an adequate chemical composition but it is found herein that it could imply a too rapid closure of the pores and consequently a lower infiltration (Figure 10-b)). An adjustment of the TiC quantity could be a promising way to consider. The
13
infiltration of molten TiSi2 in SiC compacts is also feasible for the synthesis of SiC/TiSi2
composites. In this case, it remains only one limitation to the infiltration because of the reaction occurring on the faces of the compacts in contact with the liquid leading to the growth of a dense layer mainly composed of Ti3SiC2, as evidenced in Figures 6-a,b). Two detrimental
effects induce this reaction, which are the limitation of the liquid flow and the enrichment of the liquid in silicon (Figures 7-a,b)). Consequently, the compacts are partially filled and contained unwanted free silicon. One way of improvement should be the control of the activity gradients between the melt and the compact. Indeed, it was already shown that the activity gradients play a determinant role in this system [21]. At 1380 and 1450°C, it was found that the activity gradient of Ti promotes its dissolution and diffusion to the external liquid bath which induces an excess in silicon. At 1550°C, the gradients of titanium and silicon are favorable as the larger values of their respective activity are found in the liquid. The gradient of carbon is inverse and initiates the dissolution and the diffusion of carbon atoms in the liquid. But its solubility in the liquid is very low. The carbon defect by this mechanism should be very weak even if it can induce a limited quantity of free silicon. The specificity of the activity gradients in the SiC/molten-TiSi2 system is that their paths induce the formation of Ti3SiC2. That is why
this compound is formed at the interface between the compact and the liquid (Figures 6-a,b)). The use of a porous drain of Ti3SiC2 between the liquid source and the compact could be a
solution to avoid the direct interaction between them and to promote the liquid flow. It is to note that this ternary phase is in equilibrium with molten TiSi2 and SiC, as shown in Figure
4-a). The use of β-SiC powder should be avoided as it is found more reactive since the corresponding infiltration and filling percentage are lower, as shown in Table 1 and in Figures 17-a,b). The kinetic results of this additional study confirm and complete convincingly the results previously reported on the thermodynamic examination of these systems [21]. The determining role of thermodynamic on the infiltration kinetics is demonstrated.
14
The in-situ measurements of the capillary infiltration kinetics of molten pure silicon, TiSi2 and
eutectic Ti-Si alloy in porous compacts composed of pure SiC or SiC+TiC powders are found to provide a better understanding about the mechanisms and their limitations for the preparation of SiC/TiSi2 composites. The experimental results show that the use of a significant excess of
TiC is detrimental, which reduces the kinetic and rate of infiltration. However, the fraction of TiC in SiC+TiC compacts infiltrated by liquid silicon should be adjusted in relation to the losses of titanium and carbon by dissolution and diffusion in the liquid through their chemical activity gradients. The infiltration of the eutectic liquid Ti0.16Si0.84 is not found as a possible way of
synthesis. The infiltration of molten TiSi2 in α-SiC seems to be a promising solution if the
formation of a Ti3SiC2 coating at the liquid/compact interface is limited. The effect of this
coating is a limitation of the infiltration process and a Ti-defect of the infiltrated liquid. An improvement should be possible by controlling the interfacial contact between the compact and the liquid, for example, with a drain of Ti3SiC2 powder. This work confirms the determinant
role played by the activity gradients on the infiltration kinetics and filling percentage.
Acknowledgement
The authors wish to thank Laurine Lapuyade and Muriel Alrivie, from the Laboratory of ThermoStructural Composites (LCTS - UMR 5801 - UB-CNRS-CEA-SAFRAN); and Nithavong Cam (PLACAMAT - UMS 3626) for their kind assistance.
15 References
[1] M.K. Aghajanian, M.A. Rocazella, J.T. Burke, S.D. Keck, The fabrication of metal matrix composites by a pressureless infiltration technique, J. Mater. Sci. 26 (1991) 447-454.
https://doi.org/10.1007/BF00576541
[2] K.K. Chawla, Ceramic Matrix Composites, second ed., Kluwer Academic Publishers, Boston, 2003, pp. 417-419.
[3] N.P. Bansal, Hand Book of Ceramic Composites, Kluwer Academic Publishers, Boston, 2005, pp. 117-147
[4] N. Durlu, Titanium carbide-based composites for high temperature applications, J. Eur. Ceram. Soc. 19 (1999) 2415-2419, https://doi.org/10.1016/S0955-2219(99)00101-6 [5] M. Steen, L. Ranzani, Potential of SiC as a heat exchanger material in combined cycle plant,
Ceram. Int. 26 (2000) 849-854. https://doi.org/10.1016/S0272-8842(00)00027-4
[6] W. Zhuo, F. Niu, Y. Zhao, J. Liu, Hermeticity and tensile experiment of small platetype SiC ceramic composites for advanced reactor applications, Ann. Nucl. Energy 110 (2017) 1098-1106. https://doi.org/10.1016/j.anucene.2017.08.036
[7] Z.B. Yu, V.D. Krstic, Fabrication and characterization of laminated SiC ceramics with self-sealed ring structure, J. Mater. Sci. 38 (2003) 4735-4738.
https://doi.org/10.1023/A:1027423001928
[8] C.L. Cramer, A.D. Preston, A.M. Elliott, R.A. Lowden, Highly dense, inexpensive composites via melt infiltration of Ni into WC/Fe preforms, Int. J. Refract. Metals Hard Mater. 82 (2019) 255-258. https://doi.org/10.1016/j.ijrmhm.2019.04.019
[9] C.A. Leon-Patino, R.A.L. Drew, Role of metal interlayers in the infiltration of metal-ceramic composites, Curr. Opin. Solid State Mater. Sci. 9 (2005) 211e218,
https://doi.org/10.1016/j.cossms.2006.04.006
[10] J. Roger, L. Guesnet, A. Marchais, Y. Le Petitcorps, SiC/Si composites elaboration by capillary infiltration of molten silicon, J. Alloys Compd. 747 (2018) 484-494.
16
[11] L. Hozer, J.R. Lee, Y.M. Chiang, Reaction-infiltrated, net-shape SiC composites, Mater. Sci. Eng. A-Struct. Mater. Prop. Microstruct. Proc. 195 (1995) 131-143.
https://doi.org/10.1016/0921-5093(94)06512-8
[12] S. Aroati, M. Cafri, H. Dilman, M.P. Dariel, N. Frage, Preparation of reaction bonded silicon carbide (RBSC) using boron carbide as an alternative source of carbon, J. Eur. Ceram. Soc. 31 (2011) 841-845. https://doi.org/10.1016/j.jeurceramsoc.2010.11.032 [13] D. Giuranno, A. Polkowska, W. Polkowski, R. Novakovic, Liquid Si-rich Si-Zr alloys in
contact with C and SiC: Wettability and Interaction phenomena J. Alloys Compd. 822 (2020) 153643, https://doi.org/10.1016/j.jallcom.2020.153643
[14] R. Rosenkranz, G. Frommeyer, W. Smarsly, Microstructures and properties of high melting point intermetallic Ti5Si3 and TiSi2 compounds, Mater. Sci. Eng. A152 (1992)
288-294. https://doi.org/10.1016/0921-5093(92)90081-B
[15] D. Vojtech, B. Bartova, T. Kubatik, High temperature oxidation of titanium–silicon alloys, Mater. Sci. Eng. A361 (2003) 50-57. https://doi.org/10.1016/S0921-5093(03)00564-1
[16] R. Radhakrishnan, C.H. Henager, Jr., J.L. Brimhall, S.B. Bhaduri, Synthesis of Ti3SiC2/SiC and TiSi2/SiC composites using displacement reactions in the Ti-Si-C system,
Scripta Mater. 34 (1996) 1809-1814. https://doi.org/10.1016/1359-6462(95)00663-X
[17] J. Li, D. Jiang, S. Tan, Microstructure and mechanical properties of in situ produced SiC/TiSi2 nanocomposites, J. Eur. Ceram. Soc. 20 (2000) 227-233,
https://doi.org/10.1016/S0955-2219(99)00157-0
[18] L. Wang, W. Jiang, C. Qin, L. Chen, Simultaneous Synthesis and Densification of TiSi2/SiC Submicron-Composites via Spark Plasma Sintering, Ceram. Trans. 194 (2006)
189-193, https://doi.org/10.1002/9780470082751.ch17
[19] M. Esfehanian, J. Gunster, F. Moztarzadeh, J.G. Heinrich, Development of a high temperature Cf/XSi2–SiC (X = Mo, Ti) composite via reactive melt infiltration, J. Eur.
17
[20] Z. Hao, W. Sun, X. Xiong, Z. Chen, Y. Wang, Y. Chang, Y. Xu, Microstructure and ablation properties of a gradient Cf/C-XSi2-SiC(X = Mo,Ti) composite fabricated by
reactive melt infiltration, J. Eur. Ceram. Soc. 36 (2016) 3775-3782,
http://dx.doi.org/10.1016/j.jeurceramsoc.2016.04.006
[21] J. Roger, M. Salles, Thermodynamic of liquid metal infiltration in TiC-SiC or SiC porous
compacts, J. Alloys Compd. 802 (2019) 636-648,
https://doi.org/10.1016/j.jallcom.2019.06.181
[22] J.O. Andersson, T. Helander, L. Höglund, P.F. Shi, B. Sundman, Thermo-Calc and DICTRA, Calphad 26 (2002) 273-312. https://doi.org/10.1016/S0364-5916(02)00037-8
[23] Y. Du, J.C. Schuster, H.J. Seifert, F. Aldinger, Experimental investigation and thermodynamic calculation of the titanium–silicon–carbon system, J. Am. Ceram. Soc. 83 (2000) 197-203. https://doi.org/10.1111/j.1151-2916.2000.tb01170.x
[24] J. Roger, M. Avenel, L. Lapuyade, Characterization of SiC ceramics with complex porosity by capillary infiltration: Part B – Filling by molten silicon at 1500 °C, J. Eur. Ceram. Soc. 40 (2020) 1869-1876, https://doi.org/10.1016/j.jeurceramsoc.2019.12.050
[25] C.A. Schneider, W.S. Rasband, K.W. Eliceiri, NIH Image to ImageJ: 25 years of image analysis, Nature Methods 9 (2012) 671-675. https://doi.org/10.1038/nmeth.2089
18
a) b)
Figure 1. Ti-Si-C system: a) calculated section at 25°C, and b) calculated Ti-Si phase diagram [22].
Figure 2. Pore-size distributions of consolidated SiC and SiC+TiC compacts.
a) b) c)
Figure 3. Capillary rise tests in SiC+TiC or SiC compacts with molten Si or Ti,Si alloys: a) schema of the experimental set-up, b) Typical time dependence of silicon capillary infiltration in a SiC compact [24], and c) picture of a α-SiC compact infiltrated by molten
19
a) b) c)
Figure 4. Isothermal sections of the Ti-Si-C system at: a) 1550°C, b) 1380°C, and c) 1450°C.
The expected compositions are indicated by 5-pointed stars.
a) b)
Figure 5. Experimental and fitted time dependence of the weight gain during the capillary rise of molten TiSi2 at 1550°C in: a) α-SiC compact, and b) β-SiC compact.
20
a) b)
Figure 6. Optical and backscattered electrons images of the cross sections of the SiC compacts infiltrated by molten TiSi2 at 1550°C: a) α-SiC, and b) β-SiC.
a) b)
Figure 7. BSE images at halfway up of the compacts infiltrated by molten TiSi2 at 1550°C:
a) α-SiC, and b) β-SiC.
a)
21
c) d)
Figure 8. WDS experimental analyses on compacts infiltrated at 1550°C: (a)(b) concentration profiles of silicon, carbon and titanium corresponding to the red dotted lines in Figure 6 and (c)(d) localization of the WDS measured compositions in the corresponding
Ti-Si-C phase diagram.
(Dotted lines indicate the expected final compositions, red is associated to Si, blue to C and orange to Ti, the same code is used for all samples)
a) b)
Figure 9. Experimental and fitted time dependence of the weight gain during the capillary rise of the molten eutectic alloy at 1380°C in: a) α-SiC+TiC compact (X), and b) β-SiC+TiC
22
a) b)
Figure 10. Optical and backscattered electrons images of the cross sections of the compacts infiltrated by molten Ti0.16Si0.84 at 1380°C: a) α-SiC+TiC (X), and b) β-SiC+TiC (X’).
a) b)
Figure 11. BSE images at halfway up of the compacts infiltrated by molten Ti0.16Si0.84 at
1380°C: a) α-SiC+TiC, and b) β-SiC+TiC.
a)
23
c) d)
Figure 12. WDS experimental analyses on compacts infiltrated at 1380°C: (a)(b) concentration profiles of silicon, carbon and titanium corresponding to the red dotted lines
in Figure 9, and (c)(d) localization of the WDS measured compositions in the corresponding Ti-Si-C phase diagram.
a) b)
Figure 13. Experimental and fitted time dependence of the weight gain during the capillary rise of molten silicon at 1450°C in: a) α-SiC+TiC compact (Y), and b) β-SiC+TiC compact
24
a) b)
Figure 14. Optical and colored backscattered electrons images of the cross-sections of the compacts infiltrated by molten Si at 1450°C: a) α-SiC+TiC (Y), and b) β-SiC+TiC (Y’).
a) b) c)
Figure 15. BSE images of the compacts infiltrated by molten Si at 1450°C: a) upper part of the α-SiC+TiC compact, b) halfway up of the α-SiC+TiC compact, and c) halfway
up of the β-SiC+TiC compact.
a)
25
c) d)
Figure 16. WDS experimental analyses on compacts infiltrated at 1450°C: (a)(b) concentration profiles of silicon, carbon and titanium corresponding to the red dotted lines
in Figure 12, and (c)(d) localization of the WDS measured compositions in the corresponding Ti-Si-C phase diagram.
a) b)
Figure 17. Comparison of the infiltrations of the six compacts: a) the 𝑘𝑙𝑖𝑞𝑢𝑖𝑑𝑐𝑜𝑚𝑝𝑎𝑐𝑡 kinetics, and b) the filling percentages.
26
Table 1: Details about the 6 compacts used in the study.
Compacts Liquid Temperature
(°C) nTiC/nSiC ratio (mol) mTiC/mSiC ratio (g) VTiC/VSiC ratio (cm3) Dimensions (mm3) Porosity (%) (±1)
Filling by the liquid (%) (±5)
α-SiC TiSi2 1550ºC - - - 30.8×9.3×2.8 50 60
β-SiC TiSi2 1550ºC - - - 31.0×8.6×4.5 45 27
TiC + α-SiC Ti0.16Si0.84 1380ºC 0.329 (X) 0.491 0.319 30.1×9.2×3.0 49 47
TiC + β-SiC Ti0.16Si0.84 1380ºC 0.504 (X’) 0.754 0.490 32.8×8.0×2.1 50 36
TiC + α-SiC Si 1450ºC 1.359 (Y’) 2.031 1.320 29.5×10.6×2.9 49 34*
TiC + β-SiC Si 1450ºC 0.885 (Y) 1.322 0.860 34.0×9.0×2.0 50 60
![Figure 1. Ti-Si-C system: a) calculated section at 25°C, and b) calculated Ti-Si phase diagram [22]](https://thumb-eu.123doks.com/thumbv2/123doknet/12973035.377798/19.892.119.771.44.319/figure-ti-si-calculated-section-calculated-phase-diagram.webp)

![[PDF] La transparence dans une image avec PHOTOFILTRE | Cours informatique](data:image/gif;base64,R0lGODlhAQABAIAAAP///wAAACH5BAEAAAAALAAAAAABAAEAAAICRAEAOw==)