HAL Id: hal-00317896
https://hal.archives-ouvertes.fr/hal-00317896
Submitted on 14 Oct 2005
HAL is a multi-disciplinary open access
archive for the deposit and dissemination of
sci-entific research documents, whether they are
pub-lished or not. The documents may come from
teaching and research institutions in France or
abroad, or from public or private research centers.
L’archive ouverte pluridisciplinaire HAL, est
destinée au dépôt et à la diffusion de documents
scientifiques de niveau recherche, publiés ou non,
émanant des établissements d’enseignement et de
recherche français ou étrangers, des laboratoires
publics ou privés.
Temporal and spatial evolution of discrete auroral arcs
as seen by Cluster
S. Figueiredo, G. T. Marklund, T. Karlsson, T. Johansson, Y. Ebihara, M.
Ejiri, N. Ivchenko, P.-A. Lindqvist, Hans Nilsson, A. Fazakerley
To cite this version:
S. Figueiredo, G. T. Marklund, T. Karlsson, T. Johansson, Y. Ebihara, et al.. Temporal and spatial
evolution of discrete auroral arcs as seen by Cluster. Annales Geophysicae, European Geosciences
Union, 2005, 23 (7), pp.2531-2557. �hal-00317896�
SRef-ID: 1432-0576/ag/2005-23-2531 © European Geosciences Union 2005
Annales
Geophysicae
Temporal and spatial evolution of discrete auroral arcs as seen by
Cluster
S. Figueiredo1, G. T. Marklund1, T. Karlsson1, T. Johansson1, Y. Ebihara2, M. Ejiri2, N. Ivchenko1, P.-A. Lindqvist1, H. Nilsson3, and A. Fazakerley4
1Alfv´en Laboratory, Royal Institute of Technology, Stockholm, Sweden 2National Institute of Polar Research, Tokyo, Japan
3Swedish Institute of Space Physics, Kiruna, Sweden
4Mullard Space Science Laboratory, University College London, UK
Received: 16 December 2004 – Revised: 2 June 2005 – Accepted: 10 August 2005 – Published: 14 October 2005
Abstract. Two event studies are presented in this paper where intense convergent electric fields, with mapped inten-sities up to 1350 mV/m, are measured in the auroral upward current region by the Cluster spacecraft, at altitudes between 3 and 5 Earth radii. Both events are from May 2003, South-ern Hemisphere, with equatorward crossings by the Cluster spacecraft of the pre-midnight auroral oval.
Event 1 occurs during the end of the recovery phase of a strong substorm. A system of auroral arcs associated with convergent electric field structures, with a maximum per-pendicular potential drop of about ∼10 kV, and upflowing field-aligned currents with densities of 3µA/m2(mapped to the ionosphere), was detected at the boundary between the Plasma Sheet Boundary Layer (PSBL) and the Plasma Sheet (PS). The auroral arc structures evolve in shape and in magni-tude on a timescale of tens of minutes, merging, broadening and intensifying, until finally fading away after about 50 min. Throughout this time, both the PS region and the auroral arc structure in its poleward part remain relatively fixed in space, reflecting the rather quiet auroral conditions during the end of the substorm. The auroral upward acceleration region is shown for this event to extend beyond 3.9 Earth radii altitude. Event 2 occurs during a more active period associated with the expansion phase of a moderate substorm. Images from the Defense Meteorological Satellite Program (DMSP) F13 spacecraft show that the Cluster spacecraft crossed the horn region of a surge-type aurora. Conjugated with the Cluster spacecraft crossing above the surge horn, the South Pole All Sky Imager recorded the motion and the temporal evolution of an east-west aligned auroral arc, 30 to 50 km wide. Intense electric field variations are measured by the Cluster space-craft when crossing above the auroral arc structure, collo-cated with the density gradient at the PS poleward boundary, and coupled to intense upflowing field-aligned currents with
Correspondence to: S. Figueiredo
mapped densities of up to 20 µA/m2. The surge horn con-sists of multiple arc structures which later merge into one structure and intensify at the PS poleward boundary. The surge horn and the associated PS region moved poleward with a velocity at the ionospheric level of 0.5 km/s, following the large-scale poleward expansion of the auroral oval asso-ciated with the substorm expansion phase.
Keywords. Ionosphere (Ionosphere-magnetosphere
interac-ctions; Electric fields and currents; Particle acceleration)
1 Introduction
Precipitating electrons accelerated to energies of several keV producing the visible bright discrete aurora are a character-istic feature of the auroral upward current region. The ac-celeration is a result of a parallel potential drop required to drive the magnetospheric electrons against the magnetic mir-ror force into the ionosphere. The electrons that reach the upper atmosphere dissipate their energy through collisions with neutral atoms and molecules powering in this way the production of visible auroral arcs.
The existence of a parallel electric field in the auroral up-ward current region was theoretically postulated by Alfv´en (1958) and experimentally confirmed by McIlwain (1960), who inferred the parallel potential drops from monoenergetic peaks in the electron spectra measured on a sounding rocket. The first satellite measurements confirming the existence of parallel electric fields were made by the S3-3 satellite. Nar-row beams of fast upward flowing O+ ions were detected at an altitude of ∼1 Earth radius (Shelley et al., 1976), consis-tent with an upward acceleration region below the satellite.
Once the existence of quasi-static parallel electric fields on auroral field lines was conclusively shown and gener-ally accepted, several studies were reported over the last 20 years where other questions were raised on various aspects
2532 S. Figueiredo et al.: Temporal and spatial evolution of discrete auroral arcs
Fig. 1. Configuration of the Cluster spacecraft on 1 May 2003, 15:00–16:00 UT. Black color represents spacecraft 1, red spacecraft 2, green spacecraft 3 and blue color represents spacecraft 4.
of the auroral acceleration process. Do the parallel elec-tric fields exist only in the upward current region or in the downward current region as well (e.g. Mozer, 1980)? What is the shape of the associated potential structures (e.g. Car-lqvist and Bostr¨om, 1970)? What is the altitude profile of the parallel electric fields (e.g. Lindqvist and Marklund, 1990)? And does it have a seasonal dependence (e.g. Marklund et al., 1997)? Is the acceleration quasi-static or driven by time-varying processes such as Alfv´en waves (e.g. Bryant et al., 1991)? Do the potential structures map quasi-statically up to higher altitudes? (e.g. Marklund et al., 2001) What is the spatial and temporal behavior of the potential structures?
The multi-spacecraft Cluster mission provides us with an unique possibility to study the spatial and the temporal evo-lution of auroral structures at high altitudes. In a study by Marklund et al. (2001), the temporal evolution of a diverg-ing electric field structure acceleratdiverg-ing electrons away from the auroral ionosphere was analyzed and found to have a timescale of approximately 200 s. Johansson et al. (2004) showed the growth of a unipolar electric field structure as-sociated with downward field-aligned currents (FACs) and upward electron beams, with a much shorter time separa-tion between the Cluster spacecraft (10 to 20 s). In a study by Vaivads et al. (2003), the density increase at high alti-tudes, associated with the development of an auroral arc, was shown to occur on a timescale of a few minutes. Whereas short separation intervals between the Cluster spacecraft al-lows the study of the stability of auroral processes on short timescales, the larger time separation intervals allow for the study of the temporal evolution of auroral and return cur-rent structures associated with density cavity formation and other long-time modifications occurring in the ionosphere and magnetosphere during the substorm evolution.
In this study we present two events (Event 1 and Event 2) from May 2003, Southern Hemisphere, where intense per-pendicular electric field variations, associated with the cross-ings of negative potential structures, in the auroral upward current region, are measured at the density gradient associ-ated with the boundary between the Plasma Sheet Bound-ary Layer (PSBL) and the Plasma Sheet (PS). These electric field structures were measured by the Cluster spacecraft at altitudes between 3 and 5 Earth radii, in the poleward part of the evening side auroral oval. Event 1 (1 May 2003) oc-curred at the end of the recovery phase of a strong substorm, while Event 2 (3–4 May 2003) occurred during the expansion phase of a moderate substorm. The time interval between the crossings by the first and the last Cluster spacecraft was for Event 1 about 1 hour and for Event 2 about 20 min. The large time separation between the Cluster spacecraft allows us to follow the development of the electric field structures during the substorm evolution.
In Sect. 2, the temporal and spatial evolution of Event 1 is described. Electric field, magnetic field, electron and ion particle data, measured on board the four Cluster spacecraft, are presented, together with the calculated FAC density dis-tribution. The same format is used for presenting the data for Event 2 in Sect. 3. Conjugated with the passage of the Clus-ter spacecraft in Event 2, the All Sky Imager (ASI) located at the South Pole Station observed the evolution of an auro-ral arc structure. Images from the South Pole All Sky Im-ager, overlaid with the mapped location of the Cluster space-craft, are presented. Particle and magnetic field data, as well as images recorded on board the DMSP F13 spacecraft, are also presented for this event. The combination of the Cluster multi-spacecraft measurements with the conjugated ASI im-ages and with the measurements and imim-ages from the DMSP F13 spacecraft, allows for a detailed analysis of the tempo-ral and spatial evolution of Event 2. Discussion of the re-sults and a summary of the main conclusions are presented in Sect. 4.
2 Event 1 −1 May 2003 − Temporal and spatial analysis
On 1 May 2003, the Cluster spacecraft crossed the evening MLT sector of the Southern Hemisphere auroral oval mov-ing equatorward, at an altitude of 3.5 to 4.5 Earth radii, with the four spacecraft aligned nearly as pearls on a string. Fig-ure 1 shows the configuration of the four Cluster spacecraft between 15:00 and 16:00 UT. Spacecraft 1 to 4 are repre-sented by black, red, green, and blue color, respectively.
Figure 2 shows electric field (Electric Field and Wave instrument, EFW, Gustafsson et al., 1997), magnetic field (Flux Gate Magnetometer, FGM, Balogh et al., 1997) and electron energy flux (Plasma Electron And Current Experi-ment, PEACE, Johnstone et al., 1979) data measured by the Cluster spacecraft 1, on 1 May 2003, between 14:55 and 15:40 UT. The top three panels show the electron energy flux spectrogram versus energy at pitch angles 0, 90 and 180◦, respectively. A pitch angle of 0◦ corresponds to upgoing
I. II.
Fig. 2. Event 1 − 1 May 2003. Data measured on board Cluster spacecraft 1. Panels 1 to 3 − Electron energy flux spectrogram versus
energy at pitch angles 0, 90 and 180◦, respectively. Pitch angle of 0◦ corresponds to upgoing and 180◦to downgoing electrons on the
Southern Hemisphere. Panel 4 − Negative of the spacecraft potential. Panel 5 − Calculated perpendicular potential. Panel 6 − Electric field component normal to the structure and pointing equatorwards (black line); Magnetic field component tangential to the structure pointing eastwards (green line). Panel 7 − Field-aligned current density distribution, with blue color showing upflowing currents and red color downflowing currents.
2534 S. Figueiredo et al.: Temporal and spatial evolution of discrete auroral arcs electrons and 180◦to downgoing electrons, as the spacecraft
is crossing the Southern Hemisphere. In the fourth panel the negative of the spacecraft potential, indicative of the changes in the ambient plasma density is plotted. The potential cal-culated from the integration of the measured electric field along the orbit is shown in the fifth panel. To the measured magnetic field data, a polynomial function applied in a large-time window (∼4 h) was fitted. The residual magnetic field was then computed by subtracting the fitted large-scale back-ground magnetic field. By applying minimum variance anal-ysis to the electric and magnetic field data, the orientation of the analyzed structure was determined. A coordinate sys-tem (eB,et,en)was then defined, where eBis parallel to the
background magnetic field direction, et is tangential to the
structure pointing eastwards, and en normal to the structure
pointing towards lower latitudes. The normal component of the electric field (Enormal) is shown in the next to last panel
with a black line; the green line represents the tangential component of the residual magnetic field, (Btangential). The
last panel shows the field-aligned current density distribution calculated from the residual magnetic field and assuming an infinite current sheet aligned with the structure. The regions of upward current are colored blue and the downward cur-rent regions are colored red. The electric and magnetic field values, as well as the FAC values shown in this figure, corre-spond to non-mapped intensities.
Between 15:03 and 15:19 UT, a large-scale negative po-tential structure characterized by weak electric field varia-tions (structure I) is seen, distributed over a broad region (∼270 km width at ionospheric altitudes). Structure I has a maximum perpendicular potential drop of ∼9 kV. The more structured electron energy flux (panels 1 to 3), and the rela-tively lower ambient plasma density inferred from the space-craft potential profile (panel 4), indicate that this structure is located in the PSBL. At 15:30 UT a sharp increase is seen in the plasma density (as inferred from the spacecraft potential), indicating that the spacecraft enters into the denser PS region. The diffuse and relatively isotropic high-energy fluxes of the electrons also identifies this region as the PS. Note that in both the polar cap (PC) and the PS regions the spacecraft po-tential shows a relatively low absolute value as compared to the PSBL region. For the PS region this reflects the high den-sity of plasma of middle and high energy. Regarding the PC region, a high density of cold plasma may possibly explain the relatively low value of the spacecraft potential in this re-gion. However, the response of the spacecraft potential in the PC region is still not well understood.
Centered at 15:30:30 UT, a nearly symmetric U-shaped negative potential structure (structure II), is seen when cross-ing the sharp density gradient between the PSBL and the PS. Structure II is characterized by a small-scale (68 km width, mapped to the ionosphere) and intense (820 mV/m mapped peak intensity) bipolar electric field variation, asso-ciated with a perpendicular potential drop of ∼10 kV.
Both structures I and II are associated with regions of mainly upward directed FACs, with mapped peak intensity of 3 µA/m2.
Comparing the energy flux spectrogram for the upgoing and for the downgoing electrons (panels 1 and 3, respec-tively), a relatively weaker energy flux is seen for the up-going electrons. The lack of upup-going electrons is especially noticeable at the edges of both structures I and II, where the perpendicular electric field is strongest.
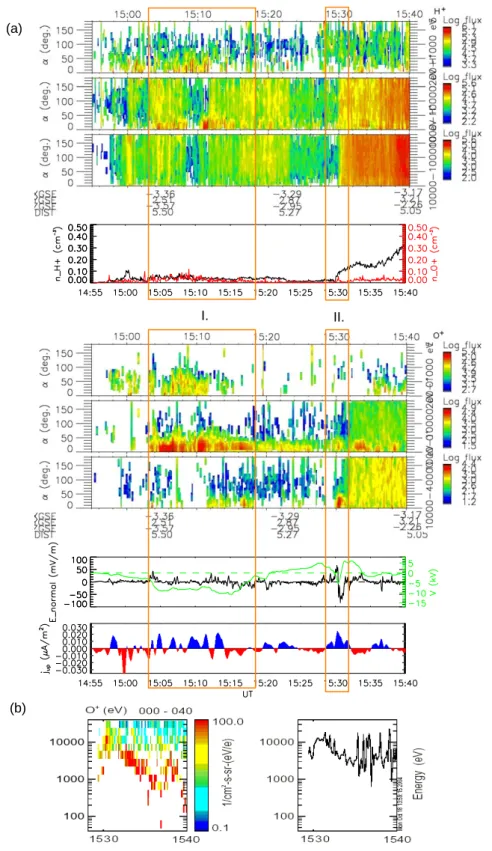
In Fig. 3a ion data (Cluster Ion Spectrometry, CIS, R`eme et al., 1997) for Event 1, measured on board Cluster space-craft 1 is plotted. The first three panels show the H+ ion flux spectrogram versus pitch angle for increasing energy inter-vals, 200–1000 eV, 1–10 keV and 10–38 keV, respectively. A pitch angle of 0◦refers to particles moving upward and 180◦ to particles moving downward. H+ (black) and O+ (red) ion density is plotted in the fourth panel. The next three panels show the O+ ion flux spectrogram versus pitch angle in the same format as for panels 1–3. In the next to last panel, the component of the electric field normal to the structure (black curve), and the potential calculated along the orbit (green curve), are plotted for comparison. In the last panel is plotted the same FAC distribution as shown in the last panel of Fig. 2. Figure 3b shows, on the left, the ion flux spectrogram versus energy for the O+ upgoing ions (0–40◦pitch angle), for the time period 15:30–15:40 UT. The plot to the right shows the corresponding characteristic energy for the O+ upgoing ions. Associated with structure I (9 kV maximum perpendicular potential drop), upflowing beams of H+ and O+ ions with energies between 1 and 10 keV are detected. A more ener-getic beam of upflowing O+ ions is detected when crossing structure II (10 kV perpendicular potential drop). This O+ ion beam has an energy of ∼10 keV, as shown by the ion flux spectrogram versus energy plotted in the left panel of Fig. 3b. The perpendicular potential and the measured energy of the upward accelerated ion beams are thus very consistent.
A signature of energy dispersion can be recognized in the characteristic energy of the upflowing O+ ions between 15:30 and 15:36 UT (Fig. 3b). This energy dispersion signa-ture corresponds to the upflowing O+ ions seen equatorward of structure II, in panel 6 of Fig. 3a. E×B drift, due to the convection electric field, may induce the spatial energy dis-persion seen for the upflowing O+ ions.
When entering into the PS region, relatively isotropic high-energy fluxes of both H+ and O+ ions are detected, as characteristic of this region. A possible signature of acceler-ated H+ ion beams may be hidden behind the homogeneous distribution of the H+ ion flux.
A system composed by a broad, negative, U-shaped po-tential structure detected in the PSBL, and a narrower and deeper, negative, U-shaped potential structure located at the PSBL/PS boundary, both associated with regions of upflow-ing FACs, is thus consistently supported by the combined analysis of electric field, magnetic field, and both electron and ion particle data. The analysis of the temporal and spa-tial evolution of this system follows.
Cluster spacecraft 2 crossed the density gradient between the PSBL and the PS at 15:47 UT, as seen in Fig. 4. This occurs 16’30” after spacecraft 1 passed across this boundary. Spacecraft 2 detects a PSBL with lower density and lower
I. II. (a)
(b)
Fig. 3. CIS ion data measured on board Cluster spacecraft 1 on 1 May 2003. (a) Panels 1 to 3 − H+ ion flux spectrogram versus pitch
angle for the energy intervals 200–1000 eV, 1–10 keV and 10–38 keV, respectively. Pitch angle of 0◦corresponds to upgoing and 180◦
to downgoing ions on the Southern Hemisphere. Panel 4 − H+ ion density (black); O+ ion density (red). Panels 5 to 7 − O+ ion flux
spectrogram versus pitch angle for the energy intervals 200–1000 eV, 1–10 keV and 10–38 keV, respectively. Also here a pitch angle of 0◦
corresponds to upgoing and 180◦to downgoing ions. Next to last panel − Electric field component normal to the structure and pointing
equatorwards (black line); Calculated perpendicular potential (green line). Bottom panel - Field-aligned current distribution, with blue color representing upflowing currents and red color downflowing currents. (b) Left panel – Ion flux spectrogram versus energy for the O+ upgoing
2536 S. Figueiredo et al.: Temporal and spatial evolution of discrete auroral arcs
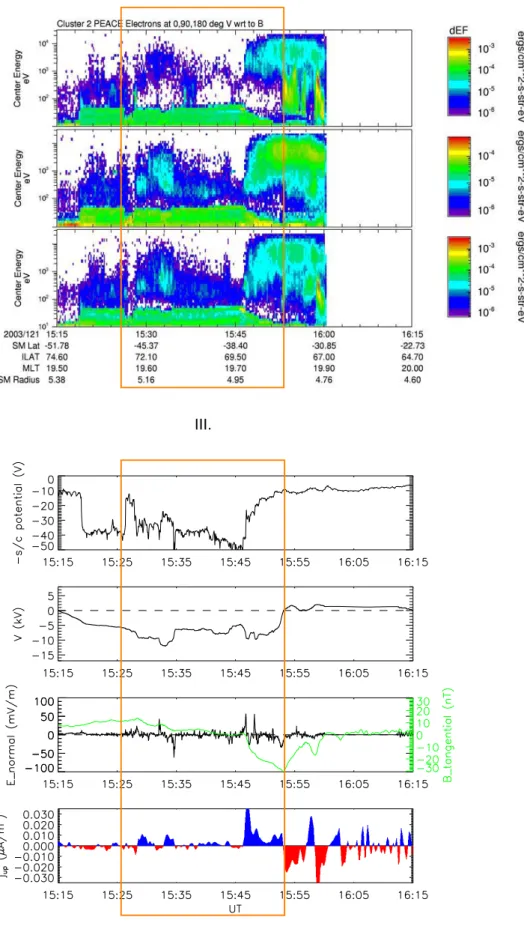
III.
electron energy flux, as shown by the spacecraft potential and by the electron energy flux spectrograms, reflecting the dy-namic nature of this layer.
The two negative potential structures detected in the pre-vious passage have evolved. Structures I and II now have merged into one broad, negative potential structure (struc-ture III, Fig. 4), ∼530 km wide (mapped to the ionosphere), with a perpendicular potential drop maximizing at ∼10 kV at the edges of the structure.
Structure III corresponds to a region of mainly upward flowing FACs. The maximum FAC density is measured at the PSBL/PS density gradient, and is about 4µA/m2mapped to the ionosphere.
In a similar way to what was observed in the previous pas-sage for structures I and II, a lack of upflowing electrons is also seen here at the edges of the potential structure III, where the perpendicular electric field is most intense. No CIS ion data exists for Cluster spacecraft 2. Data from the next cross-ing by spacecraft 4 are shown in Fig. 5. The PSBL/PS bound-ary was crossed by spacecraft 4 at 16:10 UT, nearly 40 min after spacecraft 1 passed across this boundary.
The broad negative potential structure detected by space-craft 2 when crossing the PSBL into the PS, now appears broader and for the equatorward half also deeper (structure III, Fig. 5). The maximum potential drop is ∼15 kV, collo-cated with the density gradient between the PSBL and the PS. The PSBL/PS boundary and the associated density gra-dient appears less steep for this passage, as compared to the previous passages.
Collocated with the PSBL/PS boundary, at ∼16:10 UT, an inverted-V-like structure is identified in the energy spectra of the precipitating electrons (panel 3, Fig. 5). Note that space-craft 4 is flying at lower altitudes (3.59 Earth radii altitude), as compared to spacecraft 2 (3.93 Earth radii altitude) and 1 (4.17 Earth radii altitude).
Spacecraft 3 crossed this inverted-V structure at an alti-tude of ∼3.92 Earth radii, 1703000 after spacecraft 4. Data measured by spacecraft 3 are plotted in Fig. 6. The data are plotted using the same format as in Fig. 2, except for the spacecraft potential which is not shown here since the AS-POC (Active Spacecraft POtential Control) instrument was on, imposing a constant low potential value to the spacecraft, in order to make possible the measurement of the flux of low-energetic ions.
A clear inverted-V-like distribution for the precipitating electrons, with maximum average energy of about 800 eV, is measured by spacecraft 3, at the PS boundary. Thus, space-craft 4 and 3 flew below this relatively weak acceleration re-gion, detecting downward accelerated inverted-V-like elec-trons.
Figure 6 also shows that the broad negative potential struc-ture detected by spacecraft 2 and 4 (strucstruc-ture III), appears for spacecraft 3 still as a broad, negative potential structure but with less intense electric field variations. The maximum po-tential drop is ∼12 kV and corresponds to an unipolar electric field peak detected at the density gradient of the PS poleward boundary.
Associated with the convergent potential structure III, spacecraft 4 and 3 measure a region of mainly upward flow-ing FACs, peakflow-ing at the density gradient of the PS bound-ary, with mapped intensities of 2.4 µA/m2 and 1.2 µA/m2, respectively.
The analysis of the temporal evolution of this event also reveals the dynamic nature of the PSBL. The density of the PSBL and the flux of energetic electrons in this region are seen to vary significantly from the first to the last passage. While spacecraft 1 detects a clear and broad signature of the PSBL, spacecraft 3 detects a region of mainly a few hundred eV spatially homogeneous electron precipitation, character-istic of the polar rain precipitation along open field lines into the PC, and only a very weak signature of the PSBL (more energetic electrons) in the poleward part of the indicated re-gion III (Fig. 6).
The electron energy flux spectrogram presented in Fig. 2 for the crossing of spacecraft 1, shows for the most equator-ward portion of the observed structure I (broad negative po-tential structure), a predominance of downflowing electrons, whereas the FAC is mainly downward directed in this region. This incoherence between the potential profile, and the asso-ciated FAC density and electron energy flux distributions, is believed to be related to temporal variations associated with the thinning of the PSBL, which is most pronounced at the edges. Note that regions of downflowing FACs were also detected by the other Cluster spacecraft, at the edges of the PSBL, imbedded in negative potential structures.
Figures 7 and 8 show CIS ion data corresponding to the passages of Cluster spacecraft 4 and 3, respectively. These figures have the same display format as Fig. 3a. Spacecraft 4 detected collimated beams of upgoing O+ ions located at the edges of structure III, with the most energetic beam (10– 30 keV) collocated at the PSBL/PS density gradient, where the perpendicular potential is seen to maximize (15 kV). A spatial energy structuring of the upflowing O+ ion beams is seen at this boundary, reflecting a finger-like structuring of the potential structure. Collimated upflowing 1–10 keV en-ergetic H+ ion beams are also detected along structure III.
Associated with the crossing of the PC region, spacecraft 3 shows an absence of significant ion flow (Fig. 8). Collocated with the PS boundary and with the inverted-V-like distribu-tion of downflowing electrons (peak energy of ∼800 eV), beams of upgoing O+ ions with energies between 200 eV and 10 keV are detected. The potential drop calculated along the orbit is in this region ∼12 kV. These observations show ev-idence of a distribution of the parallel acceleration region, both below and above the spacecraft, with a potential drop of about 1 kV above, and about 10–11 kV below the spacecraft. The auroral electrojet (AE) index shows, for the period of this event, an intensification located at the end of the recov-ery phase of a relatively strong substorm. The geostationary spacecraft 1994–084 detected at 13:30 UT an enhancement of the flux of energetic electrons, close to the magnetic mid-night. The observed particle injection is an indicator that a substorm onset occurred at 13:30 UT, approximately 2 h be-fore the crossing by Cluster spacecraft 1. This confirms that
2538 S. Figueiredo et al.: Temporal and spatial evolution of discrete auroral arcs
III.
III.
Fig. 6. Event 1 − data measured on board Cluster spacecraft 3. The description of the panels is the same as for Fig. 2. The spacecraft potential is not plotted for this passage.
2540 S. Figueiredo et al.: Temporal and spatial evolution of discrete auroral arcs
III.
III.
2542 S. Figueiredo et al.: Temporal and spatial evolution of discrete auroral arcs
Fig. 9. Mapped location of the PS poleward boundary for Event 1 (asterisks). The color lines show the mapped orbit of the Cluster spacecraft. Black color corresponds to spacecraft 1, red to space-craft 2, green to spacespace-craft 3 and blue to spacespace-craft 4. The diamonds mark the start point of each passage.
Fig. 10. Configuration of the Cluster spacecraft on 3 May, 23:00−4 May, 01:00 UT. Spacecraft 1 is represented by black, spacecraft 2 by red, spacecraft 3 by green and spacecraft 4 by blue color.
this event occurred during the end of the substorm recovery phase. The geomagnetic activity was low (0+ Kpindex).
The interplanetary magnetic field (IMF) pointed south-ward with an intensity of 1.7 nT during the passage of space-craft 1. During the passage of spacespace-craft 2, the southward
component of the IMF has decreased to 0.5 nT intensity (at 15:40 UT), and remained so during the spacecraft 4 passage until the end of the passage of spacecraft 3 (16:40 UT), when it turned to a northward directed component with an intensity of 1.8 nT.
Making use of the multi-spacecraft measurements, the spatial evolution of the described potential structure and of the coupled PS region can be analyzed. The mapped location of the PS poleward boundary is plotted in a corrected geo-magnetic latitude (CGLat) and geo-magnetic local time (MLT) diagram in Fig. 9. The asterisks represent the mapped loca-tion of this boundary and the color lines represent the mapped orbit of each Cluster spacecraft. Black color corresponds to spacecraft 1, red to spacecraft 2, green to spacecraft 3 and blue to spacecraft 4. The diamonds mark the starting point of each passage.
This plot shows that all the Cluster spacecraft encountered the poleward boundary of the PS, and the collocated equa-torward edge of the potential structure, at approximately the same position.
3 Event 2 – 3 May 2003 – Temporal and spatial analysis
Figure 10 shows the configuration of the Cluster spacecraft between 23:00 UT on 3 May and 01:00 UT on 4 May 2003. Spacecraft 1 to 4 are represented by black, red, green and blue color, respectively. Aligned nearly as pearls on a string, the Cluster spacecraft crossed the evening MLT sector of the Southern Hemisphere auroral oval, moving equatorwards, at an altitude of 4.5 to 5 Earth radii.
During the time period between 23:42 UT on 3 May, and 00:35 UT on 4 May, the mapped ionospheric footpoint of the Cluster spacecraft was in good conjunction with the field of view of the All Sky Imager (ASI) located at the South Pole station. Between 00:11 and 00:14 UT on 4 May, the DMSP F13 spacecraft also crossed the field of view of the South Pole All Sky Imager, flying at an altitude of ∼860 km.
Figure 11 shows the paths of Cluster spacecraft 1, 2 and 4, as well as that of the DMSP F13 spacecraft, overlaid on an ASI auroral image recorded at 00:10:58 UT, on 4 May. The path of the DMSP F13 spacecraft is plotted with a green line. The Cluster spacecraft 1, 2 and 4 are plotted with gray, red and blue lines, respectively. No data exist from Cluster spacecraft 3 for this event.
The ASI images included in this paper were mapped to an ionospheric altitude of 120 km and are presented in cor-rected geomagnetic latitude (CGLat) and magnetic local time (MLT) coordinates, looking down the South Pole. The images correspond to emissions in the oxygen green line (557.7 nm).
On board the DMSP F13 spacecraft, the OLS (Operational Linescan System) instruments record visible and infrared imagery along a 3000 km scan, providing global coverage twice per day. In Fig. 12, an OLS nighttime image, taken in the visible range, is shown, together with DMSP F13 particle
data for the period between 00:10:50 and 00:12:49 UT, and two ASI images taken at 00:10:58 and 00:12:40 UT.
Figure 12a shows a side-by-side montage of two se-quential OLS nighttime visible images taken on board the DMSP F13 spacecraft at 23:59:19 UT (right half part) and at 00:12:03 (left half part). The green line represents the DMSP F13 spacecraft path, and the circular lines are cor-rected geomagnetic latitude lines. The first panel of Fig. 12b shows in black (red) the logarithm of the electron (ion) en-ergy flux. The logarithm of the average enen-ergy of the elec-trons (ions) is plotted in the second panel in black (red). The third panel shows the electron energy flux spectrogram, and the last panel the ion energy flux spectrogram, versus en-ergy. The DMSP F13 spacecraft measures particle flux only in one direction, since the detector aperture is pointed in the direction of the vector connecting the Earth’s center with the spacecraft. Figure 12c shows a sequence of two ASI images recorded at 00:10:58 and at 00:12:40 UT. The corresponding locations of the DMSP F13 spacecraft are plotted on these images with a green square.
The DMSP F13 images show a surge-type aurora com-posed of a broad region of intense aurora − the surge re-gion (marked as rere-gion 1), and by a thin and elongated in-tense auroral arc extending westwards − surge horn region (marked as region 2). The DMSP F13 spacecraft is moving northwards, and crosses first the surge region (region 1), and subsequently the surge horn (region 2). The electron energy spectrogram shows a clear, inverted-V-like distribution be-tween 00:11:01 and 00:11:56 UT (region 1), ∼315 km wide (mapped to the ionosphere), associated with the accelerated precipitating electrons, creating the discrete aurora of the surge region. Between 00:12:33 and 00:12:41 UT, a smaller-scale, intense, inverted-V structure (region 2), ∼50 km wide (mapped to the ionosphere), is seen associated with the pas-sage through the edge of the surge horn. The electron energy flux (panel 1, Fig. 12b) reaches, at the edges of the surge horn region (region 2), almost an order of magnitude higher val-ues than in the broader surge region (region 1). The average electron energy is ∼10 keV in both regions.
When combining the information from the DMSP im-ages and the particle data with the ASI imim-ages (Fig. 12c), a relatively consistent picture emerges, although region 1, which is clearly visible in the DMSP images and in the particle data, cannot be clearly seen in the ASI image at 00:10:58 UT. A broad region of relatively intense auroral emissions is present near the footpoint of the DMSP F13 spacecraft around 00:10:58 UT (region 1 − surge region), and a smaller-scale region of more intense auroral emissions is present around 00:12:40 UT, seen at the footpoint of the DMSP F13 spacecraft (region 2 − the surge horn).
Magnetic field data measured by the vector magnetometer SSM (Special Sensor Magnetometer) on board the DMSP F13 spacecraft, is plotted in Fig. 13, for the period between 00:10 and 00:14 UT. The IGRF model’s magnetic field was subtracted from the measured magnetic field. In the first panel, the westward magnetic field component is plotted.
South Pole 2003-05-04 00:10.58UT(5577AA)
-1000 -500 0 500 1000 Distance (km) -1000 -500 0 500 1000 Distance (km) -1000 -500 0 500 1000 Distance (km) -1000 -500 0 500 1000 Distance (km)
South Pole 2003-05-04 00:10.58UT(5577AA)
-85 -80 -75 -75 -70 -70 -65 -1000 -500 0 500 1000 Distance (km) -1000 -500 0 500 1000 Distance (km)
South Pole 2003-05-04 00:10.58UT(5577AA)
18 19 19 20 20 21 21 22 22 23 2000 4000 6000 8000 10000 Rayleigh
Fig. 11. Paths of the DMSP F13 and of the Cluster spacecraft over-laid on an ASI auroral image recorded at 00:10:58 UT, 4 May. DMSP F13 is represented with green color, Cluster spacecraft 1 with gray, spacecraft 2 with red and spacecraft 4 with blue color. No data exists for Cluster spacecraft 3 for this event.
The second panel shows the magnetic field component point-ing towards the equator.
A typical current signature characteristic of the surge re-gion is identified between 00:10:30 and 00:12:10 UT, with a downward current region (R0) observed poleward of a net upward current region (R1). When crossing the surge horn region, a system of an upward region 1 current and a ward region 2 current is observed, equatorward of a down-ward region 0 current. These observations are consistent with the results reported by Fujii et al. (1994) on the characteris-tics of a generic bulge-type auroral emission region.
The auroral magnetic field lines mapping to the middle part of the surge horn region were crossed by the Cluster spacecraft between 23:54 UT on 3 May, and 00:35 UT on 4 May. Making use of the Cluster multi-spacecraft measure-ments, combined with the conjugated ASI auroral images, the motion and the temporal evolution of this region can be analyzed.
In Fig. 14, a sequence of ASI images recorded between 23:56:09 and 00:10:58 UT is shown. The location of the Cluster spacecraft 1 is marked with a gray circle, spacecraft 2 with a red circle and spacecraft 4 with a blue circle. The mapped location of the DMSP spacecraft is marked with a green square.
Note that prior to 00:10:58 UT a region of auroral activity is seen in several of the images in the region marked as region 1 in Fig. 12c (left image), which supports the picture that a broad region of surge aurora was also present at 00:10:58 UT, although not clearly visible in the image at this time.
Through analysis of the sequence of images shown in Fig. 14, the surge horn region is seen to move poleward with
2544 S. Figueiredo et al.: Temporal and spatial evolution of discrete auroral arcs 80° 75° 70° 65° (a) (b) (c) 1 2
Fig. 12. (a) Side-by-side montage of two sequential OLS nighttime visible images, taken on board the DMSP F13 spacecraft, at 23:59:19 UT, 3 May 2003 (right half part) and at 00:12:03, 4 May 2003 (left half part). (b) DMSP particle data for the time period between 00:10:50 and 00:12:49 UT. Panel 1 − The logarithm of the electron (ions) energy flux is plotted in black (red). Panel 2 − Average energy of the electrons (ions) in black (red). Panel 3 − Electron energy flux spectrogram versus energy. Panel 4 − Ions energy flux spectrogram versus energy. (c) Images recorded at 00:10:58 and 00:12:40 UT by the South Pole All Sky Imager. The green square represents the location of the DMSP F13 spacecraft.
West
Equator
Surge Surge horn
R0 R1 R0 R1 R2
Fig. 13. Magnetic field data measured on board the DMSP F13 spacecraft between 00:10 and 00:14 UT, 4 May. The IGRF model field was subtracted from the measured field. First panel − mag-netic field component pointing towards the west. Second panel − magnetic field component pointing towards the equator.
a velocity of approximately 0.5 km/s relative to the Earth’s frame.
Figure 15 shows data from the Cluster spacecraft 1 mea-sured between 23:42 and 00:10 UT. This figure has the same format as that previously presented for Fig. 2.
A sharp density gradient is detected by the Cluster space-craft 1 at 23:55 UT, associated with the boundary crossing into the PS region, as inferred from the electron energy distri-bution spectra and from the spacecraft potential profile (pan-els 1 to 4).
Intense bipolar convergent electric field variations, with mapped peak intensity of ∼1350 mV/m, are detected at the PSBL/PS density gradient (structure I). A region of upward flowing FACs, 30 km wide (mapped to the ionosphere) and with mapped peak intensity of ∼11 µA/m2, is seen, associ-ated with structure I. Locassoci-ated immediately poleward of struc-ture I, a small-scale region of downward flowing FACs (R0), is seen. Equatorward of structure I, fine-scale structuring is seen both in the electric field and in the FAC density, with the downward flowing FAC component increasing in inten-sity (R2).
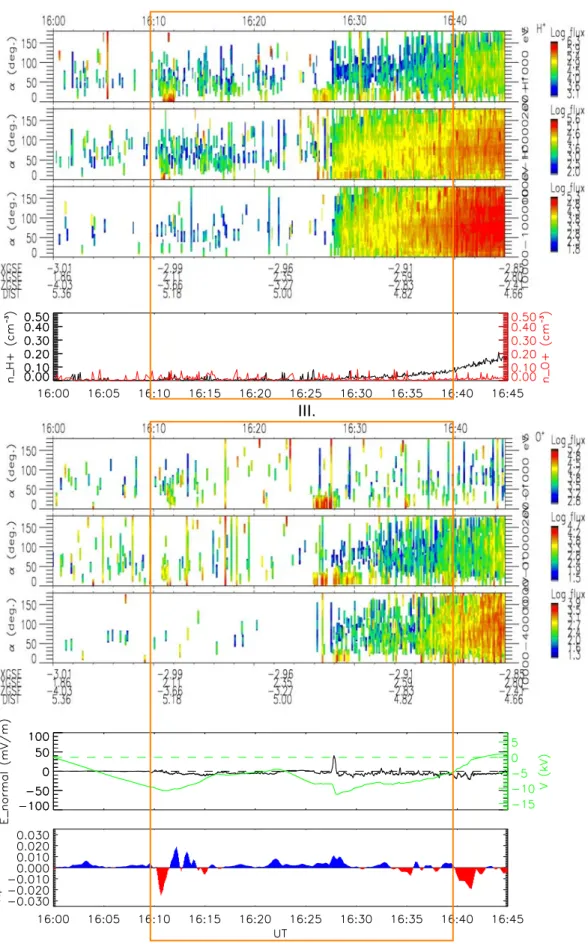
Figure 16 shows H+ and O+ ion data measured by the CIS instrument on Cluster spacecraft 1. The description of the panels is the same as that presented for Fig. 3a.
The spacecraft entrance into the PS region detected at 23:55 UT is evident from the increase seen in the H+ and O+ omnidirectional ion fluxes, and from the significant increase seen in the H+ ion density.
No clear upflowing beams of accelerated O+ ions are de-tected, associated with structure I, crossed by spacecraft 1, between 23:57 and 00:08:30 UT. Possible upward acceler-ated H+ ions may be hidden in the high flux of omnidirec-tional H+ ions, characteristic of the PS region.
The ASI images presented in Fig. 14 show that the mapped location of the Cluster spacecraft 1 (gray circle) is slightly poleward of the region of intense auroral emissions before 00:04:07 UT. This appears unexpectedly, since the intense convergent electric field variations (structure I), coupled with intense upflowing FACs, are measured between 23:55 and 23:59 UT, i.e. well before 00:04:07 UT.
This apparent mismatch, seen when comparing the ASI auroral images with the conjugated data, measured on board the Cluster spacecraft 1, may result from the following: (1) Errors when mapping the Cluster spacecraft location. The Cluster spacecraft are flying at an altitude of 4–5 Earth radii. The International Geomagnetic Reference Field (IGRF) model is used to map the location of the Cluster spacecraft down to the ionosphere. Errors may derive from the application of this global model to specific event studies. (2) Errors when mapping the location of the auroral emission regions. Due to the ambiguity in separating the altitude of, and the range to, the auroral emission regions, in an ASI im-age, there are errors associated with the determination of the radial distance to the auroral emission regions. Major diffi-culties appear when the auroral emission regions are located far from magnetic zenith. Note that the determination of the azimuthal location of the auroral emission regions is not af-fected by this uncertainty.
The mismatch of ∼3–4◦, between the location of the Clus-ter spacecraft 1 and the auroral arc structure seen in the ASI image recorded at 23:56:09 UT (first image of Fig. 14), may derive from the combination of the two sources of errors mentioned above. Thus, we emphasize that the region of up-flowing FACs measured by the Cluster spacecraft 1 between 23:55 and 23:57 UT (structure I, Fig. 15), must correspond to the surge horn auroral structure seen in the ASI images of Fig. 14 and in the DMSP image of Fig. 12a. Poleward of the upward FAC region (region 1 current), a small-scale region of downflowing FACs was identified, the so-called region 0 current, also identified by the DMSP F13 spacecraft when crossing the eastern part of the surge horn region (Fig. 13).
Figure 17 shows data measured on board Cluster space-craft 2 between 23:42 and 00:27 UT. This figure has the same format as Fig. 2. At 00:02 UT spacecraft 2 detects a steep density gradient, as seen in the spacecraft potential profile (panel 4). The electron energy flux spectrogram shows a few hundred eV spatially homogeneous electron precipita-tion, typical of the polar rain. Spacecraft 2 is thus likely to be crossing open magnetic field lines connecting the mag-netic tail lobes to the polar cap. After 00:02 UT, spatially homogeneous precipitation of hot electrons is detected, iden-tifying this region with the PS. No clear signature of a PSBL in between the PC and the PS is identified in this passage.
Associated with the crossing of the PC/PS boundary, spacecraft 2 measures an intense bipolar electric field (∼670 mV/m mapped intensity) associated with an intense upflowing FAC (∼16µA/m2 mapped peak intensity), be-tween 00:02 and 00:05 UT (structure I, Fig. 17). This struc-ture corresponds to a negative and asymmetric U-shaped
2546 S. Figueiredo et al.: Temporal and spatial evolution of discrete auroral arcs
Fig. 14. Sequence of ASI images recorded between 23:56:09 and 00:19:31 UT. The mapped location of Cluster spacecraft 1 is marked with a gray circle, spacecraft 2 with a red circle and spacecraft 4 with a blue circle. The mapped location of the DMSP F13 spacecraft is marked with a green square.
potential structure, 35 km wide, with a potential drop of
∼8 kV .
The ASI image recorded at 00:04:07 UT, shown in Fig. 14 (third image), shows a mismatch of ∼3−4◦ between the spacecraft 2 mapped location (red circle) and the auroral arc structure. This mismatch is about the same as for spacecraft 1 discussed above. Thus, the structure characterized by an intense upflowing FAC (structure I, Fig. 17) corresponds to the intense surge horn auroral arc structure seen by the South Pole All Sky Imager at 00:04:07 UT. The ASI images show that the auroral arc structure has fine structure imbedded and is very dynamic on a timescale of minutes. Fine-scale
struc-ture is also present in the corresponding potential profile shown in Fig. 17: a thin, positive potential structure is de-tected by spacecraft 2 between ∼00:05 and 00:06 UT (struc-ture II), associated with downflowing FACs; after 00:06 UT spacecraft 2 encounters a negative potential structure asso-ciated with upflowing FACs (structure III). At 00:10:58 UT (image 6, Fig. 14), spacecraft 2 is thought to be already out-side the auroral arc structure region, reflecting the weaker FACs and electric field variations measured. No CIS ion data exists for the passage of Cluster spacecraft 2.
Spacecraft 4 crosses the PC/PS density gradient at 00:17 UT, 15 minutes after spacecraft 2 crossed this
I.
2548 S. Figueiredo et al.: Temporal and spatial evolution of discrete auroral arcs
I.
Fig. 16. CIS ion data for Event 2 measured on board Cluster spacecraft 1. The description of the panels is the same as for Fig. 3a.
boundary. Figure 18 shows data measured on spacecraft 4. The display format is the same as for Fig. 2.
Figure 19 shows a sequence of ASI images recorded be-tween 00:16:06 and 00:29:47 UT. The mapped location of Cluster spacecraft 1 is marked with a gray circle, spacecraft 2 with a red circle and spacecraft 4 with a blue circle.
Note that the auroral arc structure is now located at higher latitudes, close to the South Pole All Sky Imager’s zenith, where the mapping errors are smaller. The auroral arc struc-ture is now at the best location to be observed by the South
Pole All Sky Imager, and to be measured by the Cluster spacecraft 4. A conjunction study is now ideal.
Image 1 and 2 of Fig. 19 show that spacecraft 4 (blue circle) encounters the auroral arc structure between 00:16 and 00:17:48 UT. At ∼00:17:30 UT an intense upflowing FAC (∼20µA/m2 mapped peak intensity), 40 km wide, is measured by spacecraft 4, associated with a bipolar elec-tric field and superposed fine-scale variations of 650 mV/m mapped peak intensity, and a corresponding ∼12 kV per-pendicular potential drop (structure I, Fig. 18). This occurs
I. II. III.
2550 S. Figueiredo et al.: Temporal and spatial evolution of discrete auroral arcs
I. II. III.
Fig. 19. Sequence of images recorded by the South Pole All Sky Imager, between 00:16:06 and 00:29:47 UT. The mapped location of Cluster spacecraft 1 is marked with a gray circle, spacecraft 2 with a red circle and spacecraft 4 with a blue circle.
simultaneously with the crossing of the PC/PS density gradi-ent by spacecraft 4.
At about 00:20 UT, a positive potential structure was de-tected (structure II, Fig. 18) presumably associated with a region of weak auroral emissions seen to the left of the foot-point of spacecraft 4 (image 3, Fig. 19). Between 00:22 UT and 00:24 UT, a region of negative potential associated with upflowing FACs is detected (structure III), presumably asso-ciated with the region of strong auroral emissions seen at the footpoint of spacecraft 4 in image 5. The poleward expansion of the auroral structure seems to have ended after 00:29 UT, as indicated by image 6. A less structured and thinner aurora
is now seen. Spacecraft 4, is at this stage located outside the main auroral emission region, which agrees with the small activity in terms of electric field variations and FACs mea-sured.
Note that a downward region 0 current is also detected by spacecraft 4 poleward of the intense upflowing FAC in region I, as also observed by the previous spacecraft.
In Fig. 20 H+ and O+ ion data is shown, measured by the CIS instrument on Cluster spacecraft 4. The description of the panels is the same as for Fig. 3a. A broad region of up-flowing H+ and O+ ion beams with energies between 1 and 40 keV, is seen extending over structures I, II, and III.
2552 S. Figueiredo et al.: Temporal and spatial evolution of discrete auroral arcs
I.
II.
III.
For a 10-keV energetic O+ ion, 1 min approximately is the travelling time between the auroral acceleration region (here assumed to be located at 1.5-Earth radii altitude) and the Cluster spacecraft 4 location (4.6 Earth radii altitude). A 1 keV O+ ion takes about 3 min to travel through the same distance. A delay of approximately 3 min is indeed seen between the detection of >10 keV O+ upflowing ions, and
<10 keV O+ upflowing ions, as seen in Fig. 20, panels 7 and 6, respectively. For the lighter H+ ions, the difference between the travelling times of the low (<10 keV) and the high (>10 keV) energetic upflowing ions is less than 1 min, and thus no delay is seen between the corresponding energy spectra in panels 2 and 3.
The geostationary spacecraft LANL-01A detected at 23:30 UT on 3 May an enhancement of the flux of energetic electrons, close to magnetic midnight. This observed particle injection indicates that substorm onset occurred at 23:30 UT, and that Event 2 discussed here took place in the expansion phase of the associated substorm.
Between 00:30 and 00:33 UT a signature of “pitch-angle dispersion” of energetic O+ ions is observed, as shown by the O+ ion flux spectrograms of Fig. 20. These ions originate possibly from the observed substorm particle injection (note the sudden increase in the O+ ion density at 00:30 UT), and the “pitch-angle dispersion” signature reflects a change, from inflow to outflow, of the flow direction of the O+ ions.
The interplanetary magnetic field (IMF) pointed north-ward, with an intensity of 0.2 nT during the time period of Event 2. A change to a southward directed component with an intensity of 0.7 nT occurred at 00:40 UT, after the last boundary crossing by Cluster spacecraft 4 in Event 2. The
Kp index is 2+ for the period of this event, indicating
rela-tively low geomagnetic activity conditions.
As for Event 1, also in Event 2, the observed auroral arc structure is seen to be closely related to the poleward ary of the PS region. The CGLat/MLT location of this bound-ary, as observed by the different Cluster spacecraft, is shown in Fig. 21. The PS boundary location is marked using aster-isks and the color lines represent the mapped orbit of the dif-ferent Cluster spacecraft. Black color corresponds to space-craft 1, red to spacespace-craft 2 and blue to spacespace-craft 4. The diamonds mark the start point of the spacecraft’ paths. This plot indicates that the PS and the surge horn region moved poleward with a mapped average velocity of 0.45 km/s. This value is in good agreement with the estimated velocity of 0.5 km/s obtained from the analysis of the ASI images for the poleward motion of the surge horn region.
4 Discussion and conclusions
Two auroral events from May 2003, encountered by the Clus-ter spacecraft at altitudes between 3.5 and 4.7 Earth radii, above the Southern Hemisphere auroral region, are discussed with emphasis on electric field, field-aligned current, electron and ion characteristics. Both events occurred at the poleward boundary of the PS in the evening local time sector and were
characterized by intense perpendicular electric field varia-tions (up to ∼1350 mV/m mapped intensity) associated with negative potential structures and with upward field-aligned currents and upward ion beams.
Table 1 summarizes the main properties of Event 1, de-scribed in Sect. 2. The values presented for the FAC inten-sity and for the width of the structures correspond to values mapped to the ionosphere.
Event 1 occurred at the end of the recovery phase of a strong substorm, with onset taking place approximately 2 h before the Cluster spacecraft 1 oval crossing. The Clus-ter observations for Event 1 are initially characClus-terized by a broad, negative potential structure detected in the PSBL (structure I) and a more narrow and deep negative potential structure detected at the PSBL/PS density gradient (structure II). This system of potential structures changes dynamically in shape and in magnitude as time evolves: structures I and II merge, forming a broad, negative potential structure (struc-ture III), which then further broadens and intensifies at the poleward boundary of the PS. These dynamic changes occur on a timescale of tens of minutes. At the time of the last Cluster crossing (approximately 1 h after Cluster spacecraft 1), the large-scale negative potential structure (structure III) has become weaker and the associated PSBL much thinner.
Despite the changes in shape and in magnitude of the po-tential structure described in Event 1, its equatorward edge at the poleward boundary of the PS region remains fairly sta-ble in space. The stasta-ble location of this boundary and of the associated electric field and upward FAC reflects the rel-atively quiet auroral conditions prevailing during the Cluster crossings at the end of the substorm recovery phase. The slightly more poleward location of the boundary experienced by spacecraft 3 possibly reflects the change to a northward IMF direction that took place during this crossing.
Upward accelerated O+ ion beams were measured at the PS poleward boundary associated with the strongest potential drops and with the most intense upflowing FACs. A good consistency was seen between the measured energy of the upward accelerated ions and the perpendicular potential.
An inverted-V-like electron distribution, with maximum average energy of about 800 eV, was observed by spacecraft 3 at an altitude of 3.92 Earth radii. This observation indicates that the uppermost part of the auroral acceleration region ex-tends beyond ∼3.9 Earth radii altitude for Event 1.
The comparison of the energy flux spectrograms of the precipitating electrons and of the upgoing electrons showed a characteristic lack of upgoing electrons at the edges of the potential structures. The loss of energy by the precipitating electrons through excitation and ionization of neutral parti-cles when entering the dense ionosphere may explain the lack of upgoing electrons observed at high altitudes. The elec-trons that do not escape through the loss cone are reflected by the mirror force but may not have sufficient energy to over-come the potential barrier of the upward acceleration region encountered at higher altitudes. The fact that the energy loss by the precipitating electrons seems to be more significant at the edges of the potential structures indicates a higher energy
2554 S. Figueiredo et al.: Temporal and spatial evolution of discrete auroral arcs
Fig. 21. Mapped location of the PS poleward boundary for Event 2 (asterisks). The color lines show the mapped orbit of the Cluster spacecraft. Black color corresponds to spacecraft 1, red to space-craft 2 and blue color to spacespace-craft 4. The diamonds mark the start point of each passage.
Table 1. Event 1 - Summary of the main properties. The values presented for the FAC intensity and for the width of the structures correspond to mapped values.
I II III (Result) PSBL PSBL/PS C1 270 km 68 km 4.27 RE ≈9 kV ≈10 kV 3 µA/m2↑ 3 µA/m2↑ PSBL; PSBL/PS C2 530 km 3.93 RE 10 kV +16’30” 4 µA/m2↑ PSBL; PSBL/PS C4 910 km 3.59 RE ≈15 kV +39’30” 2.4 µA/m2↑ inverted-Ve−structure PC/PS C3 − 3.92 RE ≈12 kV +57’ 1.2 µA/m2↑ inverted-Ve−structure
conversion rate at the ionospheric ends of the magnetic field lines associated with the edges of the potential structures. Note that the perpendicular electric field is also strongest at the edges, and temporal fluctuations of the electric and the magnetic fields may be more significant at the edges of the auroral arc structures, possibly leading to an increase of the energy dissipated into the ionosphere.
Table 2. Event 2 - Summary of the main properties. The values presented for the FAC intensity and for the width of the structures correspond to mapped values.
I II III PSBL/PS C1 30 km 4.68 RE 8 kV 11 µA/m2↑ PC/PS PS PS C2 35 km 20 km 85 km 4.66 RE 8 kV 3 kv 3 kV
+7’ 16 µA/m2↑ 11 µA/m2↑ 16 µA/m2↑
PC/PS PS PS
C4 40 km 45 km 135 km
4.54 RE 12 kV 4 kV 6 kV
+22’ 20 µA/m2↑ 3 µA/m2↑ 5 µA/m2↑
Eastman et al. (1984) identified the PSBL as a spatially distinct, although temporally variable, transition between the magnetotail lobes and the central plasma sheet. The dynamic nature of the PSBL is illustrated in Event 1. The Cluster spacecraft observed the PSBL thickness to decrease until it almost totally disappeared in a time interval of ∼1 h. The dynamic nature of the PSBL appears more pronounced at its edges, where incoherences in terms of the quasi-static de-scription of the potential profile and the associated FAC den-sity distributions were observed.
In Sect. 3, the temporal and spatial evolution of an au-roral arc structure (Event 2) was described on the basis of the combined analysis of Cluster multi-spacecraft measure-ments, conjugated auroral images observed by the South Pole All Sky Imager, and DMSP images, and particle and mag-netic field data. The analysis of particle data and images obtained by the DMSP F13 spacecraft when crossing the au-roral arc structure in Event 2 allowed us to identify this as the surge horn of a large-scale surge-type aurora expanding poleward in the premidnight MLT sector. Table 2 summa-rizes the main properties of Event 2. The values presented for the FAC intensity and for the width of the structures also correspond here to values mapped to the ionosphere.
Event 2 develops under the expansion phase of a substorm, with onset taking place roughly 30 min before Cluster space-craft 1 passed above the arc structure. The PS region moved poleward, consistent with the poleward expansion of the au-roral oval during the expansion phase of a substorm.
The Cluster multi-spacecraft measurements show clearly that the surge horn region was associated with the PS pole-ward boundary, where the most intense electric field varia-tions and FACs densities were also encountered. The surge horn region also moved poleward closely tied to the large-scale poleward motion of the PS region at a velocity of about 0.5 km/s.
How does the ionospheric conductivity respond to the large-scale poleward expansion of the auroral oval during the expansion phase of a substorm? In a study by Rothwell et al. (1984), a model for the propagation of the westward traveling surge under both the expansion and the recovery phases of a magnetic substorm was presented. The authors concluded that the precipitating electrons at the conductivity gradient modify the gradient, causing it to propagate as a wave front. The velocity of propagation was seen to directly depend on the incident electron energy, and the direction of propagation on the efficiency by which the poleward ionospheric currents are closed into the magnetosphere by field-aligned currents.
The poleward motion of the surge horn region character-izing Event 2, is according to this model, explained by an excess of upward FACs and of negative polarization charges at the poleward surge boundary. Together with the poleward motion, the surge horn region also undergoes temporal dy-namic changes, both in shape and in magnitude, in terms of auroral emissions and potential structure. At the first pas-sage, a 30-km wide region of upward directed FACs is mea-sured (structure I), coupled to rather intense auroral emis-sions observed by the South Pole All Sky Imager at the mag-netic footpoint of the Cluster spacecraft 1. The surge horn is first a multiple arc structure, as shown by the multiple bipo-lar electric field variations measured by the Cluster space-craft 1 at the PSBL/PS boundary. Spacespace-craft 2 and 4 ob-served these small-scale bipolar electric field structures to merge, and the associated FAC density to intensify at this boundary. During the time interval of about 20 min separat-ing the passages of spacecraft 1 and 4, the upward FAC den-sity associated with this auroral arc structure became twice as large, the associated potential drop increased from 8 to 12 kV, and the width of this structure increased slightly from 30 to 40 km. Equatorward of this auroral arc structure, a region ab-sent of auroral emissions (region of mainly downward FACs) was detected (structure II), followed by a broader auroral re-gion (mainly upward FACs), but associated with a relatively weaker potential drop (structure III).
No clear signature of upflowing ion beams was detected by Cluster spacecraft 1 above the auroral arc associated with structure I. A number of explanations for this absence of up-flowing ions can be found, one of which is the E×B drift the O+ ions experience during the field-aligned transport from the acceleration region to the observation point. Note that the measured electric field was, for this passage, very intense (1350 mV/m mapped peak intensity). Another possible ex-planation is that the extraction of ionospheric O+ ions has emptied the available supply of ions in the flux tube crossed by spacecraft 1. When spacecraft 4 encounters this auroral arc structure at a later moment and at another location, colli-mated upflowing O+ and H+ ion beams are detected, show-ing a good consistency between the measured energy of the upward accelerated ion beams and the integrated potential. Cases of auroral arc structures not accompanied by ion out-flows were also reported by Wahlund et al. (1992).
The dynamic nature of the PSBL is also reflected in Event 2. The PSBL disappeared in a time period of ∼17 min,
separating the crossings by Cluster spacecraft 1 and 2. As-sociated with the dispersionless substorm particle injection detected by the LANL-01A spacecraft coupled to the sub-storm expansion phase onset characterizing Event 2, a sig-nature of magnetic field dipolarization occurring in the tail was detected by the spacecraft GOES12, 30 min later. The GOES12 spacecraft was located at (−1.3, 0.6, 1.6) REin the
(x, y, z) GSM coordinate system. A change in the measured magnetic field, from a decreasing positive z component to an increasing z component, was observed, suggesting the occur-rence of a local magnetic field dipolarization. No spacecraft had an appropriate location in order to measure a possible signature of dipolarization associated with Event 1.
The observed thinning of the PSBL may possibly be a con-sequence of the detected dipolarization of open field lines oc-curring in the tail. The dipolarization process may also lead to the observed poleward expansion of the boundary between the region of closed magnetic field lines of the PS, and the re-gion of open magnetic field lines of the tail lobes mapping to the PC, associated with the substorm expansion phase char-acterizing Event 2.
The magnitude of the field-aligned Poynting flux was esti-mated for the events presented here. For Event 2, the Poynt-ing flux is predominantly downward directed and reaches a local intensity up to 2.8 mW/m2, as seen by the Cluster spacecraft 1 (about 480 mW/m2 when mapped to 100 km). Weaker, but still predominantly downward directed, field-aligned Poynting fluxes are detected by Cluster spacecraft 2 and 4 (mapped intensities between 70–170 mW/m2), as-sociated with the relatively weaker electric field structures detected by these spacecraft. Field-aligned Poynting fluxes with mapped intensities less than 60 mW/m2are associated with the electric field structures detected for Event 1. Note that while Event 2 occurs during the substorm expansion phase, Event 1 is associated with the substorm recovery phase.
Keiling et al. (2000, 2001) reported observations by the Polar satellite of large electric field structures in the PSBL at geocentric distances of 4–7 Earth radii, with the majority of the events occurring in the midnight MLT sector. These intense electric field structures were associated with large downward-directed Poynting fluxes with local intensities up to 2.5 mW/m2 (∼400 mW/m2 when mapping from an alti-tude of 5.5 Earth radii to 100 km). The authors showed that most of the intense events occurred during the substorm ex-pansion phase, concluding that large electromagnetic energy transfer processes occur in the plasma sheet during the most dynamic phase of substorms. Our observations are thus in accordance with the results reported by Keiling et al. (2000, 2001).
The temporal and spatial evolution of two events charac-terized by intense electric field variations, observed by the Cluster spacecraft at altitudes between 3.5 and 4.7 Earth radii, and by regions of upward FACs at the PS poleward boundary, was described and analyzed in this paper. The fol-lowing summarizes our main observations and conclusions:
2556 S. Figueiredo et al.: Temporal and spatial evolution of discrete auroral arcs 1. The shape and magnitude of the potential structures
encountered by the Cluster spacecraft at the poleward boundary of the PS display significant changes in a timescale of tens of minutes, which were recorded by the Cluster spacecraft during a time interval of up to an hour.
2. The most intense electric field variations and FAC den-sities are seen to be strongly coupled to the density gra-dient associated with the PS poleward boundary. 3. The motion of the auroral arc structures and of the PS
poleward boundary are closely tied to each other: dur-ing the recovery phase, both the PS region and the au-roral arc structure at its poleward boundary remained rather stationary in location; during the expansion phase both the PS region and the observed surge horn structure moved poleward with a velocity of ∼0.5 km/s.
4. Convergent electric field structures associated with
∼10 kV potential drops are seen to map quasi-statically up to Cluster altitudes, in the auroral upward current re-gion.
5. The upper part of the primary auroral acceleration re-gion is seen to extend beyond the 3.9-Earth radii altitude for Event 1.
6. The dissipation of energy into the ionosphere by the precipitating electrons seems to be more efficient at the edges of the auroral arc structures.
7. The PSBL thickness varies significantly on a time inter-val of tens of minutes. The dynamic nature of the PSBL is most pronounced at its edges, where inconsistencies in terms of the quasi-static description of the electric field, FAC density, and electron energy flux distribution are also found.
Acknowledgements. S. Figueiredo acknowledges the support of the Fundac¸˜ao para a Ciˆencia e a Tecnologia (FCT) under the grant SFRH/BD/6211/2001. Image and data processing by NOAA’s Na-tional Geophysical Data Center. DMSP data collected by US Air Force Weather Agency. The DMSP particle detectors were designed by Dave Hardy of AFRL, and data obtained from JHU/APL. We thank D. Hardy, F. Rich, and P. Newell for its use. The DMSP magnetometer data were provided by F. Rich of the Air Force Re-search Laboratory. We thank L. Kistler and C. Mouikis for the ion characteristic energy plots and for the ion energy flux spectrograms provided.
Topical Editor M. Pinnock thanks A. Streltsov and another ref-eree for their help in evaluating this paper.
References
Alfv´en, H.: On the theory of magnetic storms and aurora, Tellus, 10, 104, 1958.
Balogh, A., Dunlop, M. W., Cowley, S. W., Southwood, D. J., Thomlinson, J. G., Glassmeier, K. H., Musmann, G., L¨uhr, H., Buchert, S., Acu˜na, M. H., Fairfield, D. H., Slavin, J. A., Riedler,
W., Schwingenschuh, K., and Kivelson, M. G.: Satellite mea-surements and theories of low altitude auroral particle accelera-tion, Space Sci. Rev., 79, 33–64, 1997.
Bryant, D. A., Cook, A. C., Wang, Z.-S., de Angelis, U., and Perry, C. H.: Turbulent acceleration of auroral electrons, J. Geophys. Res., 96, 13 829–13 839, 1991.
Carlqvist, P. and Bostr¨om, R.: Space-charge regions above the au-rora, J. Geophys. Res., 75, 7140–7146, 1970.
Eastman, T. E., Frank, L. A., Peterson, W. K., and Lennartsson, W.: The Plasma Sheet Boundary Layer, J. Geophys. Res., 89, 1553– 1572, 1984.
Fujii, R., Hoffman, R. A., Anderson, P. C., Craven, J. D., Sugiura, M., Frank, L. A., and Maynard, N. C.: Electrodynamic parame-ters in the nighttime sector during auroral substorms, J. Geophys. Res., 99, 6093–6112, 1994.
Gustafsson, G., Bostr¨om, R., Holback, B., Holmgren, G., Lundgren,
A., Stasiewicz, K., ˙Ahl´en, L., Mozer, F. S., Pankow, D., Harvey,
P., Berg, P., Ulrich, R., Pedersen, A., Schmidt, R., Butler, A., Fransen, A. W. C., Klinge, D., F¨althammar, C.-G., Lindqvist, P.-A., Christenson, S., Holtet, J., Lybekk, B., Sten, T. A., Tan-skanen, P., Lappalainen, K., and Wygant, J.: The Electric Field and Wave experiment for the Cluster mission, Space Sci. Rev., 79, 137–156, 1997.
Johansson, T., Figueiredo, S., Karlsson, T., Marklund, G., Fazak-erley, A., Buchert, S., Lindqvist, P.-A., and Nilsson, H.: Intense high-altitude auroral electric fields - temporal and spatial charac-teristics, Ann. Geophys., 22, 2485–2495, 2004,
SRef-ID: 1432-0576/ag/2004-22-2485.
Johnstone, A. D., Alsop, C., Burge, S., Carter, P. J., Coates, A. J., Coker, A. J., Fazakerley, A. N., Grande, M., Gowen, R. A., Gur-giolo, C., Hancock, B. K., Narheim, B., Preece, A., Sheathier, P. H., Winningham, J. D., and Woodliffe, R. D.: PEACE: A Plasma Electron And Current Experiment, Space Sci. Rev., 79, 351–398, 1979.
Keiling, A., Wygant, J. R., Catell, C., Temerin, M., Mozer, F. S., Kletzing, C. A., Scudder, J., Russell, C. T., Lotko, W., and Streltsov, A. V.: Large Alfv´en wave power in the plasma sheet boundary layer during the expansion phase of substorms, Geo-phys. Res. Lett., 27, 3169–3172, 2000.
Keiling, A., Wygant, J. R., Catell, C., Johnson, M., Temerin, M., Mozer, F. S., Kletzing, C. A., Scudder, J., and Russell, C. T.:
Properties of large electric fields in the plasma sheet at 4–7 RE
measured with Polar, J. Geophys. Res., 106, 5779–5798, 2001. Lindqvist, P.-A. and Marklund, G. T.: A statistical study of
high-altitude electric fields measured on the Viking satellite, J. Geo-phys. Res., 95, 5867–5876, 1990.
Marklund, G., Karlsson, T., and Clemmons, J.: On low-altitude par-ticle acceleration and intense electric fields and their relationship to black aurora, J. Geophys. Res., 102, 17 509–17 522, 1997. Marklund, G. T., Ivchenko, N., Karlsson, T., Fazakerley, A.,
Dun-lop, M., Lindqvist, P.-A., Buchert, S., Owen, C., Taylor, M., Vaivalds, A., Carter, P., Andr´e, M., and Balogh, A.: Temporal evolution of the electric field accelerating electrons away from the auroral ionosphere, Nature, 414, 724–727, 2001.
McIlwain, C. E.: Direct measurement of particles producing visible auroras, J. Geophys. Res., 65, 2727–2747, 1960.
Mozer, F. S.: On the lowest altitude S3−3 obervations of electro-static shocks and parallel electric fields, Geophys. Res. Lett., 7, 1097–1098, 1980.
R`eme, H., Bosqued, J. M., Sauvaud, J. A., Cros, A., Dandouras, J., Aoustin, C., Bouyssou, J., Camus, T., Cuvilo, J., Martz, C., M´edale, J. L., Perrier, H., Romefort, D., Rouzaud, J., d’Uston,
C., M¨obius, E., Crocker, K., Granoff, M., Kistler, L. M., Popecki, M., Hovestadt, D., Klecker, B., Paschmann, G., Scholer, M., Carlson, C. W., Curtis, D. W., Lin, R. P., McFadden, J. P., Formisano, V., Amata, E., Bavassano-Cattaneo, M. B., Baldetti, P., Belluci, G., Bruno, R., Chionchio, G., di Lellis, A., Shel-ley, E. G., Ghielmetti, A. G., Lennartsson, W., Korth, A., Rosen-bauer, H., Lundin, R., Olsen, S., Parks, G. K., McCarthy, M., and Balsiger, H.: The Cluster Ion Spectrometry [CIS] Experiment, Space Sci. Rev., 79, 303–350, 1997.
Rothwell, P. L., Silevitch, M. B., and Block, L. P.: A model for the propagation of the westward travelling surge, J. Geophys. Res., 89, 8941–8948, 1984.
Shelley, E. G., Sharp, R. D., and Johnson, R. G.: Satellite observa-tions of an ionospheric acceleration mechanism, Geophys. Res. Lett., 3, 654–656, 1976.
Vaivads, A., Andr´e, M., Buchert, S., Eriksson, A. I., Olsson, A., Wahlund, J.-E., Janhunen, P., Marklund, G., Kistler, L. M., Mouikis, C., Winningham, D., Fazakerley, A., and Newell, P.: What high altitude observations tell us about the auroral acceler-ation: A Cluster/DMSP conjunction, Geophys. Res. Lett., 30(3), 1106–1110, 2003.
Wahlund, J.-E., Opgenoorth, H. J., H¨aggstr¨om, I., Winser, K. J., and Jones, G. O. L.: EISCAT observations of topside ionospheric ion outflows during auroral activity: revisited, J. Geophys. Res., 97, 3019–3037, 1992.