Development and analysis of an in vitro model of
inflammatory cytokine-mediated idiosyncratic drug hepatotoxicity by
Maya Hasan B.S. Biology
Massachusetts Institute of Technology, 2006 Submitted to the Department of Biological Engineering in
Partial Fulfillment of the Requirements for the Degree of Master of Engineering in Biomedical Engineering
at the
Massachusetts Institute of Technology September 2007
© 2007 Massachusetts Institute of Technology. All Rights Reserved
j j
//
Signature of Author:
Dep4(ment of'Biogic Engineering ~"gAust 10, 2007 I If _ *-f
Certified by:
Accepted by:
Accepted by:
MASCHLus
E'rTTS
"•ST-uM
OF TEOHNOLOGY
JAN
28 2008
LIBRARIES
SDugt'asA.Lauffenburger
Whitaker Professor of Bioengineering, Chemical Engineering, and Biology Director, Biological Engineering Division Thesis SupervisorBevin P. Engelward Associate Professor of Biological Engineering
7
•
MEBE Program Director
,L ,,,
- // / Alan J. Groazinsky
Professor of Elecical, MechaA , and cfological Engineering Director, Center for Biomedical Engineering Chair, BE Graduate Committee
ARCHIVES
Development and analysis of an in vitro model of
inflammatory cytokine-mediated idiosyncratic drug hepatotoxicity by
Maya Hasan
Submitted to the Department of Biological Engineering on August 10, 2007 in Partial Fulfillment of the Requirements for the Degree of
Master of Engineering in Biomedical Engineering
Idiosyncratic drug reactions are a subset of adverse reactions frequently targeting the liver, which become obvious only in large sample populations. Drug-induced
hepatotoxicity, occurring in a very small fraction of patients, poses a major challenge to pharmaceutical companies due to its unknown mechanism(s) of action and deficient models for study. In vitro model systems may have the potential to predict this liver injury by generating conditions possibly representing key processes involved, both directly and indirectly, in drug effects on cellular physiology. Our ultimate goal is to develop an in vitro model effectively mimicking certain relevant aspects of the in vivo response of the human liver. In our initial effort described herein, we have designed a novel cell-based system using alternatively in both a human hepatoma cell line and primary rat hepatocytes to study toxic effects in a background reflecting in vivo inflammatory conditions. This background incorporates bacterial lipopolysaccharide (LPS) administration along with inflammatory cytokines (tumor necrosis factor, interferon y, interleukin-1 a, interleukin-113, and interleukin-6) previously shown to increase in LPS-administrated rats.
Our study began with an investigation of toxicities that are induced by combinations of five cytokines and LPS in HepG2 and C3A human hepatoma cell lines and in primary rat hepatocytes. Informed by the results of these experiments, we selected representative cytokine/LPS treatments and cell systems to examine drug-cytokine synergies in vitro and were able to identify multiple idiosyncratic hepatotoxins that induced synergistic toxicity in either the HepG2 cell line or primary rat hepatocytes. Finally, we measured the sensitization of these cell systems to a panel of these drugs, given an inflammatory
background induced by an abbreviated set of cytokine treatments including four
cytokines and LPS. Analysis of this multivariate drug-cytokine toxicity data set yielded a subset of representative cytokine treatments for future drug-cytokine synergy
investigations. This subset will be used to characterize the differences between cell systems, including cultured human hepatocytes, and to hopefully develop a data-driven partial least squares regression model that predicts idiosyncratic liver injury. The implications are two-fold. First, this model could provide direction to pharmaceutical companies in focusing their drug discovery and development. Second, it could help physicians design better treatment plans for their patients.
Thesis Supervisor: Douglas A. Lauffenburger
Title: Whitaker Professor of Bioengineering, Chemical Engineering, and Biology; and Director of the Biological Engineering Division
Acknowledgements
This thesis work would not have been possible without the guidance and support of my advisor, colleagues, friends, and family. Thanks to:
Douglas Lauffenburger for initially inviting me to join his lab, thereby providing me with a home and purpose in pursuing this research project. In my mind, he is the consummate advisor and a role model for both his students and other leaders in academia and industry. Ben Cosgrove for teaching me how to do good, meticulous, and thorough science. His efforts are on every page of this thesis, and I can only hope that working with me has benefited him even a fraction of how much his mentorship has helped me.
Evi Farazi and Leonidas Alexopoulos for their collaborative efforts. Evi took me under her wing when I first joined the lab, and both have been excellent resources, critics, and
sounding boards for discussion during the past year. The hepatocyte signaling network diagram on page 59 was also adapted from Leo's original.
Our collaborators at Pfizer, especially David de Graaf and Jim Xu, for their innumerable contributions to this project.
Bracken King for providing all the mutual information and joint entropy evaluations and figures presented in this work.
Members of the DAL lab, as well as my officemates in 56-353 and 56-379, for providing assistance or distraction, depending on what was necessary.
Those TAs, classmates, and partners, who made it possible for a biologist to enter the world of engineering.
My friends for reminding me that there is life beyond the big hood in TC Room B and the farthest bench, and that blisters from pipetting eventually go away.
My parents for supporting my decision to stay on at MIT and for encouraging me throughout this process.
Table of Contents
1 Introduction Error! Bookmark not defined.
2
Materials and methods
11
2.1
Cell culture ... 11
2.1.1 Human hepatoma cell lines ... .. ... 11
2.1.2 Prim ary rat hepatocytes... ... ... 12
2.1.3 Cytokines, LPS, and drugs ... 13
2.2 Assays ... ... 15
2.2.1 R ationale ... ... 15
2.2.2 LDH release assay... 16
2.2.3 Effector caspase activity assay... ... 17
2.2.4 Intracellular ATP assay... ... ... 17
2.2.5 Calculating results... 18
2.2.6 Multiplexing homogenous assays ... ... 18
2.3 Analytical techniques ... 19
2.3.1 F actorial analysis ... 19
2.3.2 Principal com ponent analysis ... 22
2.3.3 M utual inform ation ... 23
2.3.4 Euclidean clustering ... 24
2.3.5 Drug-cytokine synergy calculations ... ... 24
3
6-cytokine/LPS multiplexing
26
3.1 Results from human hepatoma cell lines ... ... 263.2 Results from primary rat hepatocytes ... ... 28
3.3 Trends across the data set ... 30
3.4 Conclusions ... 33
4
Identifying drug-cytokine synergies
35
4.1
Rationale ...
35
4.2 Comparison of drug pairs across an inflammatory background ... 35
4.3 Drug-cytokine synergy calculations ... 43
5
5-cytokine/LPS multiplexing
46
5.1 Results from human hepatoma cell line... 465.2 Results from primary rat hepatocytes ... 47
5.3 General trends across the data set ... ... 48
5.4 Further analysis ... ... 50
5.5 Conclusions ... 53
7
Future Work
57
7.1 Primary human hepatocytes ... 57 7.2 Cellomics imaging ... ... 57 7.3 Intracellular signaling ... 57
8
References
60
9
Appendices
62
9.1 Appendix 1. Hepatocyte growth medium recipe... . 62 9.2 Appendix 2. Primary rat hepatocyte data from 6-cytokine/LPS multiplex.. 63 9.3 Appendix 3. HepG2 data from 5-cytokine/LPS multiplex ... 65 9.4 Appendix 4. Primary rat hepatocyte data from 5-cytokine/LPS multiplex .. 69
1
Introduction
Idiosyncratic drug reactions are a subset of adverse reactions that occur in a small fraction of patients; their development is hypothesized to be due to the genetic
predisposition and environmental factors of an individual. Susceptibility to drug toxicity is difficult to predict in preclinical studies and clinical trials because of the limited sample sizes. Only when drugs hit the market do idiosyncratic reactions become obvious,
frequently targeting the liver [Waring et al., 2006]. Drug-induced liver disease is often serious, requiring liver transplantation, and is sometimes fatal; it accounts for about half of all cases of acute liver failure in the United States. In addition, hepatotoxicity (defined as cytotoxicity of the hepatocyte, the key functional cell of the liver) is both the leading cause of drug development failure during clinical trials and the leading cause of post-marketing warnings and withdrawals. It poses a major challenge because of its unknown mechanism and deficient models for study [Kaplowitz, 2005].
Preclinical animal toxicology studies usually fail to identify the risk of hepatotoxicity during clinical trials or post-marketing; a survey examining the ability of animal studies to predict human toxicities indicated that human hepatotoxicities had among the poorest correlations with regulatory animal toxicity tests [Xu et al., 2004]. Cell-based assay systems during the discovery phase of preclinical drug development are now being used to probe the question of organ toxicity. According to Xu et al. [2004], in vitro systems should be used in parallel to explore the diverse mechanisms of liver injury. The
predictive power of these systems should be greater for assays that assess early events in pathogenic sequences. Ideally, both the endpoints of such an assay and the drug
concentrations necessary to elicit those endpoints would mimic human clinical observations.
In culture, primary hepatocytes (either isolated from rodents or donated from human liver samples) have limited retention of many of the key differentiated functionalities necessary to properly study the metabolism and hepatotoxicity of a variety of drug compounds [Brandon et al., 2003]. Moreover, human and rat hepatocytes express a
different repertoire of cytochrome p450 and Phase II metabolic enzymes, making cross-species comparisons difficult. HepG2 cells and their subclone, C3A cells, are two commonly used human hepatoma cell lines1. These human hepatoma cell lines and other
human hepatocellular carcinoma cell lines, such as HepaRG and Huh-7, have even more significant loss of expression of the key hepatocyte-enriched metabolic enzymes and are thus often poor predictors of drug-related hepatotoxicity [Hewitt et al., 2007]. However, even considering their deficiencies related to expression of hepatic enzymes and
transporters, primary cell systems and human hepatoma cell lines still offer the key advantages of being scale-able to high-throughput approaches and tractable cell models of liver function for systems-level investigations.
Recent rodent models developed by Roth and colleagues suggest that one of the environmental factors that may determine an individual's susceptibility to idiosyncratic drug hepatotoxicity is underlying inflammation during drug administration. Such animal models employ administration of bacterial lipopolysaccharide (LPS) to mimic endotoxin exposure and induce inflammatory cytokine release both systemically and within the liver by resident liver macrophages (Kupffer cells). Roth and colleagues have shown that
LPS-I HepG2 and C3A cell lines are both of human hepatoma origin (although they are often incorrectly
induced inflammation enhances liver sensitivity to classical (aflatoxin B 1) and
idiosyncratic (ranitidine, trovafloxacin) hepatotoxins at concentrations that alone have minimal effects, but does not sensitize the liver to non-idiosyncratic drug compounds of similar pharmacological functions [Barton et al., 2000; Luyendyk et al., 2006; Waring et
al., 2006]. What accuracy LPS-treated animal models will have in predicting human liver
toxicity over a broad spectrum of compounds is uncertain, in part because animal models are inherently low-throughput and results from only a few sets of pharmacological compounds have been published to date. Additionally, the specific roles of the multiple molecular mediators of LPS-induced inflammation (extracellular cytokines and
intracellular signaling molecules) in regulating the sensitizations to drug-induced liver toxicity have not be identified in these animal models, but have been preliminarily examined in Kupffer cell-hepatocyte coculture models [Tukov et al., 2006].
Motivated by these efforts, we are working to develop an in vitro model to mimic the
in vivo response of the liver to drugs upon LPS-related inflammation. In work described
herein, we have designed a novel cell-based system utilizing both a human hepatoma cell line and primary rat hepatocytes to study the toxic effects of multiple idiosyncratic hepatotoxins in the presence of defined inflammatory cytokine environments. To mimic the in vivo inflammatory response to LPS administration, our cell systems were treated with multiple combinations of LPS and the inflammatory cytokines tumor necrosis factor (TNF), interferon-y (IFNy), interleukin-la (IL-la), interleukin- 10 (IL-10), and
interleukin-6 (IL-6), which are shown to be upregulated within the liver in
LPS-administered rats [Bergheim et al., 2006]. Our in vitro model does not explicitly include the non-parenchymal cells, such as Kupffer cells, that mediate the liver's response to
LPS, but instead the role of these cells is reproduced through the addition of the
previously mentioned inflammatory cytokines in cell culture experiments containing hepatocytes or hepatoma cells only.
Our study began with an investigation of cytotoxicities that are induced by
combinations of these five cytokines and LPS2 in two human hepatoma cell lines (HepG2 and C3A) and primary rat hepatocytes to select representative cytokine/LPS treatment conditions and cell systems for examination of drug-cytokine interactions in vitro. Informed by the results of these experiments, we set forth to identify whether synergies exist between the selected representative cytokine cocktail and multiple pharmacologic compounds classified as idiosyncratic hepatotoxins in inducing toxicity in either a human hepatoma cell line or primary rat hepatocytes. After identifying multiple idiosyncratic hepatotoxic drugs that exhibit synergy with a representative cytokine cocktail, we asked how this selected set of drugs sensitized both cell systems to a spectrum of cytokine treatment conditions (containing four cytokines and LPS). This multivariate
drug-cytokine toxicity data set was then analyzed to identify a subset of drug-cytokine combinations for future drug-cytokine synergy investigations in cultured human hepatocytes. It was also used to characterize the differences between cell systems that differ in species (primary rat versus primary human hepatocytes) and in transformation state (human hepatoma cells versus primary human hepatocytes) in this drug-cytokine co-treatment in
vitro model. In future efforts, we hope to develop a data-driven partial least squares
regression (PLSR) model, based on the canonical cue-signal-response methodology, to
2 In this text, experiments with combinations of four cytokines and LPS will be referred to as
"5-cytokine/LPS" experiments and those with combinations of five cytokines and LPS will be referred to as "6-cytokine/LPS" experiments.
predict idiosyncratic liver injury based on knowledge of how drug therapies affect hepatocyte signaling networks in the way of Miller-Jensen et al. [2007].
The implications of this work and future modeling efforts are twofold. First, this in
vitro cellular model of inflammatory cytokine-mediated hepatotoxicity could identify
potential hepatotoxins earlier in the drug development processes. Or, similarly, a
predictive PLSR model could provide direction to pharmaceutical companies in focusing their drug discovery efforts away from compounds that would significantly affect cellular mediators of drug-cytokine toxicity synergies. Second, our work could help physicians design better treatment plans for their patients by stratifying patients into different drug treatment programs depending on their preexisting inflammatory conditions and based on knowledge of particular synergies that exist between candidate drugs and various
2
Materials and methods
2.1 Cell culture2.1.1 Human hepatoma cell lines
On Day 1 of the 6-cytokine/LPS multiplex experiment, 100 ýtL of HepG2 and C3A cells from human hepatoma cell lines were grown on 96-well, collagen I-coated, black plates with clear bottoms (BD) in lot-controlled USDA tested 10% fetal bovine serum
(HyClone)-containing EMEM (ATCC) supplemented with 1% penicillin-streptomycin (Invitrogen) at 30,000 cells/well, such that they were confluent the next day. At this time the media was aspirated, and cells were treated with various cytokine/LPS combinations in the previously described media. LDH release and intracellular ATP were measured 24
and 48 hours following dosing.
The HepG2 plating protocol remained the same during subsequent experiments (Figure 1). However, on Day 2 the media used during seeding was aspirated, and 5
[tg/mL insulin (R&D Systems) was added to the cells in 100 [tL of serum-free media supplemented with antibiotics. On Day 3, cells were co-treated with various
cytokine/LPS combinations and, in most cases, idiosyncratic and non-idiosyncratic drugs; these dosing solutions were administered in the same serum-free, insulin-containing media supplemented with antibiotics. Cells were dosed with cytokine/LPS combinations
and drugs simultaneously so that drug exposure occurred at maximum cytokine/LPS stimulation. Hepatotoxicity was then assayed between 12 and 48 hours using in vitro toxicity assays.
Cells were regularly passaged on a biweekly basis. HepG2 and C3A cells between passages 45 and 60 were used in 6-cytokine/LPS multiplex experiments. HepG2 cells
from passage 12 were used in the experiment identifying drug-cytokine synergies, and cells from passage 14 were used in the 5-cytokine/LPS multiplex experiment.
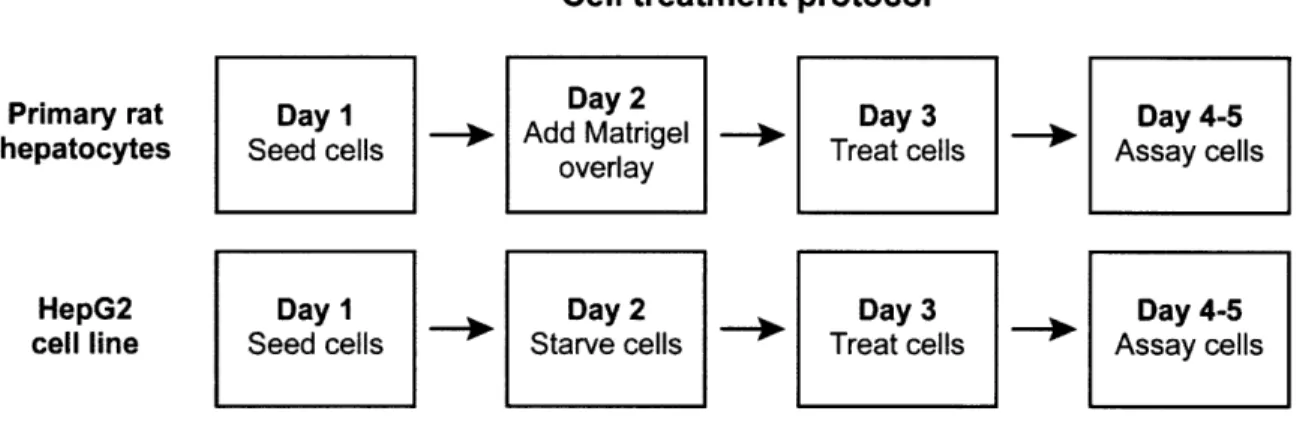
Cell treatment protocol
Primary rat Day 1 Day 2 Day 3 Day 4-5
hepatocytes Seed cells - Add Matrigel ' Treat cells Assay cells
overlay
HepG2 Day 1 Day 2 Day 3 Day 4-5
cell line Seed cells Starve cells Treat cells Assay cells
Figure 1. The timeline of experiments to identify drug-cytokine synergies and synergies across a 5-cytokine/LPS inflammatory landscape included growing
primary rat hepatocytes in a collagen I-Matrigel sandwich configuration and serum-starving HepG2 cells.
2.1.2 Primary rat hepatocytes
Primary rat hepatocytes were isolated as described in Sivaraman et al. [2005]. Primary hepatocytes were isolated from male Fisher rats using a two-step collagenase procedure including multiple 50g centrifugations and a Percoll (Sigma) clarification centrifugation to increase hepatocyte purity and reduce contamination with non-parenchymal cells. Cell viability and yield were routinely greater than 90% and 300 million cells, respectively, as assessed by trypan blue exclusion staining using a Vi-CELL instrument (Beckman-Coulter). Purity of hepatocytes and non-parenchymal cells
following Percoll isolation was assessed using a flow cytometry-based assay utilizing various liver cell type antigens as described in Cosgrove et al. [in prep]. Median cell type fraction values were as follows: 97% hepatocytes (cytokeratin-18+ cells), 0.4% Kupffer
cells (ED2+ cells), 0.4% stellate cells (GFAP+ cells), and 0.2% sinusoidal endothelial
Primary rat hepatocytes were plated and cultured in hepatocyte growth medium (HGM) based on that described in Block et al. [1996]. HGM is a phenol red-free DMEM (Gibco)-based medium that contains necessary amino acids, sugars, trace metals,
hormones, and 5 pg/mL insulin (Sigma), but does not contain serum. In this work, the Block et al. HGM formulation was modified to contain 300 ng/mL trichostatin A (Sigma) and was made without EGF. See Appendix 1 for the full HGM formulation. Following Percoll isolation, primary rat hepatocytes were plated in 100 [tL/well HGM at 100,000 cells/cm2 (32,000 cells/well) in 96-well, collagen I-coated plates (BD) (Figure 1). Four hours after plating, culture media was replaced with fresh HGM. On Day 2 of culture, an overlay of the reconstituted basement membrane solution Matrigel (BD) was added on top of the hepatocytes to mimic the complex extracellular environment and to maximize cellular differentiation. Ice-cold Matrigel (phenol red-free, growth factor-reduced) was added to ice-cold HGM to a final concentration of 0.25 mg/mL and was added at 100
tL/well to freshly aspirated culture wells. Matrigel was allowed 24 hours to form a gel overlay before the media was aspirated on Day 3 and fresh HGM was added containing drugs and/or cytokines according to the treatment and assay protocols outlined for the HepG2 cells. For the preliminary 6-cytokine/LPS multiplex experiments, the Matrigel overlay step was omitted, and the hepatocytes were treated with cytokines in 100 tL/well fresh HGM on Day 2 of culture.
2.1.3 Cytokines, LPS, and drugs
The 6-cytokine/LPS multiplex data set was collected using cytokines at the lowest concentrations listed in Table 1. In experiments in which cells were co-treated with both drugs and cytokines, dosing solutions were prepared to standardize administration using
cytokines at the highest concentrations listed in Table 1. Recombinant human and rat cytokines were obtained from R&D Biosystems and LPS serotype S from E. coli 0111 :B4 was obtained from Sigma. Stock solutions of idiosyncratic and
non-idiosyncratic drug pairs (Table 2) from the same pharmacologic class (Table 3) were prepared at 200x in 100% DMSO (Sigma) and diluted in insulin- and
cytokine-containing HepG2 or primary rat hepatocyte media to lx concentrations at 0.5% DMSO. As described in Section 4, a representative cytokine cocktail denoted "cytokine mix C" was used in a subset of the drug-cytokine co-treatment experiments; it contained 10 jtg/mL LPS, 100 ng/mL TNF, 100 ng/mL IFNy, and 20 ng/mL IL-la.
Table 1. Concentrations of cytokines and LPS used in this study.
Cytokine Concentration (ng/mL) LPS S1 10,000 TNF-a 100 IFN-y 20-100 IL-la 10-20 IL-1f3 10-20 IL-6 2.5-20
Table 2. Drugs ordered from the following manufacturers or procured from collaborators at Pfizer.
Drug Manufacturer
Aspirin Sigma
Buspirone hydrochloride Sigma
Cimetidine Sigma
Clarithromycin Sequoia Research
Entacapone Sequoia Research
Famotidine Sigma
Levofloxacin Fluka BioChimika
Nefazodone hydrochloride Sigma
Nimesulide Sigma
Ranitidine hydrochloride Sigma
Telithromycin Sequoia Research
Tolcapone Pfizer
Table 3. Idiosyncratic and non-idiosyncratic drugs used in this study. The
pharmacologic class of each is listed, along with its maximum concentration encountered by the liver. Those compounds in red have been identified as causing drug-induced liver injury (DILI) by our collaborators at Pfizer. Results from Roth and colleagues are summarized from Luyendyk et al. [2006] and Waring et al. [2006].
Compounds to investigate in drug-cytokine hepatotoxicity synergy model
100*Cmax human plasma concentration
(high end of Drug "therapeutic window")
Buspirone 0.5 pM Nefazodone 86 IpM Clarithromycin 334 pM Telithromycin 277 IpM Aspirin 552 ipM Nimesulide 2108 ipM Famotidine 30 piM Ranitidine 142 ipM Cimetidine 1542 pM Levofloxacin 1577 pM Trovafloxacin 769 pM Entacapone 393 pM Tolcapone 2084 pM Color key: Pharmacologic class Synergy in LPS-administered animal model (Roth group)
serotonin receptor inhibitor not reported
serotonin receptor inhibitor not reported
antibiotic not reported
antibiotic not reported
non-steroidal anti-inflammatory drug not reported non-steroidal anti-inflammatory drug not reported histamine H2-receptor antagonist
histamine H2-receptor antagonist +
histamine H2-receptor antagonist not reported
antibiotic
antibiotic +
catechol-O-methyl transferase inhibitor not reported
catechol-O-methyl transferase inhibitor not reported
Compound not associated with liver injury
Compound associated with idiosyncratic liver injury (DILI P2)
2.2 Assays
2.2.1 Rationale
We chose to multiplex several of Promega's cell viability, cytotoxicity, and apoptosis assays to measure the endpoints during this screen of multiple drugs across inflammatory cytokine backgrounds. We could have instead used various imaging techniques or a variety of sub-lethal toxicity endpoint assays, but we found that the high-throughput nature of these lethal toxicity assays and their ease of use outweighed the benefits of the
former. These assays may be less informative than a flow cytometry-based apoptosis assay, for example, but they allowed us to collect a depth and breadth of data that would not have otherwise been possible and that discriminated between the many possible cytokine combinations.
2.2.2 LDH release assay
The CytoTox-ONETM Homogenous Membrane Integrity Assay (Promega) was used to measure cytotoxicity by the release of lactate dehydrogenase (LDH), a stable cytosolic enzyme, into the surrounding medium upon cell lysis (Figure 2). It is a fluorometric method used to estimate apoptotic and necrotic cell death by loss of membrane integrity in a mixed population of viable and damaged cells. LDH released into culture
supernatants is measured with a 10-minute coupled enzymatic assay driven by the presence of excess lactate and NAD+. LDH catalyzes the conversion of these substrates into pyruvate and NADH; the latter subsequently drives the diaphorase-catalyzed reduction of resazurin to produce fluorescent resofurin. Fluorescence is proportional to the number of lysed cells. In some cases, cell lysis reagent was added to positive control wells prior to the addition of CytoTox-ONETM Reagent to generate a maximum LDH release control. Also, stop solution was not added.
Lactate Pyruvate
NAD+ NADH
SReri Resorutin sazurin
Figure 2. LDH substrate of coupled reduction-oxidation reactions resulting in the production of fluorescent resofurin. LDH is released by cells suffering a loss of
membrane integrity. Supplying the excess substrates lactate, NAD+, and resazurin,
ensures fluorescence is proportional to the number of necrotic cells [Promega].
2.2.3 Effector caspase activity assay
The Caspase-Glo® 3/7 Assay (Promega) is a luminescent method used to measure apoptosis in adherent cells. After causing cell lysis, it provides the luminogenic substrate DEVD-aminoluciferin for caspase-3/7 cleavage and luciferase to generate a luminescent signal by consuming the liberated free aminoluciferin (Figure 3). The resulting
luminescence is proportional to caspase-3/7 activity. Samples were incubated for one hour. H Z-DEVD-N S N COO H Caspase-3/7 N S HN S / COOH H, S\+ ATP + 02 Z-DEVD- + N S UItraGIoTm Luciferase Mg2 ÷
Figure 3. Luminescent signal generated following caspase-3/7 cleavage of DEVD-aminoluciferin. Cleavage of the luminogenic caspase-3/7 substrate releases free
aminoluciferin into the surrounding medium for luciferase action [Promega].
2.2.4 Intracellular ATP assay
The CellTiter-Glo Luminescent Cell Viability Assay (Promega) is a method of measuring cell viability via its correlation with intracellular ATP. The Cell-Titer-Glo® Reagent causes cell lysis and the release of ATP into the surrounding culture medium;
upon loss of membrane integrity, the cell loses its ability to synthesize additional ATP. The reagent simultaneously inhibits endogenous ATPases and provides the reactants for a luminescent reaction to measure ATP.
2.2.5 Calculating results
The average value of culture medium background fluorescence or luminescence was subtracted from all experimental wells. Experimental values were then normalized to the average signal from untreated control wells (containing no cytokines and 0.5% DMSO when appropriate). Assay data is therefore presented in Relative Fluorescence (RFU) or Luminescence Units (RLU).
2.2.6 Multiplexing homogenous assays
These assays were used in parallel such that more than one data set was collected from the same sample. In cases in which the intracellular ATP assay was multiplexed with the LDH release assay, all media was transferred to a separate assay plate for the LDH release assay and 100 [tL of fresh media was added to each well on the original assay plate. The ATP release assay protocol was then followed as recommended by the manufacturer. Alternatively, 50 ptL of culture supernatant was removed to a separate white assay plate (Nunc) to gather cytotoxicity data using the LDH release assay, leaving the original assay plate available for caspase activity measurements of apoptosis.
When multiplexing assays it is especially important to understand what a given assay is measuring and how it is correlated with cell viability, cytotoxicity, or apoptosis. It is also important to understand the kinetics of the cell death process to inform decisions like the choice of assay endpoint. For example, cells undergoing rapid necrosis, characterized by loss of membrane integrity and metabolic shutdown, do not express apoptotic markers.
On the other hand, apoptotic cells transiently express those markers before undergoing secondary necrosis in vitro.
2.3 Analytical techniques 2.3.1 Factorial analysis
In this study we first performed a battery of experiments to measure the effects of, and identify the synergies between, five cytokines and LPS on hepatocellular viability, cytotoxicity, and apoptosis. Later, we set forth to detect synergies between five
inflammatory agents and a variety of idiosyncratic and non-idiosyncratic drug
compounds. In both cases, we used a full pq factorial design, where q is the number of variables (factors) and p is the number of levels at which the variable is tested; there were 26 = 64 combinations in the first case and 25 = 32 in the second. The concentrations at
which these cytokines were tested are explained in Section 2.1.3. This analytical
technique identifies main effects and interactions and informs further experimentation. In this case, it measured the additive or subtractive effect of any single or group of
conditions on toxicity. The following explanation was adapted from Box et al. [1978]. The main effect of a variable is its average effect on the response, regardless of the levels of the other variables. In our two-level factorial design for six inflammatory agents, the main effect of variable i is given by
main effect = y,... - Y ...
where y ... is the average measured outcome in the presence of a given cytokine and y ... is the average value in its absence. Each of the calculated main effects is therefore
dependent on all 64 of the responses. Also, each is determined with the precision of 32 replicated experiments.
In addition to more precisely measuring the additive effects of variables on outcomes compared to an experimental method in which one variable is varied at a time, this analytical technique has the added benefit of calculating potentially synergistic interactions that may result from the presence of multiple variables in a system using fewer observations than the one-factor-at-a-time method. For variables i and j in our 26
factorial design, the i x j interaction is
ix
jinteraction....
2
or half the difference between the average effect of variable i in the presence and absence of j. By extension, for variables i through m, the six-factor interaction is
Y6/6 - Y5/6 + Y4/6 - Y3/6 + Y2/6 - Y1/6
+
YO/6
ixjxkxlxmxn=
32
where, for example, y3/6 represents all the outcomes in the presence of only three of the
six inflammatory agents. It is important to remember that each interaction can be defined as half the difference between two averages, and that the outcome in the presence of all variables, yijkmn,, has a positive effect on any main effect or interaction.
Before the main effects and interactions can be interpreted, the associated standard errors must be calculated. With replicated observations, the pooled estimate of run variance is g"(n
-I)s2
S2 i=(ni
1
-1)
i= 1where g is the number of conditions; and ni is the number of replicates, ni -1 is the
degrees of freedom, and si2 is an estimate of the variance ', for the ith condition. Each2
effect or interaction is the difference between two averages, y, - y_, so the variance v of
each effect or interaction is
V= + --07
(n+, n
where n+ is the total number of replicates used to calculate y+ and n_ is the total number
of replicates used to calculate y_. The estimated standard error of each main effect or interaction is calculated by
standard error = +±
Factorial analysis calculations were performed on fold change versus no cytokine control data in all cases. The guidelines governing the interpretation of factorial effects tell us that main effects cannot be interpreted individually if either plays a role in significant higher-order interactions.
Statistical significance of each factorial effect or interaction y, was evaluated using a one-sample, two-tailed t-test. A 95% confidence interval for each effect or interaction was calculated using its standard error v and an appropriate critical t-value t*, which was calculated as a function of the number of biological replicates n and the desired
statistical confidence level a.
CIS5% = Yij tnl,a . V
A Bonferroni correction to the statistical confidence level was used to account for multiple comparisons because the significance of multiple effects and interactions were
evaluated simultaneously. For example, in the evaluation of the 5-cytokine/LPS/drug co-treatment experiments, five biological replicates were used and 31 different effects or interactions were evaluated. Thus, a statistical confidence level of a = 0.05/31 = 0.0016 was used, yielding a critical t-value of t4.00o1 6 = 7.56. If the 95% confidence interval of a
given effect or interaction did not contain zero (the null hypothesis of no effect), then the effect or interaction was deemed statistically significant.
2.3.2 Principal component analysis
A principal component analysis (PCA)-based data mapping approach was used to examine co-variations in the 6-cytokine/LPS combinatorial toxicity data set collected in the three hepatocyte cell systems. A data matrix was constructed containing rows
representing the 64 unique cytokine treatment combinations and 12 columns representing both discretized classifications of the six cytokine treatment variables and the measured LDH release values for HepG2 cells, C3A cells, and primary rat hepatocytes at 24 and 48 hours post-treatment. The cytokine treatment columns were formulated as discretized treatment concentrations with '0' representing no cytokine and '1' representing a cytokine that was included in a given treatment. The LDH release data columns were formulated as fold change values separately normalized for each cell type and time point (as plotted in Figures 4 and 6). Thus, the values in each row of the data matrix could project as a series of coordinates in a multi-dimensional cytokine treatment classification-and toxicity data-space [Janes et al., 2006]. A PCA algorithm was implemented (SIMCA-P, U-Metrics) to map the multi-dimensional cytokine treatment-/toxicity outcome-space onto a set of principal component axes to capture a significant amount of the co-variation in the data matrix. Preceding PCA mapping, each column of the data matrix was
separately mean-centered and variance-scaled following accepted data pre-processing methods for disparate data types [Geladi et al., 1986]. A two-component PCA map was
obtained that captured 43% of the entire variation in the data set (as measured by cumulative R2) with the first and second principal component containing 30% and 13%
of the variation, respectively. Additional principal components provided non-significant additions in capturing variation in the data matrix (R2) and/or cross-validated predictions based on the principal component mapping (Q2) (data not shown). PCA loadings for each
column of the data matrix are plotted in Figure 7 and represent how data from each cytokine treatment classifier or LDH outcome measurement map onto the two principal component axes. Similar patterns of loadings onto these two principal component axes for sets of treatment classifiers or cell systems indicate related co-variation across the entire set of 64 unique cytokine treatments.
2.3.3 Mutual information
In the 6-cytokine/LPS experiments, cytokine treatment variables whose presence or absence were most informative of the six measured LDH release outcomes (HepG2, C3A or primary rat hepatocyte cells at 24 or 48 hours) were computed [King and Tidor, in
prep]. Cytokine treatment variables were scored for information content by estimating the
mutual information between the cytokine variable and the set of outputs, using a second order joint entropy approximation.
To identify characteristic subsets of the 32 cytokine conditions in the
5-cytokine/LPS/drug experiments, 1000 subsets ranging in number of included unique cytokine treatments from 4 to 32 were chosen at random for all possible permutations. These subsets were scored by estimating the joint entropy of all drug and DMSO control
treatment responses. Caspase 3/7 activity data in the HepG2 cells at 24 hours post-treatment was used as a test data set for this approach. The subset of each size with the highest computed joint entropy was chosen as the most representative.
2.3.4 Euclidean clustering
Hierarchical clustering was conducted to identify and distinguish clusters of toxicity outcomes based on cytokine treatment conditions, cell system, and/or drug co-treatments. For the 6-cytokine/LPS combinatorial experiments, LDH release data from HepG2 cells, C3A cells, and primary rat hepatocytes at 24 and 48 hours post-treatment was normalized to fold change (separately for each cell system and time point) and subjected to
hierarchical clustering. Hierarchical clustering was performed in Matlab (Mathworks) using a Euclidean distance metric with linkages evaluated by the unweighted pair-group method with arithmetic averages [D'haeseleer, 2005]. Clustering was separately
conducted on the 64 unique cytokine treatments and the six cell systems/time points. For the 5-cytokine/LPS combinatorial experiments in the presence of drug co-treatments, clustering was performed as described above for a representative data set (caspase 3/7 activity at 24 hours post-treatment in HepG2 cells) and was used to distinguish clusters of both cytokine treatment conditions and drug co-treatments.
2.3.5 Drug-cytokine synergy calculations
Synergistic interactions between drugs and inflammatory agents are those effects that are greater than the sum of their individual effects. Therefore the cytotoxic effect of cytokine mix C alone as measured by LDH release was added to each toxicity value of drug alone across the range of tested concentrations at three time points in both HepG2s and primary rat hepatocytes. These projected dose-response curves describe the toxicity
that would be predicted for each drug if there was a purely additive cytotoxic effect between the compound and cytokine mix C. Drugs that synergized with the inflammatory cytokine background were easily identifiable using this intuitive technique since their measured toxicity values exceeded those predicted by simple addition. For all
combinations of drug, cell systems, and time points, the drug concentration that exhibited the greatest synergistic toxicity above the predictive additive toxicity was identified and reported in Table 4.
3
6-cytokine/LPS multiplexing
3.1 Results from human hepatoma cell lines
A number of general trends become obvious upon inspecting the data set collected
from the human hepatoma cell lines (Figures 4, 5). Unfortunately, however, the limited number of replicates in this cell line experiment makes the statistical significance of the data subject to skepticism.
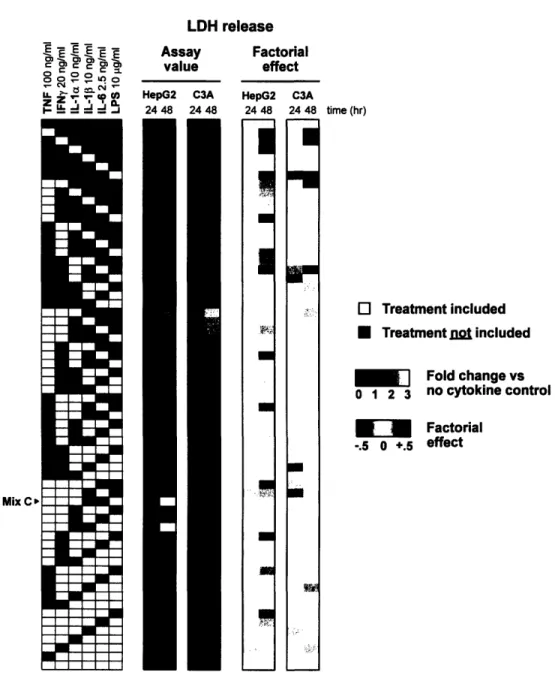
Very little cytotoxicity was measured by the LDH release assay across the spectrum of cytokine backgrounds in HepG2s at 24 hours, an observation reiterated by the
negligible factorial effects calculated for the time point (Figure 4). In the presence of a single cytokine, only minimal cell death was seen in either cell line at both time points; in contrast, the most LDH release was measured in the presence of some of the
highest-order cytokine combinations. The C3A cell line exhibited a similarly modest level of cell death as measured by the LDH release assay at 24 hours, with a few notable exceptions in the presence of three- or higher-order cytokine combinations. The common inclusion of
LPS in these apparently cytotoxic cytokine combinations explains the strong positive
factorial effect of the bacterial endotoxin. LPS treatment co-varied with the LDH release data from the C3A cells at 24 hours in the PCA map (Figure 7). More cytotoxicity was evident at 48 hours in both cell lines; by inspection it seems that IL-la was a common denominator among the most cytotoxic cytokine combinations in HepG2s, just as the presence of TNF and IFNy seem to affect cell death in C3As (Figure 4).
Cell viability data from the intracellular ATP assay was very noisy and did not correlate with increased LDH release (Figure 5). No clear trends were evident and the fold change assay values only varied across a twofold range; this variability was
propagated into the factorial analysis. The unreliable data may result from the effects of metabolic variation induced by cytokine treatment.
LDH release 0 00E 00e-.Ifl -C..
U
Assay value HepG2 C3A 24 48 24 48 Factorial effect HepG2 C3A 24 48 24 48I
Bae UI
on
time (hr) O Treatment included * Treatment= nt included SFold change vs 0 1 2 3 no cytokine control "Factorial -.5 0 +.5 effectFigure 4. LDH release data set from the 6-cytokine/LPS multiplex experiment in both human hepatoma cell lines at two time points. Cytokine mix C is identified in the
treatment matrix, and mean assay values are presented as fold change versus the no cytokine control.
Mix C'
Intracellular ATP
Assay Factorial
value effect
HepG2 C3A HepG2 C3A
24 48 24 48 24 48 24 48
Mix C'
time (hr)
E EIT
1- rdd ..J
Figure 5. Intracellular ATP data set from the 6-cytokine/LPS multiplex experiment in both human hepatoma cell lines at two time points. Cytokine mix C is identified in
the treatment matrix, and mean assay values are presented as fold change above the no cytokine control.
3.2 Results from primary rat hepatocytes
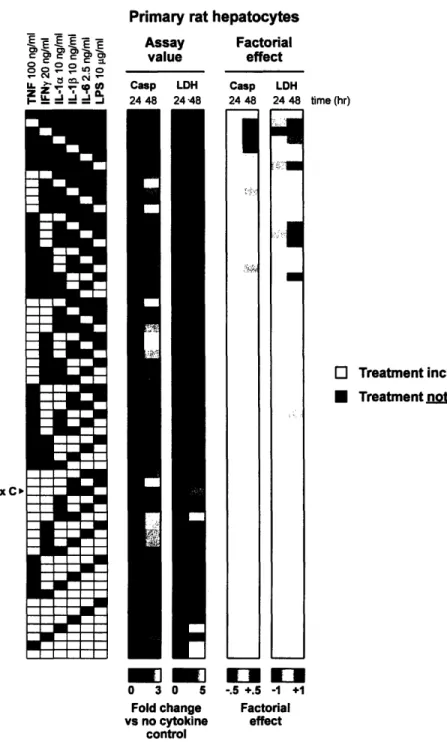
Primary rat hepatocytes underwent only background levels of apoptosis at 24 hours according to the caspase activity assay, and the LDH release assay revealed moderate cytotoxicity with higher-order cytokine combinations, a trend heightened at 48 hours (Figure 6). At 24 hours, the factorial effects as determined by both caspase 3/7 activity
and LDH release assays revealed minimal meaningful main effects or multi-factor
G
O Treatment included* Treatment not included
SFold change vs .7 1 1.4 no cytokine control " Factorial -.1 0 +.1 effect
MA
.5a
ml m ;~_; ii.: i;: ,i~rl 9,, Yiii7 ..,I Ii!
I
I
lidinteractions. In fact, none of the factorial effects calculated from this primary rat
hepatocyte data set are statistically significant (Figures Al, A2). Qualitatively, however, it would seem that hepatocyte apoptosis was highly correlated with the presence of either TNF or IL-la at 48 hours, an observation supported by the strong positive factorial effects of these two cytokines (Figure 6). It is interesting that the main effect of IFNy at 24 hours was amplified at 48 hours and that this cytokine also appeared in the notable two-factor interaction with LPS at this later time point. Importantly, only the IFNy x LPS interaction could be subject to interpretation (Section 2.3.1) if the results of this factorial analysis were, in fact, statistically significant.
Primary rat hepatocytes Assay Factorial value effect Casp LDH Casp LDH ?4 48 24 48 24 4R 24 48
-I
0 3 0 5 -.5 +.5 -1 +1Fold change Factorial
vs no cytokine effect
control
E C
Mi r - MC
Mix C>
Figure 6. Caspase 3/7 activity and LDH release data sets from the 6-cytokine/LPS multiplex experiment in primary rat hepatocytes at two time points. Cytokine mix C is identified in the treatment matrix, and mean assay values and factorial effects are presented.
3.3 Trends across the data set
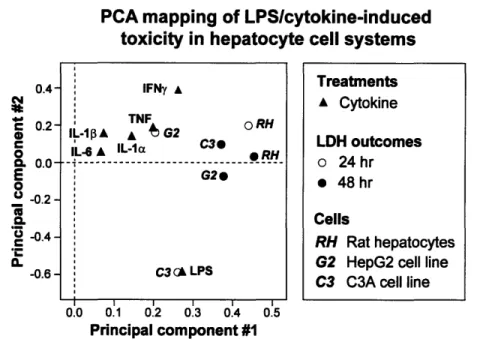
According to the PCA plot of the first two principal components, the LDH outcomes strongly impact the model, as evidenced by their distance from the origin, while the cytokines, especially IL-6 and IL-10, seem to have little effect on cytotoxicity (Figure 7).
time (hr)
O Treatment included
* Treatment not included
r:
The 48 hour data from all three hepatocyte cell systems group together in the PCA plot as outcomes with similar variations in LDH release. The five cytokines also appear to co-vary more closely with each other than with LPS.
PCA mapping of LPSlcytokine-induced
toxicity in hepatocyte cell systems
0.4-' 0.2-0 C 0 0. 0.0-E 0 0 -0.2-'U -0.4- -0.6-I I I I I I 0.0 0.1 0.2 0.3 0.4 0.5 Principal component #1
Figure 7. PCA plot of LDH release data sets from both the human hepatoma cell lines and primary rat hepatocytes. The first component explains 30% of the variation and the second component 13%. The C3A data at 24 hours is strongly co-varied with the
LPS treatment in both principal components.
In addition, a Euclidean clustering of the same LDH release data set greatly distinguished the cytokine-induced cytotoxicity in primary rat hepatocytes at 48 hours from the other combinations of cell system and time point, as the primary rat hepatocytes demonstrated a far greater cytotoxic response than the other cell systems at either time point (Figure 8). Clustering also illustrated the similarity between LDH release outcomes of HepG2s and C3As. LDH release generally increased in the presence of higher-order cytokine combinations, as discussed earlier. In particular, we identified cytokine mix C (TNF, IFNy, IL-la, and LPS) as the least cytotoxic cytokine combination among the most cytotoxic combinations grouped together at the highest level of clustering. A mutual information analysis of the same LDH release cytotoxicity data set revealed that LPS
IFNy • TNF 0 RH IL-1 A 4 G2 ORH IL-6 A IL-la C3 RH
--
---G2e C3 Gk LPS I . .. Treatments A Cytokine LDH outcomes o 24hr * 48hr Cells RH Rat hepatocytes
G2 HepG2 cell line
treatment was the most informative of the entire data set, followed by IFNy, IL- la, TNF, IL-6, and IL-103 (Figure 9).
Euclidean clustering of LDH release outcomes eq It X o.~ .E X 0.( *co~ *c; N =C4 0 0 Mix C 0 5 Fold change vs no cytokine control
Figure 8. Euclidean clustering of LDH release data sets from both the human hepatoma cell lines and primary rat hepatocytes. Cell systems clustered by time point,
with the HepG2 cell line and its subclone clustering closely at both 24 and 48 hours. The primary rat hepatocyte data set from 48 hours was by far the most cytotoxic. Cytokine mix C is identified as the least cytotoxic cytokine combination among the combinations that exhibited the most cytotoxicity and clustered together at the highest level.
O Treatment included * Treatment n=t included
Treatment variable included ] Cumulative mutual Information of each
Treatment variable not included
*
treatment variableLPS TNF IL-la IL-1 3 IL-6 IFNy Mutual information of selected treatments 1 2 3 4 5 6
Number of cytokine treatment variables
Figure 9. Mutual information evaluation to choose the most informative cytokines.
A second-order joint entropy approximation was used [Bracken King].
3.4 Conclusions
To maximize our efficiency in subsequent experiments, we chose to only continue testing the hepatotoxic responses of HepG2s and primary rat hepatocytes. Keeping in mind that our ultimate goal was to identify a cell system that closely mimics an in vivo human liver, it seemed prudent to maintain the use of at least one of the human hepatoma cell lines. Clustering illustrated the similarity between LDH release outcomes of HepG2s and C3As, which would be expected since C3As are a HepG2 subclone (Figure 8). To capture the greatest variability across the cell systems, we decided to keep using the HepG2 cell line, which clustered farthest from the primary rat hepatocytes at each time point.
Clustering of the 64 cytokine treatment combinations in order of increasing toxicity across the outcomes was also informative (Figure 8). Cytokine mix C was chosen for use
in subsequent experiments due to its sub-maximal hepatotoxic effects; our aim was to observe drug-cytokine synergies across a range of drug concentrations. The absence of IL-6 and IL- 10 from this combination is reminiscent of their minimal effect on
cytotoxicity as highlighted in the PCA and mutual information results (Figures 8, 9). In fact, mutual information quantitatively substantiated our decision to eliminate IL-10 from future experiments (Figure 9). Our decision was further supported by the biology; both IL-la and IL- 10 bind to the same receptor (IL-1R), eliciting similar cell signaling responses in hepatocytes, though often with differing potency depending on other co-stimulations [Luedde et al., 2006].
4
Identifying drug-cytokine synergies
4.1 RationaleIt was important to identify the concentration of each drug which best synergized with a representative inflammatory cytokine background (cytokine mix C) to cause cytotoxicity in both HepG2s and primary rat hepatocytes for use in the 5-cytokine/LPS multiplex experiment. To achieve this goal, we compared the dose-response curves of drug pairs at the same molar concentration, as opposed to at equivalent multiples of their Cmax values (maximum plasma drug concentrations in human administration). Scaling relative to the Cmax values was avoided because these could differ drastically for any given pair of drugs, due to differences in compound efficacy and pharmacodistribution (Table 3). Also, testing each drug pair at the same molar concentration provides more comparable data in an in vitro system and is more applicable in a model trained to identify idiosyncratic hepatotoxicity during laboratory development, prior to clinical testing. As reported in Table 3, 100*Cmax values provide an estimate of the worst-case liver exposure and exist at the high end of the "therapeutic window," or the dose range that elicits therapeutic effects without causing toxicity alone. Preliminary experiments were used to inform the concentration range that was tested in both cell systems using LDH release and caspase activity assays at three time points.
4.2 Comparison of drug pairs across an inflammatory background
Cytotoxicity and apoptosis were measured spanning a range of drug concentrations at three time points in both cell systems. Only LDH release measurements were considered in identifying the optimal drug concentration for each analogous pair since the LDH release assay captures both apoptotic and non-apoptotic cell death.
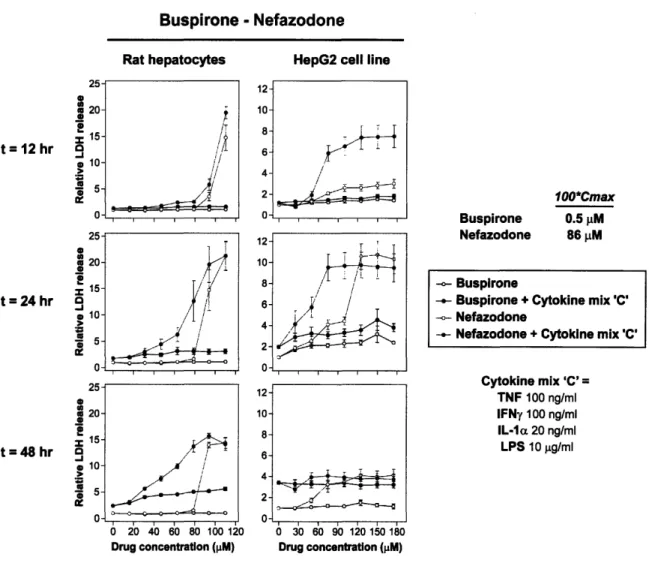
Nefazodone, the idiosyncratic drug of the serotonin receptor inhibitor drug pair, showed clear drug-cytokine synergy at about 75 [iM in both cell systems at 24 hours (Figure 10). This synergy was also evident at 48 hours in the primary rat hepatocytes. In HepG2s, the earlier onset of synergistic cytotoxicity may explain the decrease in
measured LDH release at 48 hours; released LDH has a half-life of approximately 9 hours in the surrounding medium. The non-idiosyncratic analog buspirone exhibited minimal toxicity, regardless of an inflammatory cytokine background (Figure 10).
In the clarithromycin-telithromycin drug pair, it was interesting that clarithromycin displayed cytokine synergies at about 175 gM (Figure 11). Although clarithromycin was included in this study as telithromycin's non-idiosyncratic analog, it is also associated with idiosyncratic liver injury, although to a lesser extent. It caused synergistic
hepatotoxicity at 24 and 48 hours in both cells systems. On the other hand, telithromycin did not appear to cause this same toxicity, and instead somewhat irregular dose-response curves were measured at both later time points (Figure 11). A hypothesis for this
potentially unreliable data is discussed in Section 6.
Although both aspirin and nimesulide never demonstrated clear drug-cytokine synergy in the primary rat hepatocytes (nimesulide-mediated effects seem to dominate), nimesulide did induce synergistic toxicity at about 450 [LM in the human hepatoma cell line at 24 hours (and to a lesser extent at 12 hours as well) (Figure 12). These effects had faded by 48 hours, similar to nefazodone. No aspirin-cytokine synergy was observed in HepG2 cells.
In contrast, ranitidine-cytokine synergy was measured by LDH release at 48 hours in primary rat hepatocytes (and to a lesser extent at 24 hours), but not in the cell line (Figure
13). This comes with the caveat that this synergy was observed at about 450 [tM (317*Cnx.), a far higher concentration than is probably physiologically relevant. Also, similar to the clarithromycin-telithromycin drug pair, it was the non-idiosyncratic analog that displayed drug-cytokine synergy. However, ranitidine is also associated with liver injury, although to a lesser extent than cimetidine, and tested positive for hepatotoxicity in Roth's rat model (Table 3). Famotidine, the histamine H2-receptor antagonist analog used by Roth, will probably be used as the non-idiosyncratic analog to ranitidine in future experiments with this class of compounds.
Trovafloxacin is another compound considered to be an idiosyncratic hepatotoxin according to the Roth model. It too showed clear drug-cytokine synergy at about 450 [IM in both cell systems at all time points, most notably at 24 hours (Figure 14). In addition, it caused a much higher level of measured cytotoxicity in the HepG2 cell line compared to primary rat hepatocytes than was seen for any of the other drugs. To compare, its non-idiosyncratic analog levofloxacin exhibited negligible synergy across the board, as measured by LDH release (Figure 14).
The pair of catechol-O-methyl transferase inhibitors, entacapone and tolcapone, which proved fickle during preliminary experiments, once again did not show clear drug-cytokine synergy (Figure 15). These drugs were tested at high molar concentrations due to their relatively high 100*C. values, possibly explaining their poor solubility. Also, like telithromycin, these drugs produced potentially-unreliable dose-response curves that may have been caused by unknown off-target effects.
Buspirone - Nefazodone
Rat hepatocytes HepG2 cell line
25-_ 20--I S15-t = 12 hr e 10 -I 25-2 20- 15-t =24 hr 0
10-Z 0
1W
25-0 S20-t =48 hr 15-S10-Z
ST<
d,I 12- 4-2-Sio 40 60 80 100o 12io
Drug concentration (pM) I / S30 60 90 12o 150 18o Drug concentration (pM) 100*Cmax Buspirone 0.5 pM Nefazodone 86 pM - Buspirone
- Buspirone + Cytokine mix 'C'
- Nefazodone
- Nefazodone + Cytokine mix'C'
Cytokine mix 'C' =
TNF 100 ng/ml IFNy 100 ng/ml
IL-la 20 ng/ml
LPS 10 .g/ml
Figure 10. Dose-response curves of the buspirone-nefazodone drug pair from the mean LDH release data in both cell systems at three time points. Nefazodone showed
clear drug-cytokine synergy around 75 1iM at 24 hours in HepG2s and primary rat
hepatocytes. Error bars represent the standard error across four or more biological replicates. ,i I I I I I r 7I --i i C-- ~ .~d 1 ~4~
Clarithromycin - Telithromycin o 15-0 - 10-t = 12 hr 0 5- 0-=1 -1 t =24 hr a 0 15-0 t=48 hr , S5- 0-Rat hepatocytes 0o 100 200 300 400 500 Drug concentration (pM)
HepG2 cell line
Clarithromycin Telithromycin 100*Cmax 334 pM 277 pM Clarithromycin
Clarithromycin + Cytokine mix 'C'
Telithromycin
Telithromycin + Cytokine mix 'C'
Cytokine mix 'C' = TNF 100 ng/ml IFNy 100 ng/ml IL-la 20 ng/ml LPS 10 pg/ml 0 100 200 300 400 Drug concentration (pM)
Figure 11. Dose-response curves of the clarithromycin-telithromycin drug pair from the mean LDH release data in both cell systems at three time points. Clarithromycin
showed clear drug-cytokine synergy around 175 tM at 24 and 48 hours in HepG2s and primary rat hepatocytes. Error bars represent the standard error across four or more biological replicates.
Aspirin - Nimesulide
30-> 10-
0-.5 r• 30 o £ 20 t = 24 hr a, > 10 U .5 S S 4US S t=48 hr9
>-S 'U .5 Rat hepatocytes / S. , i IHepG2 cell line
1 2- 0-0 200 400 600 800 1000 Drug concentration (pM) \I
.174/
100*Cmax Aspirin 552 pM Nimesulide 2108 pM - Aspirin- Aspirin + Cytokine mix 'C'
-- Nimesulide
- Nimesulide + Cytokine mix 'C'
Cytokine mix 'C' = TNF 100 ng/ml IFNy 100 ng/ml IL-l c 20 ng/ml LPS 10 jlg/ml 0 200 400 600 800 Drug concentration (pM)
Figure 12. Dose-response curves of the aspirin-nimesulide drug pair from the mean LDH release data in both cell systems at three time points. Nimesulide showed clear drug-cytokine synergy around 450 gM at 24 hours in HepG2s. Error bars represent the standard error across four or more biological replicates.
I
I I I
Ranitidine -Cimetidine
Rat hepatocytes HepG2 cell line
8-t= 12 hr 9 4- 8- S-I 6-t =24 hr 9 4-* 2- 0-
8-I
t=48 hr -1 .5 0 260 400 600 800•oo00
Drug concentration (pM) 100*Cmax Ranitidine 142 pM Cimetidine 1542 pM -- Ranitidine- Ranitidine + Cytokine mix 'C' - Cimetidine
- Cimetidine + Cytokine mix 'C'
Cytokine mix 'C' TNF 100 ng/ml IFNy 100 ng/ml IL-la 20 ng/ml LPS 10 pg/ml 0 260 460 600 800 1000 Drug concentration (pM)
Figure 13. Dose-response curves of the ranitidine-cimetidine drug pair from the mean LDH release data in both cell systems at three time points. Ranitidine showed
clear drug-cytokine synergy around 450 piM at 24 and 48 hours in primary rat
hepatocytes. Error bars represent the standard error across four or more biological replicates.
ca ~ko~
I I 1 7 1 r
~BSS~i~
Levofloxacin - Trovafloxacin
Rat hepatocytes
. \i;
HepG2 cell line
8- 6-t =12 hr 4 S2- 0- 8- 2-0 8- 6-t 48 hr 4- 2- 0- 8- *j6--i 0-~---I 0 200 400 600 800 Drug concentration (pM) -4-~·J -; Levofloxacin Trovafloxacin 100*Cmax 1577 pM 769 pM - Levofloxacin
Levofloxacin + Cytokine mix 'C'
-- Trovafloxacin
Trovafloxacin + Cytokine mix 'C'
Cytokine mix 'C' = TNF 100 ng/ml IFNy 100 ng/ml IL-la 20 ng/ml LPS 10 jpg/ml 0 200 400 600 800 Drug concentration (pM)
Figure 14. Dose-response curves of the levofloxacin-trovafloxacin drug pair from the mean LDH release data in both cell systems at three time points. Trovafloxacin
showed clear drug-cytokine synergy around 450 RM at 24 and 48 hours in HepG2s and
primary rat hepatocytes. Error bars represent the standard error across four or more biological replicates.
6 _I t=12 hr a, g 'U ._ "6 o a t = 24 hr 9 a UI loS a U S. 10-t =48 hr 0 5-> 5- 0-Entacapone -Rat hepatocytes
J
/1'
T TolcaponeHepG2 cell line
1- 0-100*Cmax Entacapone 393 pM Tolcapone 2084 pM -o- Entacapone
- Entacapone + Cytokine mix 'C'
-- Tolcapone
-- Tolcapone + Cytokine mix 'C'
Cytokine mix 'C' = TNF 100 ng/ml IFNy 100 ng/ml IL-la 20 ng/ml LPS 10 gg/ml 0 200 400 600 800 1000 0 100 200 300 400 500 600
Drug concentration (pM) Drug concentration (pM)
Figure 15. Dose-response curves of the entacapone-tolcapone drug pair from the mean LDH release data in both cell systems at three time points. Neither drug showed clear drug-cytokine synergy at any time point in either cell system. Error bars represent the standard error across four or more biological replicates.
4.3 Drug-cytokine synergy calculations
As explained in Section 2.3.5, we then set about to qualitatively identify a single drug concentration that demonstrated synergistic toxicity in both cell systems for each
compound. A representative graph is shown below (Figure 16), with the concentration
listed from the experiment in which the projected toxicity value most under-predicted that obtained experimentally. These results are compiled in Table 4. Table 5 presents the drugs and their corresponding concentrations that were selected for the 5-cytokine/LPS multiplex experiments.
I I'
'
¢ I I I o
1 r I i I r