The Effect of Differential Color Refraction on Astrometric
Observations of Solar System Bodies and Earth Satellites from
Ground-Based Optical Telescopes
byRoman O. Geykhman
B.S.E, B.A., University of Pennsylvania (2007) S.M., Massachusetts Institute of Technology (2011) Submitted to the Department of Aeronautics and Astronautics
in partial fulfillment of the requirements for the degree of Doctor of Philosophy in Aeronautics and Astronautics
at the
MASSACHUSETTS INSTITUTE OF TECHNOLOGY September 2019
c
○ Massachusetts Institute of Technology 2019. All rights reserved.
Author . . . . Department of Aeronautics and Astronautics
August 1, 2019 Certified by . . . . Kerri Cahoy Associate Professor of Aeronautics and Astronautics Thesis Supervisor Certified by . . . . Richard Binzel Professor of Planetary Sciences Certified by . . . . Paul Chodas Director, Center for Near Earth Object Studies, NASA Jet Propulsion Laboratory Certified by . . . . Joseph Scott Stuart Technical Staff, MIT Lincoln Laboratory Accepted by . . . .
Sertac Karaman Associate Professor of Aeronautics and Astronautics Chairman, Graduate Program Committee
The Effect of Differential Color Refraction on Astrometric Observations of Solar System Bodies and Earth Satellites from Ground-Based Optical
Telescopes by
Roman O. Geykhman
Submitted to the Department of Aeronautics and Astronautics on August 1, 2019, in partial fulőllment of the
requirements for the degree of
Doctor of Philosophy in Aeronautics and Astronautics
Abstract
Earth’s atmosphere is optically dispersive and subjects astrometric observations from ground-based optical telescopes to systematic bias from differential color refraction (DCR). This bias is evident in Minor Planet Center observations of asteroids with known spectral types and in observations of GPS and GLONASS satellites. DCR bias is on the order of 0.1 arcsec, and until recently, őxed-pattern star catalog errors exceeded this level. With the release of the Gaia DR2 star catalog in April of 2018, catalog error is no longer dominant and the systematic error ŕoor in ground-based astrometry is deőned by DCR.
Unaccounted-for DCR bias in observations can introduce a small but statistically signiőcant bias into the estimate of Keplerian mean motion of inner Solar System asteroids, reduce the probability of successfully observing a stellar occultation by a Kuiper Belt Object, and in rare pathological cases can mean the difference between predicting an impact or a miss by a hazardous asteroid. DCR in observations of geostationary satellites can introduce a large bias into the estimate of solar radiation pressure area-to-mass ratio in a single-night orbit őt and tens of meters of error into an orbit prediction derived from several nights of observation.
Measurements of the 2017 near-Earth ŕyby of the asteroid 3122 Florence from MIT and MIT Lincoln Laboratory facilities in Westford, MA and Socorro, NM suggest that narrow passbands are insufficient to mitigate DCR, and measurements of a sample of geostationary satellites’ spectra at the US Naval Observatory Flagstaff Station show that the DCR bias of active satellites can vary by up to 0.1 arcsec over half an hour. While the DCR of őducial stars is predictable from catalog data, satellites’ DCR must be measured directly. To that end, a slitless spectrograph was deployed at the Firepond Optical Facility in Westford, MA and observed GPS and GLONASS satellites over seven nights. Using that data, I demonstrate DCR compensation yielding a 60% reduction in bias and 30% reduction in noise in astrometric residuals relative to color-agnostic processing when all atmosphere-induced effects (stellar DCR, target DCR, and parallactic refraction) are accounted for.
Disclaimer: This material is based upon work supported by the National Aeronautics and Space Administration (NASA) and the Office of the Director of National Intelligence (ODNI), Intelligence Advanced Research Projects Activity (IARPA) under Air Force Contract No. FA8702-15-D-0001. Any opinions, findings, conclusions or recommendations expressed in this material are those of the author(s) and do not necessarily reflect the views of NASA, ODNI, IARPA or the U.S. Air Force. DISTRIBUTION STATEMENT A. Approved for public release. Distribution is unlimited.
Thesis Supervisor: Kerri Cahoy
Acknowledgments
This document includes content reproduced from the following sources, used with permission ∙ R. Geykhman and K. Cahoy. Spectroscopic measurements of asteroids allow mitigation of
dif-ferential color refraction effects on ground-based astrometry and orbit prediction accuracy. In
Proc.SPIE 10702, Ground-based and Airborne Instrumentation for Astronomy VII, 107024U
(6 July 2018); https://doi.org/10.1117/12.2312230
∙ R. Geykhman and K. Cahoy. The effect of differential color refraction on short-arc estimation of the area-to-mass ratio of geostationary objects using ground-based telescopes. In
Astrody-namics 2018. Proceedings of the AAS/AIAA AstrodyAstrody-namics Specialist Conference held August 19–23, 2018, Snowbird, Utah, U.S.A., pp 1975–1994. Univelt, 2019. ISBN 978-0-87703-657-9
∙ R. Geykhman and K. Cahoy. The Effect of Differential Color Refraction on Asteroid Orbital Parameter Estimates. Submitted for publication, 2019
Although these results have only been published in the past year, it would be correct to say I have been working on the research described in this document in one form or another since October 2008. Back then, as a kid barely out of school, I volunteered for the engineering team tasked with reactivating the Firepond Optical Facility, and all of this ŕowed from there. There was no straight path to here, it took a while for all of the pieces to come together, and I have many people to thank for their guidance, assistance, and support during the intervening years.
The longest list of names is that of the people whose effort was necessary to collect the many hundreds of gigabytes of raw data used for this thesis. This data was collected over many years and many nights at many sites. For the data from the MIT Lincoln Laboratory Experimental Test Site in Socorro, New Mexico, I would like to thank Greg Spitz and Matthew Blythe. For the data from the MIT George R. Wallace Astrophysical Observatory in Westford, Massachusetts, I am grateful to Tim Brothers and Mike Person. For the data from the US Naval Observatory Flagstaff Station, I would like to thank Dave Monet. For the data from the MIT Lincoln Laboratory Firepond Optical Facility in Westford, Massachusetts, the list of people is the longest and presented in no particular order: Armand O’Donnell, Pete Trujillo, Wayne Robertson, Julie Johnson, Alex Szabo, Joseph Swick, Rodney Case, Dan Bonhomme, Mark Derome, Jon Byford, Jim Traffie, Bruce Whittier, Steve Cummiskey, Nik Waggener, Rebecca Busacker, Dave Radue, Jan Kansky, Phil Maynard, Carlos Gonzalez Huertas, Paul Pepin, Dan Birchall, Meg Noah, Gene Rork, Jack Fleischman, Steve Hunt, and Larry Swezey.
I would also like to thank my doctoral committee and Lincoln Scholars advising team for their input over the past few years. To Kerri Cahoy, Paul Chodas, Rick Binzel, Scott Stuart, Arthur Lue, Deborah Woods, and Zach Folcik: Thank you all.
For the őnancial support of this thesis, I would like to thank the Lincoln Scholars Program and speciőcally Jim Ward, Tim Hall, Sumanth Kaushik, and Larry Candell for their vote of conődence in approving my dive back into school. I would also like to extend thanks to the David Karp Memorial Fund at Lincoln Laboratory for the support of my studies and to Jon Ashcom for helping to secure the funding for the construction and operation of the spectrograph at Firepond.
In closing, I would like to thank my parents Oskar and Eugenia Geykhman and my grandparents Viktor Serman and Liliya Kamchatova for raising me right, teaching me to work, and sending me to school, and my wife Rena Zheng for everything else that came after.
Contents
Front Matter 1 Abstract . . . 3 Acknowledgements . . . 5 Contents . . . 7 List of Figures . . . 15 List of Tables . . . 23 List of Abbreviations . . . 25 Notation . . . 27 1 Introduction 29 1.1 Phenomenology . . . 291.2 Evidence of DCR Bias and Its Signiőcance . . . 31
1.2.1 Astrometric Observations of Calibration Satellites in Earth Orbit . . . 31
1.2.2 Astrometric Observations of Asteroids with Known Spectral Types . . . 35
1.3 Motivation . . . 37
1.3.1 Improvements in Star Catalog Accuracy . . . 37
1.3.2 Asteroid Search . . . 38
1.3.2.1 Hazardous Asteroid Impact Monitoring . . . 38
1.3.2.2 Yarkovsky Effect Characterization . . . 42
1.3.3 Kuiper Belt Object Occultations . . . 43
1.3.4 Near-Earth SSA . . . 44
1.3.4.1 Satellite Debris Monitoring in Earth Orbit . . . 44
1.3.4.2 Resolved Imaging of Geostationary Satellites . . . 45
1.4 Gap Analysis and Thesis Contributions . . . 46
2 Literature Review 49
2.1 Astrometry Through Time . . . 49
2.1.1 Eyeball Era . . . 49
2.1.2 Photographic Plate Era . . . 50
2.1.3 Electronic Era . . . 50
2.1.4 Sources of Measurement Error in CCD Astrometry . . . 52
2.2 Star Catalog Accuracy . . . 53
2.2.1 Photographic Plate Catalogs . . . 54
2.2.2 Space-Based Catalogs . . . 54
2.2.3 Ground-Based CCD Catalogs . . . 55
2.2.4 Observation Reőnement With A-Posteriori Catalog Corrections . . . 55
2.3 Spectroscopic Measurements of Solar System Bodies . . . 56
2.3.1 Past and Current Surveys of Asteroids . . . 56
2.3.2 Kuiper Belt Objects . . . 59
2.4 Spectroscopic Measurements of Satellites . . . 59
2.4.1 Satellite Materials . . . 59
2.4.2 In-Situ Measurements . . . 60
2.5 Atmospheric Refraction . . . 61
2.5.1 Models of Refraction and Their Applicability . . . 61
2.5.2 Differential Color Refraction (DCR) . . . 61
2.6 Ephemeris Propagation . . . 62
2.6.1 Heliocentric Force Model . . . 62
2.6.2 Geocentric Force Model . . . 63
3 Methods 65 3.1 Overall Theme . . . 65
3.2 Data Sources . . . 66
3.2.1 Reduced Data and Ephemerides . . . 66
3.2.1.1 International Astronomical Union Minor Planet Center . . . 66
3.2.1.2 Jet Propulsion Laboratory . . . 66
3.2.1.3 International GNSS Service . . . 66
3.2.2 On-Sky Measurements . . . 67
3.2.2.1 MIT George R. Wallace, Jr. Astrophysical Observatory . . . 67
3.2.2.2 United States Naval Observatory Flagstaff Station . . . 68
3.2.2.4 MIT Lincoln Laboratory Firepond Optical Facility . . . 69
3.3 The OrbitTool Software Framework . . . 70
3.3.1 Design Philosophy . . . 71
3.3.2 Coordinate System Deőnitions . . . 71
3.3.3 Propagation of Ephemerides . . . 74
3.3.4 Optical Observation Model . . . 76
3.3.4.1 Aberration . . . 76
3.3.4.2 Refraction and Parallax . . . 78
3.3.5 Orbit Fitting . . . 79 3.3.6 Validation . . . 82 3.4 Astrometric Algorithms . . . 87 3.4.1 Image Segmentation . . . 87 3.4.1.1 Pixel Categorization . . . 87 3.4.1.2 Pixel Aggregation . . . 89
3.4.2 Point Spread Function Fitting . . . 90
3.4.3 Star Matching . . . 92
4 Predictions, Analysis, and Preliminary Measurements 95 4.1 DCR Bias of Stars . . . 95
4.1.1 Blackbody Approximation Method . . . 96
4.1.1.1 Simpliőed Approach . . . 96
4.1.1.2 Choosing The Blackbody Temperature . . . 97
4.1.2 The Effect of Interstellar Reddening . . . 102
4.1.3 Multi-Color Direct Polynomial Approximation . . . 107
4.1.3.1 UCAC Color Indices . . . 107
4.1.3.2 Gaia DR2 Three Color and Parallax . . . 110
4.1.3.3 DCR of the Average Star and the Merits of Per-Star DCR Compensation 110 4.2 DCR Bias of SSA Targets . . . 113
4.2.1 Asteroids . . . 113
4.2.2 Kuiper Belt Objects . . . 116
4.2.3 Earth Satellites . . . 116
4.3 Extended Analysis of Minor Planet Center Observations of Asteroids With Known Spectral Types . . . 117
4.5 Preliminary Measurements on 3122 Florence . . . 128
4.5.1 Scenario . . . 128
4.5.2 Timing Validation . . . 129
4.5.3 Ephemeris Reőnement . . . 130
4.5.4 Results . . . 131
4.6 Spectroscopic Measurement Requirements . . . 135
4.6.1 Resolution Requirement for Satellites, Asteroids, and KBOs . . . 135
4.6.2 Resolution Requirement for Asteroids with Unmodeled Absorption Bands . . . . 136
4.6.3 Accuracy Requirement in Terms of Time-Aperture Product . . . 139
4.7 Chapter Summary . . . 145
5 Simulations of Orbit Solutions from DCR-Biased Observations 147 5.1 Inner Solar System Asteroids . . . 147
5.1.1 Simulation Scenario . . . 147
5.1.2 Mean Motion Bias and Recovery Residual for Single-Apparition Fits . . . 149
5.1.3 Masked Signature of DCR . . . 150
5.1.4 Exploration of the Orbital Element Space . . . 158
5.2 Spurious Detection of Yarkovsky Acceleration . . . 159
5.2.1 Sensitivity of Yarkovsky Term to Observation Bias . . . 159
5.2.2 Physically-Plausible Yarkovsky Accelerations . . . 161
5.2.3 Existence of Orbits Susceptible to Spurious Yarkovsky Detections . . . 163
5.2.4 Post-Fit Residuals of Orbit Fits with (Spurious) Yarkovsky Acceleration . . . 166
5.2.5 Likelihood of a Scenario Susceptible to Spurious Yarkovsky Acceleration . . . 168
5.3 Impact Monitoring of Potentially Hazardous Asteroids . . . 169
5.3.1 False Conődence in Optics-Only Predictions of Near Misses: An Example . . . . 169
5.3.1.1 Bias in the B-Plane . . . 170
5.3.1.2 Estimated Impact Probability vs. Observation Elevation Limit . . . 172
5.3.1.3 Impact Probabilities with Albedo-Only DCR Estimation . . . 173
5.3.2 Impact Point Bias of Known Impactors . . . 174
5.3.2.1 Evolution of the Impact Point Estimate of the Apophis-Like Example After 2029 . . . 174
5.3.2.2 Short-Timescale Evolution of Impact Point for Newly Discov-ered Impactors . . . 178
5.4 Prediction of Stellar Occultations by Kuiper Belt Objects . . . 180
5.4.2 Simulation Results . . . 182
5.4.3 Conclusions . . . 188
5.5 DCR Bias in Geostationary Orbits . . . 188
5.5.1 Scenario . . . 189
5.5.2 Cross-Track Prediction Accuracy . . . 189
5.5.3 Area-to-Mass Ratio Bias . . . 191
5.5.4 Sub-20 Meter Conjunction Predictions . . . 196
5.5.5 Empirical Validation of Predictability of GEO Appulses . . . 196
5.5.5.1 Ballistic Target Selection . . . 197
5.5.5.2 One-Night AMR Estimation . . . 197
5.5.5.3 Cross-Track Predictability . . . 198
5.6 Chapter Summary . . . 199
6 DCR Compensation of Observations of GPS and GLONASS Satellites with Concurrent Spectroscopy at the Firepond Optical Facility 201 6.1 Slitless Spectroscopy . . . 202
6.1.1 Spectrograph Design Considerations . . . 202
6.1.1.1 Mechanisms to Divide Light . . . 202
6.1.1.2 Grating Spectrographs . . . 203
6.1.2 Transmission Grating Geometry . . . 205
6.1.3 Grating Efficiency Calculation . . . 206
6.2 Slitless Spectroscopy of Geostationary Satellites at the US Naval Observatory Flagstaff Station . . . 208
6.2.1 Slitless Spectroscopy Processing . . . 209
6.2.2 Results from NOFS Measurements . . . 211
6.2.3 Conclusions . . . 213
6.3 Multi-band Photometry of GPS and GLONASS Satellites . . . 213
6.3.1 Scenario . . . 213
6.3.2 Results from Multiband Photometry Experiment . . . 214
6.4 Design of the Firepond Slitless Spectrograph . . . 216
6.5 Performance Predictions . . . 218
6.5.1 SNR and Suppression of Contamination by Higher Spectral Orders . . . 218
6.5.2 SNR of m = 0 PSF . . . 219
6.6 Assembly and Laboratory Testing . . . 223
6.6.1 Test Overview . . . 223
6.6.2 Spot Projector . . . 225
6.6.2.1 Breadboard Free-Space OAP Spot Projector . . . 225
6.6.2.2 Commercial Mirror Lens Spot Projector . . . 227
6.6.2.3 All-Reŕecting Amateur Telescope Spot Projector . . . 228
6.6.3 Mechanical Stability Validation . . . 228
6.6.4 Absolute Photometric Calibration . . . 229
6.6.4.1 Measurement Through Achromat Lens . . . 230
6.6.4.2 Measurement of Spot Projector Transmittance and Pinhole Spectrum . . 232
6.6.5 Relative Photometric Calibrations . . . 233
6.6.5.1 Blocking Filter Transmittance Validation . . . 234
6.6.5.2 Grating Efficiency Validation . . . 234
6.7 Installation, Checkouts, and On-Sky Calibration . . . 238
6.7.1 Kinematic Stability Relative to 48ž Telescope . . . 240
6.7.1.1 The Necessity of Mount Bias Models . . . 240
6.7.1.2 Empirical Bias Model for the Spectrograph . . . 241
6.7.2 Wavelength Scale . . . 242
6.7.3 Seeing and Achieved Resolution . . . 246
6.7.4 Grating Tilt Calibration . . . 247
6.7.5 Photometry Validation . . . 248
6.7.5.1 Filter Transmittance Check . . . 248
6.7.5.2 Total Spectral Transmittance Validation . . . 249
6.7.5.3 Results of On-Sky Photometric Validation . . . 250
6.7.6 Refraction Model Validation . . . 252
6.7.6.1 Horizon Reference . . . 253
6.7.6.2 Results of Spectral Refraction Validation . . . 254
6.7.7 Discussion of On-Sky Calibration . . . 255
6.8 Satellite Measurements at the Firepond Optical Facility . . . 259
6.8.1 Planning Observations . . . 259
6.8.2 Summary of Data Collections . . . 260
6.8.2.1 Brightness of Targets . . . 260
6.8.2.2 Sky Brightness . . . 262
6.8.3 Spectroscopy Results . . . 266
6.8.3.1 DCR Compensation with Spectroscopy . . . 266
6.8.3.2 Analysis of DCR Prediction Error Statistics . . . 268
6.8.3.3 Difference in Atmosphere vs Difference in Targets . . . 270
6.8.3.4 Blue Glint . . . 273
6.8.4 Experiment Summary . . . 275
6.9 Chapter Summary . . . 276
7 Conclusion 279 7.1 Summary of Original Contributions . . . 279
7.1.1 Dominance of DCR Bias in Ground-Based Optical Astrometry . . . 279
7.1.2 Consequences of Unaccounted-for DCR Bias in Orbit Solutions . . . 280
7.1.3 Compensation of DCR Bias with Concurrent Spectroscopy . . . 281
7.2 Recommendations . . . 282
7.2.1 Astrometric Data Collection . . . 282
7.2.2 Astrometric Data Reduction . . . 282
7.2.3 Orbit Fitting . . . 283
7.3 Future Work . . . 284
7.3.1 Further Spectroscopic Measurements . . . 284
7.3.1.1 Asteroids and KBOs . . . 284
7.3.1.2 Earth Satellites . . . 285
7.3.2 Handling Existing Data . . . 285
7.3.2.1 Reprocessing Raw Imagery of Solar System Bodies . . . 285
7.3.2.2 Color-Aware Farnocchia-Style Corrections . . . 286
7.3.2.3 Maximum-Likelihood Orbit Determination . . . 286
List of Figures
1-1 Schematic of DCR Bias . . . 30
1-2 Accuracy Assessment of GEODSS Observations in the Late 1990s . . . 32
1-3 Firepond Recommissioning Team, June 12, 2009 . . . 33
1-4 Residuals of Observations of GPS and GLONASS Satellites Reduced with URAT1 . 34 1-5 Residuals of Archived Observations of S-type and C-type Numbered As-teroids Resolved into Station-Local Horizontal/Vertical Coordinates . . . 36
1-6 Orbit Geometry for Two-Dimensional Analysis of Signiőcance of DCR on Asteroid Impact Predictions . . . 39
1-7 Impact Point Bias in Two-Dimensional Analysis of q = 0.9, Q = 1.0 Orbit . . . 41
1-8 Schematic of Yarkovsky Effect . . . 42
1-9 Schematic of Stellar Occultation . . . 43
1-10 Appulses of Guidestars by a Geostationary RSO . . . 45
2-1 Bus-DeMeo Asteroid Taxonomy . . . 58
2-2 Asteroid Reŕectance Spectra for Selected Taxonomic Classes . . . 58
2-3 Quaoar Reŕectance Spectrum . . . 59
2-4 Spectral Reŕectances of Common Spacecraft Materials . . . 60
3-1 MIT George R. Wallace Astrophysical Observatory, Westford, MA . . . 67
3-2 1.3 Meter Telescope at USNO, Flagstaff, AZ . . . 68
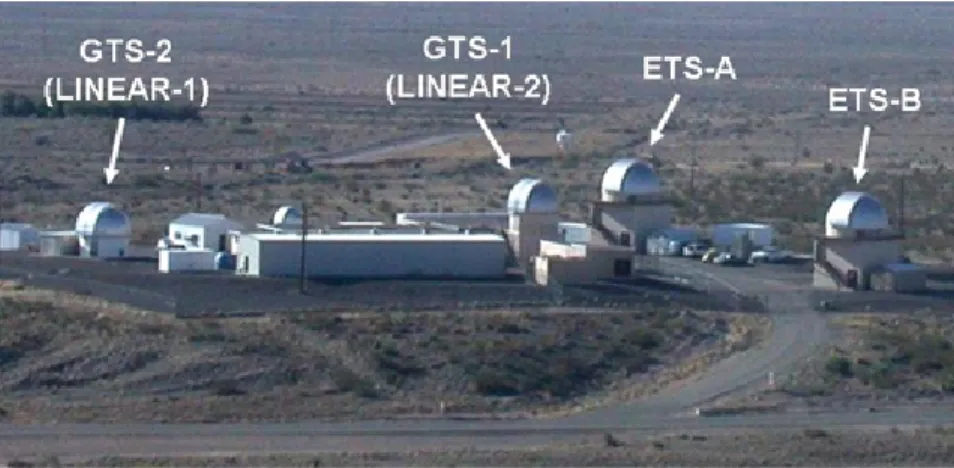
3-3 MIT Lincoln Laboratory Experimental Test Site, Socorro, NM . . . 68
3-4 MIT Lincoln Laboratory Firepond Optical Facility, Westford, MA . . . 69
3-5 Schematic of Local Right/Down/Out and East/North/Out Coordinates . . . 73
3-6 Relativistic Aberration of Light in Optics Observation Model . . . 77
3-8 Heliocentric Force Model Validation . . . 83
3-9 Geocentric Force Model Validation . . . 85
3-10 High-Pass Kernel . . . 88
3-11 Schematic of Calculation of Charge Density and Pixel Signal for Streaking PSF . . . 91
4-1 Empirical Observation of DCR of Stars at Firepond . . . 97
4-2 Predicted DCR Error from Blackbody Spectrum Approximations at West-ford, MA and Socorro, NM . . . 98
4-3 Color-Color Diagram of Pickles Atlas Stars . . . 100
4-4 Residual Error of DCR for Pickles Stars Approximated with DCR-Optimal Blackbody Temperature . . . 100
4-5 DCR Error of Blackbody Spectrum Approximations Derived from Multi-color Photometry . . . 101
4-6 Biases from Neglecting Interstellar Extinction . . . 103
4-7 URAT1 Brightness and Color Statistics . . . 106
4-8 DCR of Reddened Stellar Spectra vs. DCR of Blackbody Spectra Inferred from B − V with Bare Silicon Detector at Sea Level . . . 106
4-9 DCR Prediction Error vs. Elevation for Polynomial Function of UCAC5 Photometry 109 4-10 DCR Prediction Error vs. Elevation for Polynomial Function of Gaia DR2 Photometry and Stellar Parallax . . . 111
4-11 DCR Bias for the Average Catalog Star Relative to Solar-Analog . . . 112
4-12 DCR Bias for Asteroids vs. Elevation Angle . . . 113
4-13 Sensitivity of Difference in S-type and C-type Asteroid DCR Bias to Me-teorological Conditions and Detector Type . . . 114
4-14 DCR Accuracy with Albedo-Based Classiőcation . . . 115
4-15 DCR Bias for KBOs vs. Elevation Angle. . . 116
4-16 DCR Bias Predictions for Satellites at Sea Level . . . 117
4-17 Residuals of Bare CCD Farnocchia-Corrected Observations of Asteroids with Radar-Constrained Orbits and Known Spectral Types . . . 119
4-18 Residuals of Narrow Passband and Broad Passband Farnocchia-Corrected Observations of Asteroids with Well-Constrained Optics-Only Orbits and Known Spectral Types . . . 122
4-19 Residuals of Observations of Optics-Only Objects with Unspeciőed
Pass-band Broken Down by Sites . . . 123 4-20 Residuals of Observations of Optics-Only Objects with Johnson V
Pass-band Broken Down by Sites . . . 124 4-21 Residuals of Observations of Optics-Only Objects with Johnson R
Pass-band Broken Down by Sites . . . 125 4-22 Mean ±3σ Horizontal and Vertical Residuals of S- and C-type Asteroids
in Subset of LINEAR Data Reprocessed with UCAC5 . . . 126 4-23 Observing Geometry of 3122 Florence Flyby in 2017 . . . 128 4-24 Timing System Checkout for MIT LL Sensors and the MIT Wallace Observatory . . 130 4-25 Residuals of 3122 Florence Against JPL Ephemeris Dated Oct 21, 2017 . . . 131 4-26 Residuals of 3122 Florence Against Ephemeris Fit to Recent Data Only . . . 132 4-27 Predictions and Observations of DCR for 3122 Florence with Narrow Passbands . . . 133 4-28 Reŕectance Spectra of 3122 Florence and DCR in Sloan Passbands . . . 134 4-29 Vertical Residuals of Firepond Bare Silicon Observations of 3122 Florence
and Predicted DCR Bias . . . 134 4-30 Spectroscopic Resolution Requirement Simulations for Satellites . . . 135 4-31 Spectroscopic Resolution Requirement for Compensation of DCR Bias in
Ground-Based Observations of Solar System Bodies with Bare-Silicon Detectors . . . 137 4-32 Resolution Required for Asteroid Spectra with Absorption Bands . . . 138 4-33 Accuracy Requirement for Spectroscopic Compensation of DCR Bias in
Ground-Based Observations with a Bare-Silicon Detector . . . 144 5-1 Simulated Observing Network . . . 148 5-2 Distribution Statistics of Simulated Post-Fit Residuals of Orbit
Class-Representative Asteroids for Single-Apparition Fit . . . 152 5-3 Distribution Statistics from a Single Station of Simulated Post-Fit Residuals . . . 153 5-4 Single Apparition Fit Mean Motion Bias and Postőt Residuals for Asteroid
Orbits with DCR Bias . . . 154 5-5 Trade-off in Accuracy and Precision of Mean Motion Estimate in a
Single-Apparition Fit . . . 155 5-6 Trade-off in Accuracy of Mean Motion Estimate by Discarding Elevation Data . . . . 156
5-7 DCR-Induced Bias in In-Track Component of Recovery/Precovery
Resid-ual from a Single-Apparition Optics-Only Fit vs. SNR of Bias . . . 157 5-8 Orbits with Statistically Signiőcant Mean Motion Bias vs. Inclination,
Semi-Major Axis, and Observation Lower Elevation Limit . . . 158 5-9 Orbits with Statistically Signiőcant Mean Motion Bias vs. Semi-Major
Axis, Offset Between Ascending Node and Opposition, Season of
Opposi-tion, and Observation Lower Elevation Limit . . . 159 5-10 Spurious Yarkovsky Signal in Two-Apparition Optics-Only Fit . . . 160 5-11 Yarkovsky Effect Magnitudes of Asteroids in the JPL Database vs. Data Arc . . . . 161 5-12 Maximum Plausible Yarkovsky Acceleration vs. Brightness and Physical Size . . . . 163 5-13 Evolution of Best-Fit Yarkovsky Accelerations and Their 1σ Uncertainties
with Increased Lower Elevation Limit for the Example Cases in Table 5.3 . . . 166 5-14 Mean and Standard Deviation of Mean Post-Fit Residual of Three-Apparition
Optics-Only Asteroids in Table 5.3 vs. Lower Elevation Limit on Input Ob-servations and Inclusion or Exclusion of Yarkovsky Acceleration, in Inertial
and Station-Local Coordinates . . . 167 5-15 Distribution in Time and Elevation of Observations Selected for Maximal
Spurious Yarkovsky Detection Relative to Distribution of All Possible Observations . 168 5-16 Monte Carlo Simulations of Optics-Only Predictions of 2036 B-Plane of
Apophis-Like Impactor Derived from 13 Year Data Arc Prior to 2029 . . . 171 5-17 Observation Volume and Impact Estimate Probability vs. Elevation Limit
for Hypothetical Apophis-Like Impactor . . . 172 5-18 Asteroid Impact Point Uncertainty Calculation . . . 176 5-19 Simulated Drift of Apparent Impact Point with True Impact of
Apophis-Like Asteroid at Mumbai, India . . . 177 5-20 Evolution of Impact Bias and Uncertainty with Time for 30 Day Running
Window of Impact Point Estimates for a Hypothetical Newly-Discovered Asteroid . . 179 5-21 Evolution of Impact Bias and Uncertainty with Time for Florence-Like Impactor . . 180 5-22 Time-Evolution of Bias of Cross-Track Prediction and Formal its 3σ Bounds
for Zero-Inclination KBO . . . 183 5-23 Time-Evolution of Bias of Cross-Track Prediction and Formal its 3σ Bounds
5-24 Probability of Shadow Path Interception by ±3σ Wide Line of Telescopes
vs. KBO Orbital Parameters and Observation Lower Elevation Limit . . . 186
5-25 Observation Volume and Occultation Measurement Success Probability vs. Elevation Limit for Selected i = 30∘ KBO Orbits . . . 187
5-26 Time-Evolution of ±3σ Along-Track and Cross-Track Bounds of GEO Or-bit Predictions from Four-Hour Arc vs. Observing Duty Factor and OrOr-bit Geometry . . . 190
5-27 GEO Next-Night Cross-Track Prediction Error for 2 Minutes Per Hour Observation Duty Cycle Over Four-Hour Arc . . . 192
5-28 GEO Next-Night Cross-Track Prediction Error for 32 Minutes Per Hour Observation Duty Cycle Over Four-Hour Arc . . . 193
5-29 Bias and ±3σ Formal Uncertainty in AMR With 8 Hz, 250 mas RMS Astrometry . . 194
5-30 Geometric Intuition for Bias in Geostationary Satellite Solar Radiation Pressure Coefficient Estimate . . . 195
5-31 Ballistic Targets Time and Cross-Track Errors for One-Night Orbit Fit . . . 198
6-1 Dispersive Optical Elements . . . 202
6-2 Slit Spectrograph . . . 204
6-3 Slitless Spectrograph . . . 205
6-4 Transmission Grating Geometry . . . 206
6-5 Schematic of NOFS Spectrograph Data Product . . . 209
6-6 Grating Efficiency for NOFS Slitless Spectrograph . . . 210
6-7 Reconstruction of NOFS Spectra from Basis Functions for Two Satellites . . . 211
6-8 NOFS Spectroscopy of Selected Geosynchronous Satellites . . . 212
6-9 Mean ±3σ Astrometric Residuals of Two GLONASS Satellites vs. Eleva-tion Angle . . . 214
6-10 Multiband Photometry and DCR Estimation of Two GLONASS Satellites . . . 215
6-11 Equipment Available at the Firepond Facility . . . 216
6-12 SNR Along Spectrum for 12.5 mag 80% Solar Panel Target . . . 218
6-13 Comparision of SNR Along Spectrum for 12.5 mag 20% and 80% Solar Panel Target . . . 220
6-15 Fraction of Spectrum Contaminated by Star Clutter . . . 222
6-16 Bench Test Setup Overview . . . 224
6-17 Photographs of First Attempted Spot Projector . . . 225
6-18 Free-Space OAP Spot Projector Imaged Through 16-inch Telescope . . . 226
6-19 Samyang 500 mm Mirror Lens Spot Projector . . . 227
6-20 Chromatic Aberration in Samyang Mirror Lens . . . 227
6-21 Spot Projector Made with Orion Telescope . . . 228
6-22 Repeatability of m = 0 Centroid Location Under Cycling of Filter Wheel . . . 229
6-23 Radiometric Calibration Source Set Up at Firepond . . . 230
6-24 Setup for Measurement of Spot Projector Spectrum . . . 231
6-25 Aperture Mask for Measuring Calibration Lamp . . . 231
6-26 Setup for Piecewise Measurement of Spot Projector Spectrum . . . 233
6-27 Blocking Filter Bench Calibration . . . 234
6-28 Ratio of Responses of 606 and 906 Grating vs. Prediction . . . 235
6-29 Optical Path Difference Calculation for Titled Grating . . . 236
6-30 Inŕuence of Grating Tilt on Ratio of Grating Efficiencies . . . 237
6-31 Estimation of Grating Tilt Using Response Ratio . . . 237
6-32 Installation of the Spectrograph at Firepond, August 16, 2018 . . . 238
6-33 Post-Fit Pointing Residuals of Mount Bias Models Computed for the 48ž Telescope and 16ž Spectrograph Telescope from Data Collected on the Night of Nov 7-8, 2018 . . . 241
6-34 Time-History of Difference Between 16ž Telescope Pointing Measured from Bare-CCD Astrometry Frames and Pointing Computed from Mount Bias Model . . . 243
6-35 MODTRAN Atmospheric Spectral Transmittances and Sample Stellar Spec-tra for a Warm Wet Night and a Cold Dry Night . . . 244
6-36 Stability of Wavelength Scale Over Operational Nights with Star Measurements . . . 245
6-37 Achieved Optical Quality and Spectral Resolution . . . 246
6-38 On-Sky Measurements of Grating Tilt . . . 247
6-39 On-Sky Measurements of Blocking Filter Transmittance . . . 248
6-40 Absolute Photometry Mismatch . . . 250
6-41 Spectral Type Mismatch . . . 250
6-43 Grating Images of HD198001 Observed at 21∘ Elevation During Checkouts . . . 252
6-44 Grating Efficiency of Spectral Orders Suitable for Horizon Reference . . . 253
6-45 Magnitude of Observed DCR Error Compared to Absolute DCR . . . 256
6-46 Example of DCR Veriőcation Data . . . 257
6-47 Measured Deviation from Refraction Model vs. Elevation . . . 258
6-48 Satellite Illumination Conditions . . . 259
6-49 Elevation vs. Phase Angle of Satellites Observed with Spectrograph . . . 260
6-50 Measured Brightness of Satellites Observed During Spectroscopy Measurements . . . 261
6-51 Measured Sky Brightness at Firepond During Spectroscopy Measurements . . . 262
6-52 SNR vs. Predicted DCR Estimation Accuracy for Spectroscopy Measure-ments at Firepond for 40 nm Spectral Resolution . . . 264
6-53 Data Volume vs. Desired DCR Estimation Accuracy . . . 265
6-54 Predicted vs. Observed Vertical Astrometric Residual of Satellites with Measured Spectra . . . 267
6-55 Distributions of Residuals Under Different Processing . . . 268
6-56 Observed DCR vs. Predicted Separated by Elevation Range . . . 271
6-57 Observed DCR vs. Elevation . . . 272
6-58 Distributions of Observations Corrected with Spectroscopic Measurements and with Solar Panel/Kapton Mixture Model . . . 272
6-59 Measured Brightness of SCC 32660 Exiting Eclipse . . . 273
6-60 Reconstructed Spectra of SCC 32660 Exiting Eclipse . . . 273
6-61 Estimate of Atmospheric Transmission into Partial Eclipse Region . . . 275
List of Tables
3.1 Approximate Lines of Code in OrbitTool by Functional Area . . . 71 3.2 Geocentric Force Model Accuracy . . . 86 3.3 Geocentric Empirical Force Magnitudes . . . 87 4.1 Farnocchia-Correctable CCD Observations of Asteroids with Known
Spec-tral Types and Well-Constrained Orbits in the MPC Database as of
Decem-ber 2018 . . . 118 4.2 Top Five Sites Observing Long-Arc Optics-Only S- and C-Type Objects
with Selected Passbands . . . 118 4.3 Calculated Resolution Requirements to Correct Observations of Asteroids
to 25 mas . . . 139 5.1 Asteroid Family Parameters Used in Simulation . . . 149 5.2 Simulated Orbits with Large DCR-Induced Mean Motion Biases . . . 150 5.3 Simulated Orbits with DCR-Induced Spurious Yarkovsky Detections . . . 165 5.4 Simulated Hazardous Asteroid Orbital Parameters . . . 172 5.5 2036 B-Plane Miss Distance Estimate vs. Fidelity of DCR Correction and
Observation Quality . . . 174 5.6 Simulated Mumbai Impactor Orbital Parameters . . . 174 5.7 Best-Fit Multi-Night Area-to-Mass Ratio . . . 197 5.8 One-Night AMR for Ballistic Targets . . . 198 6.1 Geostationary Satellites Observed by NOFS Spectrograph . . . 209 6.2 Summary of Spectrograph Operational Nights . . . 240 6.3 Distribution Statistics of Residuals Under Different Processing . . . 269
List of Abbreviations
AMR . . . Area-to-mass ratioBCRF . . . Barycentric Celestial Reference Frame CCD . . . Charge-coupled device
COTS . . . Commercial off-the-shelf DCR . . . Differential color refraction Dec . . . Declination
EOPs . . . Earth orientation parameters
ETS . . . MIT LL Experimental Test Site, Socorro, NM FWHM . . . Full-width half-max
GCRF . . . Geocentric Celestial Reference Frame GEO . . . Geosynchronous/geostationary orbit
GEODSS . . . Ground Based Electro-Optical Deep Space Surveillance GLONASS . . . Russian GLObal NAvigational Satellite Sytem
GNSS . . . Global navigational satellite sytem, used generically GPS . . . United States Global Positioning System
GSL . . . GNU Scientiőc Library HAMR . . . High area-to-mass ratio
ICRF . . . International Celestial Reference Frame
IERS . . . International Earth Rotation and Reference Systems Service IGS . . . International GNSS Service
ILRS . . . International Laser Ranging Service ITRF . . . International Terrestrial Reference Frame KBO . . . Kuiper Belt Object
LINEAR . . . Lincoln Near Earth Asteroid Research
MEO . . . Medium Earth orbit, i.e. GPS/GLONASS altitude MIT LL . . . MIT Lincoln Laboratory
MJD . . . Modiőed Julian Date
MPC . . . International Astronomical Union Minor Planet Center NOFS . . . United States Naval Observatory Flagstaff Station OAP . . . Off-axis paraboloid
OTA . . . Optical tube assembly
PHA . . . Potentially hazardous asteroid PSF . . . Point spread function
PSM . . . Parameter sensitivity matrix QE . . . Quantum efficiency
RA . . . Right ascension
RAAN . . . Right ascension of the ascending node RMS . . . Root mean-square
RSO . . . Resident space object SCC . . . Space Command Catalog SLR . . . Satellite laser ranging
SMASS . . . Small Main-Belt Asteroid Spectroscopic Survey SNR . . . Signal-to-noise ratio
SRP . . . Solar radiation pressure SSA . . . Space situational awareness SST . . . Space Surveillance Telescope STM . . . State transition matrix TAI . . . International Atomic Time TCS . . . Telescope Control System TDB . . . Barycentric Dynamical Time UCAC . . . USNO CCD Astrograph Catalog
URAT . . . USNO Robotic Astrometric Telescope Catalog USNO . . . United States Naval Observatory
Notation
q . . . Perihelion Q . . . Aphelion a . . . Semi-major axis e . . . Eccentricity i . . . Inclination Ω . . . RAAN ν . . . True anomaly ω . . . Argument of perihelion m0 . . . Mean anomaly at epochn, ∆n . . . Keplerian mean motion, bias in mean motion A2 . . . Normalized Yarkovsky acceleration
RE . . . Earth radius
ωE . . . Earth angular velocity
π . . . Stellar parallax, as well as 3.1415... A . . . Least-squares design matrix
W12 . . . Least-squares weighting matrix
Σ . . . Formal covariance matrix R . . . Cartesian rotation matrix
P(t) . . . Non-Cartesian parameter sensitivity matrix Φ(t) . . . Cartesian state transition matrix
x . . . Cartesian state
y, θ . . . Observation vector, usually angles
z, ∆z, δz, y . . . Angle from or along local vertical or vertical focal plane offset Φ, φ, ψ . . . Detectable photoelectron ŕux, ŕux density, or signal
λ . . . Wavelength
Chapter 1
Introduction
Earth’s atmosphere is an optically dispersive medium. This subjects observations of Solar System bodies and Earth satellites made with ground-based telescopes to systematic bias from differential color refraction (DCR). DCR bias is on the order of 100 mas and affects both the targets and the őducial stars used to form the astrometric solution in telescope images. The majority of data for space situational awareness (SSA) of satellites and orbital debris in geosynchronous (GEO) orbit comes from observations made with optical telescopes, as do nearly all observations of asteroids and all observations of Kuiper Belt Objects (KBOs).
Until recently, the systematic bias from DCR had been overshadowed by the őxed-pattern error in the star catalogs used to form astrometric solutions. Over the past several years, the results of the European Space Agency’s Gaia satellite mission have resulted in a dramatic improvement in the accuracy of star catalogs. In January 2017, the Gaia DR1-registered UCAC5 star catalog was released with a 25 mas RMS all-sky accuracy and in April 2018, the Gaia DR2 catalog was released with sub-milliarcsecond accuracy. This reduction in catalog error has exposed underlying DCR bias as a dominant contributor to the error ŕoor in ground-based optical astrometry.
1.1
Phenomenology
DCR is shown schematically in Figure 1-1. Short wavelengths refract more than long wavelengths and appear from the ground to be incident from a higher elevation. Target signals composed mostly of short wavelengths appear higher up than target signals composed mostly of longer wavelengths. The bias affects both őducial stars and astrometry targets. The effect on the astrometric solution for a target is inverted for the DCR of őducial stars: targets registered against bluer stars appears
Ground Telescope Asteroid Target Satellite Target
Solar Illumination Fiducial Star
Atmosphere blue red (a) Cross-section toward zenith solar analog redder, flat too low reflector
hotter/bluer
colder/redder
true star level
true target level star too low t a r g e t t o o h i g h t a r g e t t o o l o w star too high target too high (b) Image space
Figure 1-1: Schematic of DCR Bias
to originate from a lower elevation because the őducial sources appear to be at a higher elevation and targets registered against redder stars (most stars are redder than Sun-like) appear to originate from a higher elevation because the stars deőning the plate coordinate system appear systematically lower.
Proceeding mostly from Filippenko [1], the computation of the DCR bias for a target is as follows. At a zenith distance z, let the target detectable photoelectron spectral ŕux density be φ(λ, z) and let the total refraction as a function of wavelength at that zenith distance be y = ∆z(λ, z). The symbol y is the vertical angular coordinate on the focal plane corresponding to wavelength λ. DCR transforms the spectral ŕux density into an angular ŕux density on the telescope’s focal plane. This density is given by
ψ(y) = φ(∆z−1(y, z), z)(︂ dy
dλ )︂−1
(1.1) The Jacobian term (︁dy
dλ
)︁−1
approaches inőnity in the red portion of the silicon band where the refraction versus wavelength curve is relatively ŕat, and for numerical reasons it is preferable to compute the the vertical centroid δz0 of the angular distribution in wavelength coordinates via:
δz0 = ∫︀ ψ(y)ydy ∫︀ ψ(y)dy = ∫︀ φ(λ, z)∆z(λ, z)dλ ∫︀ φ(λ, z)dλ (1.2)
This is the DCR bias with respect to some zero point of ∆z(·) at zenith distance z. For convenience, that zero point is taken to be the vertical centroid of a solar-analog star.
The relevant quantity is the spectral ŕux of detectable photoelectrons. For a solar-illuminated target, that spectrum is the product of the solar illumination spectrum with the target spectral
reŕectance, atmospheric spectral losses and overall instrument spectral quantum efficiency. For a relative astrometric measurement against a őducial star, the atmosphere and detector are common between the spectra of the target and star. That common path renders the DCR bias only weakly sensitive to atmospheric conditions (though it is somewhat sensitive to meteorological visibility). The greatest sensitivity is to the difference between the exoatmospheric spectrum of őducial stars and the exoatmospheric spectrum of the target. DCR bias is only weakly sensitive to the absolute amount of refraction at a given zenith distance and to the method used to compute refraction. Both a simple R ∝ sec z approximation of refraction and the more involved Auer-Standish [2] algorithm yield nearly indistinguishable values for DCR bias. What is important for accurate modeling of the DCR of one source with respect to another is not the calculation of the total bending but the ődelity of the model for the wavelength-dependence of the refractive index of air and the target’s detected photoelectron spectrum.
1.2
Evidence of DCR Bias and Its Significance
Though cognizance of DCR bias is not new, evidence that it is a signiőcant contributor to the error ŕoor in achievable astrometric accuracy had been limited until the start of the 2010s. Chapter 2 will go into the details of the error sources contributing to ground-based astrometry, focusing mostly on the astronomical community. This section will relate some history from the near-Earth SSA side of the story to explain why.
1.2.1 Astrometric Observations of Calibration Satellites in Earth Orbit
In the 1990s, MIT Lincoln Laboratory (MIT LL) had completed for the United States Air Force the design for the upgrade of the Ground Based Electro-Optical Deep Space Surveillance (GEODSS) telescopes from tube cameras to large format charge-coupled devices (CCDs). These devices had 1960 × 2560 2.2 arcsec square pixels. A primary purpose of the upgrade was to improve detec-tion sensitivity over the tube cameras. The deployment of the large-format CCDs enabled the use of in-frame astrometry for SSA data reductions in place of mechanical measurements of telescope pointing. The software change from relying on mechanical angle measurements to in-frame astro-metric solutions occurred in the late 1990s and improved the absolute accuracy of the GEODSS systems from a performance of 20–40 arcsec RMS down to about 4–5 arcsec RMS. A further upgrade in 2003 pushed that down to 2 arcsec RMS (Figure 1-2).
1 10 100 1/16 /98 3/27 /98 6/5/ 98 8/14 /98 10/2 3/98 1/1/ 99 3/12 /99 5/21 /99 7/30 /99 10/8 /99 12/1 7/99 2/25 /00 5/5/ 00 7/14 /00 9/22 /00 R M S A c c u r a c y [ a r c s e c ]
switch from mount metrics to in-frame astrometry
Diego Garcia Maui, HI Socorro, NM
Figure 1-2: Accuracy Assessment of GEODSS Observations in the Late 1990s. Data from [3]. The US Air
Force GEODSS system began operation in the 1970s with vidicon detectors capable of only single point source measurements and relied on electromechanical measurements of physical gimbal angles to generate observations. CCD detectors enabled in-frame astrometric reductions on satellite targets moving rapidly against the star background, improving accuracy to the 5 arcsecond level [3]. Further refinements to the software lowered errors down to 2 arcsec RMS in the early 2000s [4].
In 2009, several related efforts were underway at MIT Lincoln Laboratory. The MIT LL Experi-mental Test Site, Socorro, NM (ETS) in Socorro, New Mexico had been operating the Lincoln Near Earth Asteroid Research (LINEAR) systems [5] for over a decade and was preparing for the deliv-ery of the Space Surveillance Telescope (SST) [6]. That effort involved adapting and extending the astrometric software that had been developed for the LINEAR program, the GEODSS astrometric processing upgrade [3, 4], and the Morón Optical System [7] for the SST.
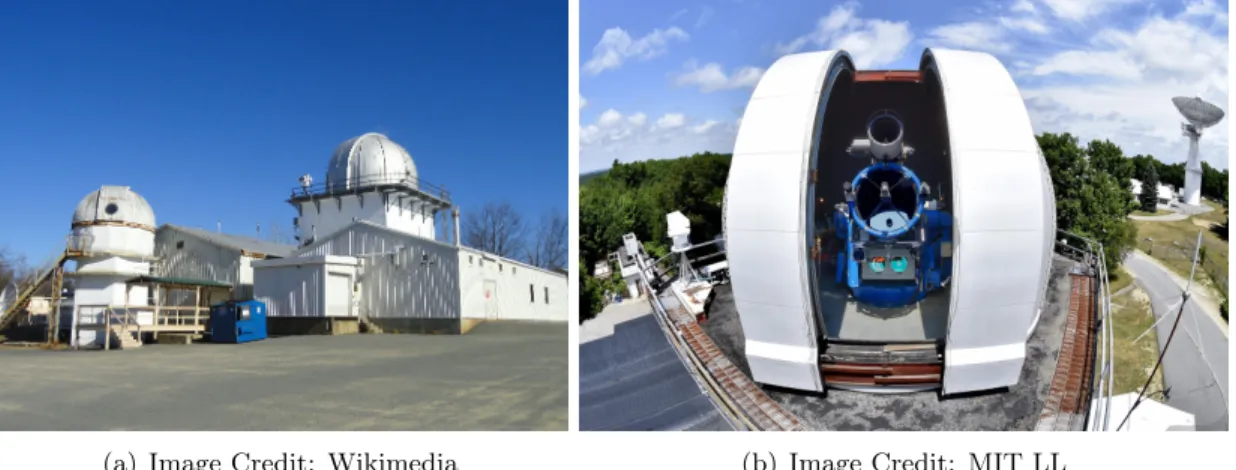
At the same time, the MIT Lincoln Laboratory was reactivating the Firepond Optical Facility in Westford, Massachusetts to serve as an additional testbed for ground-based SSA techniques [8]. I was on the engineering team tasked with the recommissioning (Figure 1-3) and part of my job was was to port that ETS astrometric reduction software for use at Firepond. At that time, the state-of-the-art for LINEAR and for MIT LL ground-based SSA was to use the USNO-B star catalog [9]. The USNO-B catalog had a systematic error ŕoor on the order of a few tenths of an arcsecond, but in the context of the GEODSS upgrade which saw accuracy go from many tens to single-digit arcseconds, this was an improvement over past performance for ground-based SSA.
The Firepond recommissioning achieved initial operating capability in early July 2009. Through-out July and August 2009, several nights were spent validating the performance of the
newly-Figure 1-3: Firepond Recommissioning Team, June 12, 2009. Image Credit: Steve Hunt, MIT LL. Counter-clockwise from right: Jan Kansky, Lawrence Swezey, Roman Geykhman, Wayne Robertson.
reactivated system. As part of the checkout procedures, several full nights were spent observing GPS satellites for the purpose of a metric accuracy assessment. This was meant to verify the proper operation of the entire system: adequate optical quality, focus, and collimation; mechanical stability during satellite tracking; image timing system integrity; and correct astrometric processing software conőguration.
The data collections consisted of several thousand distinct observations of GPS satellites ob-served with 120 msec exposures. The assessed accuracy, computed as the running mean astrometric residual averaged over őve-second periods, was between 0.1 and 0.2 arcsec, while the seeing-induced short-timescale astrometric noise was on the order of 0.3 arcsec. This was consistent with the claimed accuracy of the USNO-B catalog, and there did not appear to be any preferential direction-ality to the error statistics. In some parts of the sky, the error was aligned with the local horizontal, in other parts it was aligned with the local vertical, or with the RA/Dec axes.
The Firepond system continued to operate as a developmental testbed, and by 2012 the camera control and timing capture software had reached its intended conőguration. Checkout observations of GPS and GLONASS satellites continued to be made as part of normal operations in order to validate system performance.
In 2013, the UCAC3 star catalog [10] became available. Metric accuracy assessments computed against observations reduced with this new catalog exposed underlying systematic error sources that had been masked by the őxed-pattern astrometric biases present in the USNO-B catalog.
-600 -400 -200 0 200 400 600 0 10 20 30 40 50 60 70 80 90 H o r i z o n t a l R e s i d u a l [ m a s ] Elevation [deg] GLONASS GPS
(a) Horizontal Residuals
-600 -400 -200 0 200 400 600 0 10 20 30 40 50 60 70 80 90 V e r t i c a l R e s i d u a l [ m a s ] Elevation [deg] GLONASS Parallax Removed
GPS Parallax Removed GPS Raw
(b) Vertical Residuals
Figure 1-4: Residuals of Observations of GPS and GLONASS Satellites Reduced with URAT1. Mean
and ±3σ of mean residuals vs. elevation, N=130,000 observations of GPS satellites and 35,000 observations of GLONASS satellites. Star DCR correction not applied. GPS satellites’ vertical residuals are plotted with parallactic refraction (Section 3.3.4.2) both removed and left in to demonstrate the relative magnitude of parallax and DCR at GPS distances.
The most apparent revelation from the new analysis was that if astrometric residuals statistics were tabulated in station-aligned horizontal/vertical coordinates rather than sky-aligned RA/Dec coordinates, then the nonzero component of the mean astrometric error of all observed calibration satellites was conőned entirely to the local vertical coordinate, while the mean horizontal error was near zero, suggesting strongly that all of the systematic errors in SSA astrometry were coming from atmosphere-induced biases.
By the end of 2016, approximately 165,000 distinct astrometric observations of GLONASS and GPS satellites had been made as part of routine system checkout observations. At the time, the 2015-released URAT1 star catalog [11] was the most accurate available, and it was possible to analyze the error statistics from the metric accuracy assessments of data reduced with these newer catalogs in bulk. Figure 1-4 shows the mean astrometric residuals for all observed satellites as a function of elevation angle. On average, the mean horizontal residual is near zero in all elevation bins. The outlier peak at 45 degrees is consistent with a catalog bias of no more than the 30 mas claim of the URAT1 catalog. While other outliers in the horizontal coordinate do exist at high elevation that cannot be attributed to small-number statistics, the presence of consistent near zero-mean errors for much of the span of elevation indicates good overall astrometric data quality.
Conődence in the astrometric reductions allows the claim to be made that the behavior of the vertical residual in the same region is strongly indicative of unambiguous DCR bias. The variability in the GPS satellites’ vertical residual curve with elevation is indicative of stabilized spacecraft
with Sun-tracking solar panels whose apparent aspect to the observing site varies with elevation angle. GPS is in a repeating twice-a-day orbit and one would expect fairly strong coupling between phase and elevation angles from a single ground site. The separation in traces between the vertical residuals of the GPS and GLONASS satellites is indicative of spacecraft in different orbits presenting different aspect angles and possibly of the difference in surface materials of two different spacecraft constellations.
1.2.2 Astrometric Observations of Asteroids with Known Spectral Types
The analysis in Section 1.2.1 presents strong evidence that atmosphere-induced bias is dominant in ground-based optical observations of calibration targets. The persistence of the bias after removal of parallactic refraction suggests strongly that DCR is the cause of the remaining detectable astrometric error. To strengthen that claim, it is necessary to compare the astrometric residuals of objects with a known color difference. The Minor Planet Center (MPC) archive of astrometric observations of asteroids offers can support this type of analysis. Of the several hundred thousand distinct asteroids in the MPC database, several thousand are spectroscopically-characterized and fall into either the C-type of ŕat gray reŕectors or the S-type of slightly red objects [12].
Figure 1-5 shows the horizontal and vertical residuals for the two asteroid classes from all contributing stations and separately from the original LINEAR program. The őrst thing to notice is that there is, indeed, a separation between the redder S-type asteroids and the C-type asteroids in the vertical coordinate that does not appear to exist to the same level of statistical signiőcance in the horizontal coordinate. However, the common-mode structure in both the vertical and horizontal residuals makes it difficult to attribute łallž of the systematic error to atmospheric biases.
A large fraction of the Minor Planet Center archive consists of observations made by the LINEAR program. Considering only observations from that sensor, one sees that there is similar structure in both horizontal and vertical residuals. This is where the star catalog biases and DCR are difficult to dissociate from other effects. The bump in the vertical residual at an elevation of about 40 degrees corresponds to a declination of about −20 degrees. The LINEAR system came online in the mid 1990s and used the USNO-A astrometric catalog available at that time. This catalogs is made from scans of photographic plates from surveys conducted in two halves, one for the Northern Hemisphere collected at Palomar, and one for the Southern Hemisphere collected in Chile [13]. The seam between the two halves occurred around that declination band, and the error in joining the two datasets propagated into the LINEAR data and dominated the statistics of the systematic error
-300 -200 -100 0 100 200 300 V e r t i c a l R e s i d u a l [ m a s ] S-type C-type -300 -200 -100 0 100 200 300 0 20 40 60 80 H o r i z o n t a l R e s i d u a l [ m a s ] Elevation [deg] (a) All ground telescopes
0 20 40 60 80 Elevation [deg] (b) LINEAR, no debiasing 0 20 40 60 80 Elevation [deg] (c) LINEAR, debiased
Figure 1-5: Residuals of Archived Observations of S-type and C-type Numbered Asteroids Resolved into
Station-Local Horizontal/Vertical Coordinates. Mean ±3σ of the mean residual versus ele-vation with respect to JPL best estimate ephemerides retrieved Nov 2017 [15]. Obserele-vations retrieved from IAU Minor Planet Center [16] Jan 2017. Aggregate data from all stations spans calendar year 2000 to 2016. The LINEAR system observations span the calendar years 2000 – 2012 when the original LINEAR program was shut down and replaced by the Space Surveil-lance Telescope. The total number of LINEAR observations consists of approximately 50,000 observations of C-type asteroids and 120,000 observations of S-type asteroids.
for the entire Minor Planet Center archive.
With the publication of the Farnocchia catalog corrections [14] to the USNO catalog, it became possible to remove this error from the LINEAR data and from other early observations. When catalog error is removed, the structure in the horizontal coordinate of the residuals disappears. Also, spurious separation in the mean horizontal residuals for the two classes of asteroids disappears, and the common mode error in the vertical coordinate is greatly attenuated, while the separation in the vertical residuals remains. That remaining separation of traces is the key to the argument that DCR is signiőcant because demonstrates that when all else is held equal: same sensor, same average atmosphere, and same elevation angle, but the color of the target varies, a measurable astrometric bias occurs in the vertical coordinate. The analysis of asteroid residuals is revisited again in Section 4.3.
1.3
Motivation
Astrometry has historically been plagued by low data availability, which in turn has limited the motivation and capacity to improve reduction techniques and investigate the limits of observation accuracy in SSA. The availability of inexpensive image detector technology, in combination with improvements in star catalog accuracy, has removed this limitation, leaving fertile ground for inves-tigation. Quoting (with emphasis added) from the National Academy’s report Continuing Kepler’s
Quest [17], published in 2012,
The committee believes that the primary limitation in the current system for objects not experiencing signiőcant drag is not the accuracy of the algorithms, but rather the
quantity and the quality of the sensor tracking data. The key system limitations are
current sensor coverage, understanding of the quality of the observations, and the chal-lenge of fusing disparate data from different systems and phenomenology. Understanding
the quality or statistics of the observations is necessary for obtaining a realistic covari-ance, which is needed for computing an accurate probability of collision. For near-Earth
orbiting satellites another limitation is understanding and modeling of the atmosphere.
1.3.1 Improvements in Star Catalog Accuracy
The largest motivating factor for improvements in measurement techniques and data processing for ground-based SSA is the fact that star catalog accuracy has improved by several orders of magnitude over the past several decades. Where once systematic catalog errors were measured in fractions of an arcsecond, they are now measured in fractions of a milliarcsecond. The removal of this once-dominant error source in the astrometric measurement exposes other underlying physical effects.
DCR bias coexists with other sources of systematic error in CCD astrometry. These error sources are generally zero-mean and are a product of mechanical perturbations to the observing instrument that spoil the optical quality in a long-exposure image relative to an ideal in the absence of disturbances. Recent work with high frame-rate detectors and image stacking techniques [18, 19] has made it possible to push past these effects and realize the full beneőt of modern star catalogs. DCR bias is a real physical effect rather than a deviation from a theoretical ideal in the way mechanical perturbations are, and this thesis shows that DCR bias is the remaining dominant error source once catalog bias and instrument non-idealities are surmounted.
1.3.2 Asteroid Search
Nearly all Solar System bodies are observed exclusively with optical telescopes and the majority of those telescopes are ground-based. Accurate observations of asteroids are necessary for both plan-etary defense purposes and in order to enable accurate characterization of non-hazardous asteroids for scientiőc purposes. Because the majority of these sensors operate with bare silicon detectors to optimize detection probability for small or distant objects, DCR is the dominant long-timescale error source in these observations after star catalog error is mitigated.
Accurate predictions of Earth impacts and Earth impact points are crucial for long-term plan-ning. Low-accuracy and low-volume data can make accurate forecasting difficult. The evolution of the trajectory predictions for 99942 Apophis and the case of 2014 AA provides an illustrative example. After the discovery of 99942 Apophis with only observations in 2004, an optics-only orbit estimate yielded a potential impact in 2036, but a wide range of potential impact points wrapped around almost half the Earth [20]. Alternatively, 2014 AA was discovered less than a day before impact and the predicted uncertainty in the impact points was also large, though the actual impact point was right in the center of the predicted distribution [21]. While the case of 2014 AA and the early estimates of the Apophis impact may be pinned on shortness of the arc (relative to the prediction time span), a driving source of statistical uncertainty in both of these cases is optics error model. This thesis argues that DCR bias is a major contributor to the optics error budget and thus a driving source of error in long-term asteroid impact monitoring accuracy.
1.3.2.1 Hazardous Asteroid Impact Monitoring
Because almost all observations of asteroids are made with ground-based optics, systematic errors in those observations and unmodeled effects in the ground optics observation model will dominate the error in orbit predictions. Because of the low data volumes involved and because of the near-lack of independent measurements by ground-based radars, these can be łsilentž errors that are not detectable in the statistics of the post-őt residuals of the observations used to construct the orbit estimate. When an asteroid does occasionally pass into radar range, it is possible to be surprised by a prediction from an optics-only orbit estimate that differs signiőcantly from a direct range measurement. For example, during the 2004 pass of the asteroid 3908 Nyx, the target was off-nominal by over 100 km due to a combination of unmodeled astrometric errors and unmodeled non-gravitational accelerations from the Yarkovsky effect [22].
θN θ0 xinertial yinertial Earth orbit Asteroid orbit
(a) Scenario Geometry
ground velocity ~0.4 km/sec inertial closing velocity <10km/sec inertial impact point bias yinertial xinertial Westward impact point bias
↕
Eastward ground rotation(b) Arrival Time and Impact Point Bias
Figure 1-6: Orbit Geometry for Two-Dimensional Analysis of Significance of DCR on Asteroid Impact
Predictions. An asteroid with aphelion at exactly 1 AU is chosen to minimize the effect of the curvature of the Earth’s orbit, thereby making arrival time difference primarily an East-West bias in the impact point.
Due to other systematic error sources in ground-based optical astrometry, it is not appropriate to ascribe all mismatches between prediction and observation to DCR bias in the input observations. It is, however, illustrative to analyze the degree to which DCR bias can contribute to asteroid orbit prediction errors, and whether any such contribution can be signiőcant.
Experience with both near-Earth SSA and asteroid search quickly imparts the lesson that the orbital element with the highest uncertainty and the greatest sensitivity to observation error is Keplerian mean motion. In the case of an asteroid that is known to impact the Earth, a bias in mean motion, will, at the very least, bias the arrival time, and allow the Earth to rotate under the nominal impact point, thereby introducing an East/West bias in the predicted impact point.
To gauge the signiőcance of this bias, consider the scenario depicted in Figure 1-6, where two-dimensional, two-body physics applies and a single station on the Earth makes a single observation of the asteroid per night. The asteroid’s orbit forces an observation from the night side of the Earth to be made at a low elevation angle, imparting the maximum DCR bias to the observation. The geometry forces the observations to always be made either near dusk or near dawn for long stretches of time, lowering the chance for observation errors to cancel.
With purely two-body physics in two dimensions, the orbital state of the asteroid is a four-dimensional quantity characterized by four invariant Keplerian elements:
which are related to the Cartesian state by a function of time:
x(t) = [x(t), y(t), ˙x(t), ˙y(t)] = f (t, k) (1.4)
The single inertial angle observation on each night is a function of the Cartesian state,
θt= tan−1(∆yinertial/∆xinertial) (1.5)
The observation Jacobians, given by:
∆θt=
∂θ ∂x
∂x
∂k(t)∆k (1.6)
may then be used to compute iterative corrections to the state estimate. Beginning with the sensitivity of observations to perturbations in the Keplerian state,
⎡ ⎢ ⎢ ⎢ ⎣ ... ∆θt ... ⎤ ⎥ ⎥ ⎥ ⎦ = ⎡ ⎢ ⎢ ⎢ ⎣ ... ∂θ ∂x∂x∂k(t) ... ⎤ ⎥ ⎥ ⎥ ⎦ ∆k (1.7)
The sensitivity of the Keplerian state to perturbations in the observations away from their error-free, noise-free values is:
∆k = ⎡ ⎢ ⎢ ⎢ ⎣ ... ∂θ ∂x∂x∂k(t) ... ⎤ ⎥ ⎥ ⎥ ⎦ +⎡ ⎢ ⎢ ⎢ ⎣ ... ∆θt ... ⎤ ⎥ ⎥ ⎥ ⎦ (1.8)
where []+ refers to the left pseudoinverse. If ∆θ = [∆θ
0, . . . , ∆θN]T is the uncorrected bias in the
observations, then to őrst order, the Cartesian error in the orbit estimate propagated out to the nominal impact time is given by:
∆x(timpact) = f (timpact, k0+ ∆k) (1.9)
Referring to Figure 1-6(b), asteroids with semi-major axes less than 1 AU and aphelion Q at exactly 1 AU dwell in front of the Earth during their aphelion. If the dominant bias is in some combination of mean motion, mean anomaly at epoch, or in the argument of perigee, this has the effect of moving the dwell location further in front of the Earth or closer to the Earth as it catches
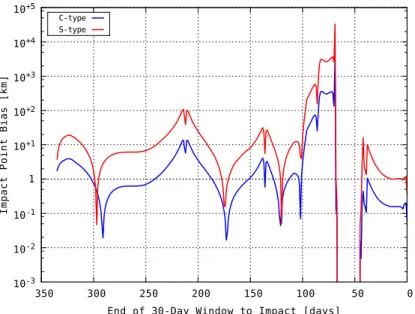
1 10-3 10-2 10-1 10+1 10+2 10+3 10+4 10+5 0 50 100 150 200 250 300 350 I m p a c t P o i n t B i a s [ k m ]
End of 30-Day Window to Impact [days] C-type
S-type
Figure 1-7: Impact Point Bias in Two-Dimensional Analysis of q = 0.9, Q = 1.0 Orbit. The gap between
50 and 70 days to go corresponds to the asteroid passing too close to the Sun for ground-based observations to be made from the night side.
up to the asteroid. Neglecting the details of gravity capture, the Cartesian state error of the asteroid translates into an impact time bias via:
∆timpact≈ ∆y/ ˙y (1.10)
which in turn becomes an East/West bias via scaling by the Earth’s equatorial surface velocity:
∆s ≈ REωE∆y/ ˙y (1.11)
Taking this all together, an (admittedly contrived) scenario can be found where DCR bias in observations imparts a signiőcant bias to the predicted impact point. Consider the case where the perihelion q = 0.9 AU and an impact point is computed after thirty nights of observations. The bias in the impact point as a function of when that thirty-day window ends is shown in Figure 1-7. The bias is smaller for a relatively ŕat-reŕecting C-type asteroid than for a red S-type asteroid. There are times where the impact point bias computed from a 30-day window of observations can exceed several hundred kilometers. Though this scenario was deliberately constructed to maximize the effect of DCR, this preliminary analysis shows the existence of pathological cases where DCR bias in observations can impart signiőcant bias to asteroid orbit estimates, and motivates a further analysis of the implications of DCR for asteroid orbits. This analysis is developed in Chapter 5.
net force solar heating radiative cooling spin
Figure 1-8: Schematic of Yarkovsky Effect. The orientation of the object’s spin axis relative to its orbital
velocity vector determines the degree to which Yarkovsky acceleration perturbs the object’s orbit and at what time scale. A spin axis directly perpendicular to the orbital plane aligns the Yarkovsky acceleration with the in-track component and maximizes the measured along-track deviation of the object from a trajectory modeled with no non-gravitational perturbations.
1.3.2.2 Yarkovsky Effect Characterization
The Yarkovsky effect is a non-gravitational acceleration caused by non-isotropic thermal re-emission by the surface of a spinning asteroid heated by sunlight (Figure 1-8). The Yarkovsky effect con-tributes an acceleration on the order of 10 to 100 ×10−15AU/day2 to asteroids where it has been
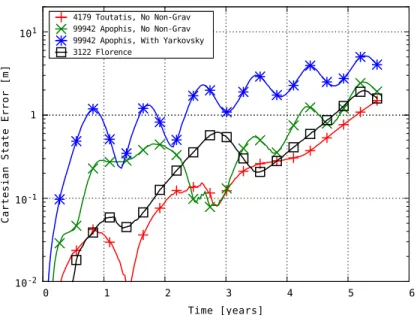
measured (though on some low-density objects it is much higher) [23], meaning that for an asteroid with an unmodeled Yarkovsky acceleration, Cartesian position error between ground truth and the orbit estimate accumulates at a rate of between 100 and 1000 meters per year.
Astrometric errors can mask this physical effect if the non-gravitational accelerations result in observable deviations from nominal angular position that are on the same order of magnitude as the astrometric error. In the case of zero-mean astrometric noise, it is possible for observation error to attenuate with the incorporation of more data and still measure the desired effect. DCR, however, is not zero-mean and has long correlation times, meaning its effect on orbit solutions does not attenuate as quickly as purely random noise. At typical observation distances on the order of 1 AU, systematic biases on the order of 50 mas correspond to about 36km of apparent cross-range displacement. This is about an order of magnitude higher than the Yarkovsky-induced displacement from an orbit solution free of non-gravitational perturbations.
orbit error
shadow path
star
Figure 1-9: Schematic of Stellar Occultation. The primary observable is the duration of the occultation. If
measured from multiple stations or against multiple stars, the physical size of the object may be measured. The ability to make this measurement is predicated on the ability to predict the ground-track of the shadow in advance. The accuracy of the prediction of the ground-track of the shadow is identical with the accuracy of the orbit prediction of the occulting object.
1.3.3 Kuiper Belt Object Occultations
The Kuiper Belt consists of objects beyond the orbit of Neptune. The őrst object discovered in this orbital regime was Pluto in 1930. With the advent of CCD detectors in the 1990s, additional KBOs were discovered beginning in the early 1990s [24], with several thousand more discovered over the past two decades [15]. Given their location at the outer edges of the Solar System, KBOs are studied primarily with stellar occultations [25]. The measurement of stellar occultations is shown schematically in Figure 1-9.
The ability to make occultation measurements is predicated on the ability to make accurate predictions of the orbits of the objects to be studied. Because nearly all KBOs are relatively recent discoveries, their orbital solutions are based on arcs that are short relative to their orbital periods. This implies that the accuracy in the estimate of the orientation of the orbital plane of these objects is relatively coarse and a systematic bias in the observations used to estimate the orbit will tilt estimate of the orientation of their orbital plane. At a typical observation range of 40 AU, a 0.1 arcsec observation bias aligned perpendicular to the orientation of the orbital plane of a KBO can introduce approximately 3000 km of bias, which will directly translate into a comparable bias in the prediction of the ground-track of the occultation, potentially leading to a missed measurement.
1.3.4 Near-Earth SSA
1.3.4.1 Satellite Debris Monitoring in Earth Orbit
Earth orbit is an increasingly crowded environment and accurate tracking of resident space objects (RSOs) is critical to maintaining safe separation between active satellites and debris fragments [26]. While the operator of an active satellite with a working transponder can determine its location and command its maneuvers with high accuracy, uncontrolled debris must be tracked non-cooperatively. In the GEO orbital regime in particular, nearly all of this tracking will occur with ground-based telescopes, meaning the systematic error ŕoor on the the orbit solution for these potential hazards to active satellites is determined by the systematic error ŕoor on the input observations.
A recent and public example illustrating the situation occurred in the summer of 2017 when ExoAnalytic Solutions detected a breakup event affecting SCC 27820 [27]. Multiple fragments separated from the satellite, each potentially a hazard to other RSOs in GEO. Most of these objects were small, meaning they cannot be tracked with ground-based radars, and logically, at least some of these would be high area-to-mass ratio (HAMR) objects.
Faint HAMR objects are readily detectable in orbits in and near the geosynchronous belt [28]. A major source of uncertainty in the orbital predictions for this class of objects is the amount of non-gravitational perturbation to their trajectory from direct solar radiation pressure (SRP) [28, 29]. Most active satellites’ AMRs are signiőcantly under 0.1 m2/kg and the effect of SRP is small, taking
many hours of observation to measure (see Section 5.5). While for objects with extremely high area-to-mass ratio (AMR), such as pieces of Kapton (AMR >> 1 m2/kg), the effect of radiation pressure
is readily noticeable above the noise in astrometric observations over a relatively short time, for objects with an intermediate AMR1, the magnitude of the observable effect of AMR is on par with
the magnitude of DCR bias.
Many HAMR objects have complex shapes and attitude dynamics, suggesting strongly that their individual spectral reŕectances could vary depending on the material composition and orientation they present to an observing telescope. Potentially, these observations can be subject to large and time-varying amounts of DCR bias. Thus, for this class of objects, DCR bias deőnes the error ŕoor in orbit prediction accuracy.
1An example of an object with an intermediate AMR is the MSG-2 cooler cover (SCC 29106), which has an AMR
![Figure 1-2: Accuracy Assessment of GEODSS Observations in the Late 1990s. Data from [3]](https://thumb-eu.123doks.com/thumbv2/123doknet/14757050.583095/32.918.196.709.116.425/figure-accuracy-assessment-geodss-observations-late-s-data.webp)