Characterization of Local Field Effect in Organic
Film Using Pressure Technique
by
Wendi Chang
B.S.,
B.A., University of Rochester (2011)
ARCNNES
MASSACHUSETTS INSYMYE
OF TECHNOLOGY
JUL 0
8
2013
A R IES
Submitted to the Department of Electrical Engineering and Computer
Science
in partial fulfillment of the requirements for the degree of
Master of Science in Electrical Engineering and Computer Science
at the
MASSACHUSETTS INSTITUTE OF TECHNOLOGY
June 2013
@
Massachusetts Institute of Technology 2013. All rights reserved.
Author
...
Department of Electrical Engineering and Computer Science
May 15, 2013
Certified by
...
S
....
Vladimir Bulovid"... ... ... .
Professor of Electrical Engineering
Thesis Supervisor
1)
Accepted by
...
7-.
L
Z - " "I
i A. Kolodziejski
.
K
...
s
Chairman, Department Committee on Graduate Theses
. .. . . . . . . .. . .. . . . . . . ... .. . . .
Characterization of Local Field Effect in Organic Film Using
Pressure Technique
by
Wendi Chang
Submitted to the Department of Electrical Engineering and Computer Science on May 15, 2013, in partial fulfillment of the
requirements for the degree of
Master of Science in Electrical Engineering and Computer Science
Abstract
This thesis proposes and demonstrates a pressure probing technique for studying the effects of local dielectric changes on the excitonic energy levels in amorphous organic thin films for optoelectronic device applications. Compression of organic films causes a decrease in intermolecular spacing and, through solvation effects, lowers the exciton transition energy. A series of steady-state photoluminescence (PL) measurements per-formed on doped organic thin films demonstrated the applicability of pressure probing in measuring solvation effects, and fitted to solvation theory. Since a pressure prob-ing technique eliminates composition differences and sample-to-sample variability, in comparison with doping methods, it may be a simpler method of observing energy shifts in solvation effects. Further investigation into spectral diffusion for films under compression indicates a change in spectral diffusion rate due to change in molecular packing density. Comparisons were made between spectral diffusion rates for films under pressure and films of different doping concentrations. Initial measurements of pressure effects on exciplex charge-transfer states in bulk heterojunction films are performed to show change in emission lifetimes. This work could provide a better understanding of the singlet-triplet exciton coupling rates and have a significant im-pact on device optimization for organic light-emitting diodes (OLEDs) and solar cell applications.
Thesis Supervisor: Vladimir Bulovid Title: Professor of Electrical Engineering
Acknowledgments
"Life is infinitely stranger than anything which the mind of man could invent."
- Sherlock Holmes, (Sir Arthur Conan Doyle, A Case of Identity)
I would like to express my sincere gratitude to my advisor Prof. Vladimir Bulovid
for his guidance, expertise, and patience as I dove head first into the strange world of organic materials. Not only was he a mentor in research, but also a role-model; I still have much to learn from his cheerful and open personality.
Vladimir provided this wonderful opportunity to work among the many brilliant
minds here in Organic Nanostructured Electronics Laboratory (ONElab). Many
thanks goes to our Team Awesome, which provided a research support group for those confusing times when experiments do not go as planned. I would like to espe-cially thank Gleb and Dan, whose contributions to our collaborative works cannot be overlooked.
I would also like to thank Prof. Marc Baldo for his invaluable insights and fresh
perspective on my projects. I eagerly anticipate working on future projects with him. On a more personal level, I am grateful to all the people of ONElab for all the dinners and gatherings, for the late night games of "Bang!", and for creating a com-fortable and fun work environment. I look forward to spending the rest of my graduate career with some of these lovable people. I would like to especially thank Farnaz for being a great friend. The many conversations and humorous stories we shared helped to keep me sane.
In addition, I would like to thank my family, who has been behind me in every decision I made. Their love and encouragements have helped me become who I am today. Last, but definitely not least, I would like to thank Patrick for all his love and support for the past 5 years. Through life's strange coincidences, we met at a fortuitous place and at an opportune time. Now, I cannot imagine my life any other way.
Contents
1 Introduction
1.1 M otivation . . . .
1.2 Local Field Effects . . . .
1.3 Description of Experimental Setup 1.3.1 Mechanical Setup . . . .
1.4 O utline . . . .
2 Solid State Solvation Effect
2.1 Solvation Theory . . . . 3 Steady-State Photoluminescence 3.1 Sample Preparation . . . . 3.2 Spectral Results . . . . 3.2.1 Sample Scan . . . . 3.2.2 Pressure Scan . . . .
3.3 Experimental Fit to Theory . . . .
4 Time-Resolved Photoluminescence
4.1 Streak Camera . . . .
4.2 Wavelength- or Time-Integrated . .
4.3 Spectral Diffusion . . . .
5 Application to Exciplex System
5.1 B ackground . . . . 15 15 16 18 19 19 21 23 29 31 32 32 33 36 39 39 40 44 49 49 . . . . . . . . . . . . . . . . . . . . . . . . . . . . . . . . . . . . . . . . . . . . . . . . . . . .
5.2 Exciplex Samples . . . .. . . . . 52 5.3 Steady-State PL . . . . 52 5.4 TRPL . . . . 56 5.4.1 Lifetime . . . . 57 6 Conclusion 61 6.1 Future work . . . . 62
List of Figures
1-1 CIE plot of OLED emission of different material systems at various
doping concentrations by percent weight. [1] . . . . 17
1-2 Schematic of experimental system with simplified illustration of optical com ponents. . . . . 18 1-3 Experimental setup for in situ optical measurement of organic thin
film sample under mechanical pressure. . . . . 20
2-1 Shift in PL for DCM molecules dissolve in select solvents. The peak emission changes due to different solvent dielectric constants . . . . . 21 2-2 Solvatochromism: (top) change in molecular spacing to change
polariz-ability, (bottom) bathochromic shift in transition energy for increasing polarizable medium for typical dye molecule, or positive solvatochromism. 23
2-3 DCM(II) emission transition energy shift as predicted by OLM theory:
(top) the theoretical prediction of the emission transition energy (on the left axis in blue) and the solvent nuclear polarizabilty (on the right axis in green) as a function of dielectric constant for DCM(II); (bot-tom) the same transition energy as a function of the percent change in dielectric susceptibility from an initial solvent property of polystyrene. 27
3-1 Typical Alq3:DCM(II) (1% doping) PL emission spectrum with corre-sponding peak and ccntroid wavelength . . . . 30
3-2 Chemical structure: DCM class dyes DCM and DCM(II), polystyrene,
3-3 Typical PL emission spectrum shift for PS:DCM(II) at 0.5% doping
(top) and Alq3:DCM(II) at 1% doping(bottom) under pressure. The
top figure shows an example Gaussian smoothing fit to find peak wave-length. The computed peak wavelengths are indicated by
correspond-ingly colored dotted lines for each spectrum. . . . . 32
3-4 Typical sample scan for PS:DCM(II) at 0.5% doping under P - 0.4
GPa with peak PL plotted in white. The probe makes contact around
the center and is indicated by the shift in emission. . . . . 33
3-5 Typical pressure scan for PS:DCM(II) at 0.5% doping with peak PL
plotted in w hite. . . . . 34
3-6 Peak and centroid wavelength shift under pressure for PS:DCM(II) at
0.5% doping (top) and Alq3:DCM(II) at 1% doping(bottom). . . . . . 35
3-7 Fitting experimental results of PS:DCM(II) peak energy shift as
func-tion of change molecular packing density to simplified OLM theory using host modulus fitting parameter, resulting in Eps = 1.2 t 0.6 GPa. 36
3-8 Fitting experimental data of Alq3:DCM(II) peak energy shift to OLM
theory, resulting in EAIq3 = 0.9 ± 0.4 GPa. . . . . 37
4-1 Schematic of streak camera system. Curtesy of Hamamatsu. . . . . . 40
4-2 Streak camera data of PS:DCM(II) at 0.5% doping under select pres-sures (labeled below each figure); with time as vertical axis, wave-length as horizontal axis, and intensity indicated in color scale. The time-integrated PL spectra are plotted in white on the bottom of each figure. The wavelength-integrated time response data are plotted in
white on the left of each figure. . . . . 41
4-3 Streak camera: time-integrated PL spectra of PS:DCM(II) at 0.5%
doping under select pressures. . . . . 42
4-4 Streak camera: wavelength-integrated TRPL of PS:DCM(II) at 0.5% doping under select pressures. Intensity normalized to unity for lifetime
4-5 Streak camera: time-integrated PL spectra (top) and wavelength-integrated TRPL (bottom) of Alq3:DCM(II) at 1% doping under select pressures. Intensities are normalized for comparison; inset in top figure is the
time-integrated PL spectrum with un-normalized intensities. . . . . . 43
4-6 Streak camera: spectral diffusion as measured by peak PL emission for
PS:DMC(II) wt0.5% under select pressures. . . . . 45 4-7 Relative Spectral diffusion rate (dot) compare to FRET rate 1 factor
(solid line) due to change in dye density. . . . . 46
4-8 Streak camera: spectral diffusion as measured by peak PL emission for
PS:DMC(II) with a range of doping concentration by percent weight. 47
5-1 Illustration of CT state recombination in energy diagram of m-MTDATA
and 3TPYMB and respective chemical structures [2]. . . . . 50
5-2 PL emission spectra of 3TPYMB, m-MTDATA, and exciplex emission,
both PL and EL [2]. . . . . 51
5-3 Exciplex PL sample scan: (top-left) with color scaled intensity
nor-malized to the peak of each spectrum, (top-right) un-nornor-malized in-tensity to show a slight change in emission inin-tensity under pressure, left) computed peak wavelength of each spectrum,
(bottom-right) computed centroid wavelength of each spectrum. . . . . 53
5-4 Exciplex PL pressure scan. Emission spectral (around 550 nm) inten-sity as indicated by color-scale is plotted verses wavelength for each micrometer position in z. The residue laser (around 410 nm) shows
slight fluctuations during the measurement. . . . . 54
5-5 Exciplex PL emission spectrum under select pressure. Each set of data
is normalized to the corresponding excitation laser intensity. . . . . . 54
5-6 PL integrated intensity as a function of pressure for two independent
scans. "Pressure" indicates measurements taken during compression from zero pressure. "Release" indicates measurements taken from high
5-7 Typical exciplex PL emission measured by the streak camera: laser
residue (around 400nm), prompt fluorescence on the scale of
nanosec-onds, and long delay fluorescence on microsecond scale. . . . . 56
5-8 Log scale plot of TRPL of the prompt fluorescence of m-MTDATA:3TPYMB
sample under pressure. The dotted line fits the relevant time range for
the correspondingly colored data. . . . . 57
5-9 Log scale plot of TRPL of the delayed fluorescence of m-MTDATA:3TPYMB
sample under pressure, with dotted line fitting the relevant time range
for the correspondingly colored data. . . . . 58
5-10 Fitted prompt lifetime from TRPL data as a function of estimated
pressure for several independent scans as indicated by different symbols and colors. A slight increasing trend in lifetime as a function of pressure
is observed. . . . .. . . . . . . . 58
5-11 Fitted delay lifetime as a function of estimated pressure for several
List of Tables
2.1 Dielectric constants and dissolved DCM peak emission in select solvents 22
4.1 Fitted lifetime, spectral diffusion rate, and rate factor for select
pres-sures. The relative rate factors are found by normalizing each fitted
spectral diffusion rate to the no pressure. . . . . 45
Chapter 1
Introduction
Significant technological progress in organic semiconducting materials has led to their commercialization in the forms such as organic LED (OLED) displays, solid state lighting, and photovoltaic. To support these developments, recent research ef-forts have focused on fundamental processes purposed for applications such as
light-emitting devices [3, 4], solar concentrators [5, 6], and organic lasers [7, 8]. In
con-trast with inorganic semiconductor devices, Si-based devices being most prevalent, which operate based on minority and majority carriers, organic semiconductors op-erate based on excitons, or bound electron-hole pairs. Thus, to envision the next generation of organic electronics, a complete understanding of exciton energies and interactions is necessary.
1.1
Motivation
The optimization of organic optoelectronic devices is rooted in the fundamental un-derstanding of the physical system. Often, a host:guest doping system is selected for desirable device characteristics such as efficiency, fabrication methods, and
en-ergy tunability [5, 7, 9]. Dicyanomethylene (DCM) class dyes are used extensively as
the dopant molecules in many such applications [6, 8, 10]. To understand physical phenomenon in exciton optoelectronics and provide better device performance, the fundamental physical effects of solute-solvent interaction is crucial.
Pressure techniques have been used in various applications in organic research, ranging from sensor applications [11] to studying mechanical properties in both bulk materials [12] and thin films [13]. However, it has also proven to be a useful tool in understanding exciton energetics and molecular scale interaction with many po-tential applications [14, 15]. Previous research considered the effect of pressure on
devices such as transistors [16] as well as films of polymers to understand the effect of molecular compression [17].
This work proposes and demonstrates the use of pressure technique for exciton energy tuning due to solvation effects. The objective is to employ an accepted tech-nique in a novel application to probe organic material properties and exciton physics, and offer an additional accessible parameter for tuning exciton energy.
1.2
Local Field Effects
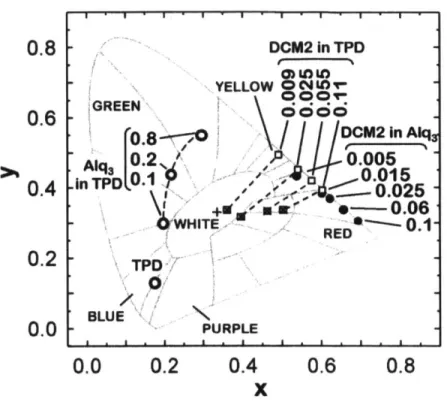
On a molecular scale, a localized electron-hole pair is usually confined to a single molecule; this bound pair is known as a Frenkel exciton. Both the excited state and the ground state of the molecule have certain electronic charge distributions across the molecule, and are often modeled as dipoles. These dipole-dipole interactions between molecules create a local electric field effect that is often characterized as a reaction field, separate from any external electric field. These effects are important in considering the perturbation on excitonic energy levels. With a better understanding of local field effects, it is possible to controllably tune the band-gap energy of the organic material, to better optimize optoelectronic devices. This solvation effect has been studied through PL measurement in doping techniques for applications such as OLEDs [1, 5, 9, 18, 19]. Recent works on OLEDs show that different emission wavelengths can be achieved for the same OLED material by simply varying relative doping concentrations as shown by the CIE color plot in Figure 1-1.
0.8
DCM2 in TPD YELLOW GREEN, o l0.6
*
08- CM2 In Ak A0.2
0.005
0.In
TPD0-Y 0.0150.4
..- 0.025
\ +e e--0.06 &WHITE 0.1 RED0.2
TPD0
BLUE 0.0-PURPLE-0.0
0.2
0.4
0.6
0.8
x
Figure 1-1: CIE plot of OLED emission of different material systems at various doping concentrations by percent weight. [1]
Previous work on the solid state solvation effect (SSSE) focused on the ability to tune peak emission by varying guest doping molecule concentration. Bulovid and colleagues reported up to 75 nm tuning of emission through doping of laser dye
4-(dicyanomethylene)-2-methyl-6-(julolidin-4-ylvinyl)-4Hpyran) (DCM(II)) in tris(8-hydroxyquinoline) aluminum (Alq3) and
N,N-diphenyl-N,N-bis(3-methylphenyl)-1,1-biphenyl-4,4-diamine (TPD) films for OLED applications [1]. They have also reported a 40 nm shift in peak PL for 0.005% DCM(II) molecules in polystyrene (PS) and varied the local dielectric by tuning doping levels of camphoric anhydride (CA) [18]. This
effect is not limited to OLEDs, and recent work by Green et al. used similar SSSE doping methods for efficient luminescent solar concentrators [5].
However, doping techniques have significant sample variability and changes in film composition create extra variables. Rather than trying to consider the effects of all the relevant variables of a complex system, it may be possible to simplify the problem
by employing an alternative technique. This led to the the proposition of observing SSSE due to simple compression of the film by measuring exciton PL emission.
1.3
Description of Experimental Setup
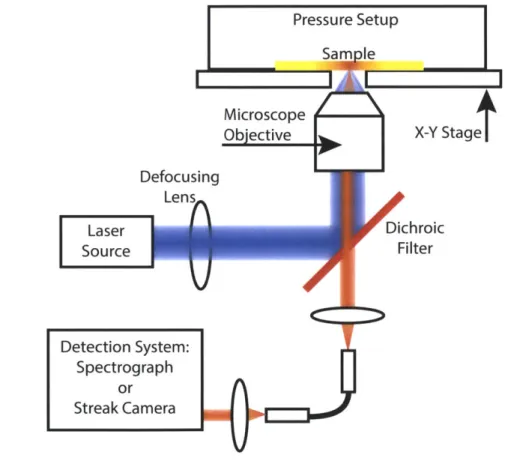
The experimental setup for general steady-state and time resolved PL spectrum mea-surements is shown in Figure 1-2.
Figure 1-2: Schematic of experimental system with simplified illustration of optical components.
A measurement sample is place on the microscope stage under a mechanical
pres-sure setup. A wavelength-tunable laser (using a optical parametric amplifier) is cou-pled into the microscope, with defocusing lens controlling excitation spot size. The microscope objective both focuses an excitation laser onto the film and captures
sub-sequent exciton emission. A dichroic filter of appropriate transmission and reflection is used to reflect excitation wavelengths and transmit sample emission wavelengths. The output of the microscope is either free-space coupled or fiber-coupled to a spec-trograph for steady-state PL or a streak camera for time-resolved PL (TRPL).
1.3.1
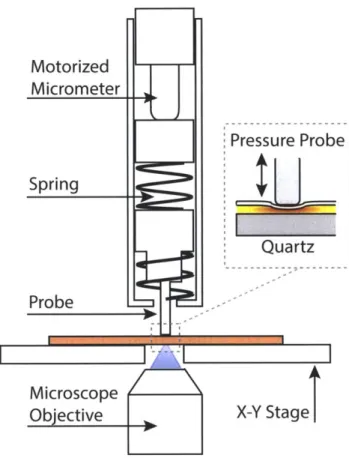
Mechanical Setup
The mechanical pressure setup, shown in Figure 1-3, is clamped onto the microscope stage. The setup includes force and sample position scanning capabilities as well as optical accessibility for PL measurement. The microscope x-y stage supports the pressure setup and moves relative to the excitation laser spot for sample scan. In order to scan pressure, force is applied through a steel probe of contact diameter of approximately 200 pm. Mechanical springs are inserted between the probe and a motorized micrometer to create a linear force-displacement relationship. Applied pressure is estimated from linearized force and approximate contact area. Using the motorized micrometer, the max pressure applied is around 0.5 GPa. A manual micrometer can also be installed to apply a greater range of pressure, which will then be limited by sample durability and possible unaccounted distribution of compression in the mechanical components. The estimated pressures have a systematic error of ~
0.1 GPa resulting from the contact area approximation.
1.4
Outline
This thesis is divided into 6 chapters:
" Chapter two includes an overview of solid state solvation theory and derives
theoretical expressions used in later experimental comparisons.
" Chapter three describes experiments on steady-state exciton photoluminescence
(PL) of doped organic films under pressure.
doped organic films under pressure, and direct comparison with doping-variable study.
e Chapter five describes pressure experiments on charge-transfer state (CT), namely
an exciplex state, in thin-film bulk heterojunction for device applications.
e Chapter six includes future works and concluding remarks.
Figure 1-3: Experimental setup for in situ optical measurement of organic thin film sample under mechanical pressure.
Chapter 2
Solid State Solvation Effect
The solvation effect, as pertains to organic molecules, describes the physical reori-entation of surrounding solvent molecules due to a change in solute dipole moment during absorption or emission, which in turn perturbs the exciton transition energy. This effect has long been observed in liquid state by a simple phenomenon of different
color emission of the same dye molecule dissolved in various solvents
[18,
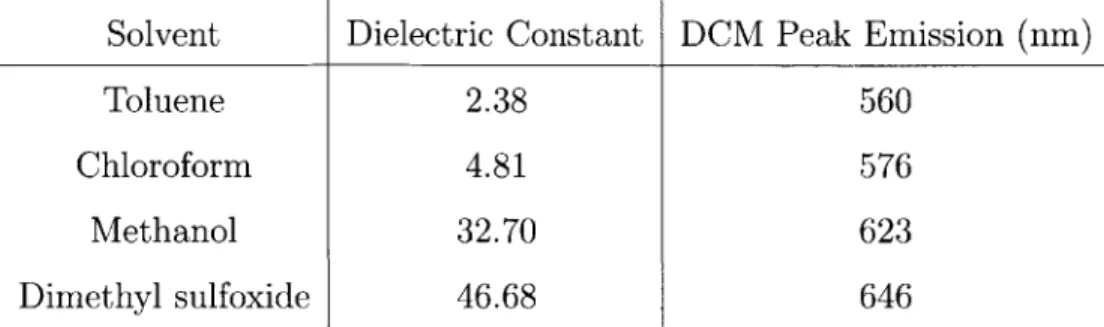
19, 20].Figure 2-1 shows measured PL of DCM dye dissolved in common organic solvents.
Peak wavelength
500 550 600 650 700
Wavelength(nm)
750 800
Figure 2-1: Shift in PL for DCM molecules dissolve in select solvents. The peak emission changes due to different solvent dielectric constants
1- 0.8-C (D _c 0.6-CU.0 N E 0.4-0 z 0.2- 0-450
As consistent with reported literature results [18], in Figure 2-1, the DCM peak
PL emission shows a clear redshift for solvents of higher dielectric constants1, which
is summarized in Table 2.1.2
Solvent Dielectric Constant DCM Peak Emission (nm)
Toluene 2.38 560
Chloroform 4.81 576
Methanol 32.70 623
Dimethyl sulfoxide 46.68 646
Table 2.1: Dielectric constants and dissolved DCM peak emission in select solvents
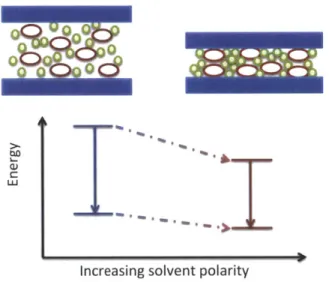
Further study in solid state showed that through molecular doping, the same local dielectric field effect is observed by simply having more neighboring dye molecules as part of the solvent environment. The gross movement in solvent dipole alignment affects the excitonic energy states, both ground and excited, which affects the transi-tion energy. Because this effect is dependent on the dipole moment of the guest dye molecule, the shift in transition energy may be a bathochromic (red) shift or a hyp-sochromic (blue) shift. For typical dyes, the transition dipole is aligned such that for increasingly polarizable solvent environments a bathochromic shift in transition en-ergy is observed, termed positive solvatochromism as illustrated in bottom schematic of Figure 2-2. The reaction electric field from solvent reorientation allows an energy relaxation in typical solute molecules with large transition dipole moments. DCM class dyes are one such example, which exhibits the characteristic red shift. There are molecules such as the merocyanine dyes, which would exhibit the negative sol-vatochromism effect and a hypsochromic shift is observed for increasing polarizable solvent [19].
As mentioned in the previous chapter, although doping studies showed clear SSSE,
1http://macro.lsu.edu/HowTo/solvents/Dielectric%2Constant%20.htm
2
For intellectual curiosity, the same PL measurements of DCM dissolved in various deuterated form of the select solvents were performed. The peak PL emissions were found to be the same within spectrum resolution for each solvent and corresponding deuterated solvent. As discussed later in this chapter, these results suggest that solvation effect is dominated by factors such as dielectric constant and dipole moment of solvent, which is not effected by deuteration.
to further our understanding of local dielectric effects on energy states, a new tech-nique is necessary which eliminates variables introduced in composition differences and sample-to-sample experimental variations. In this effort a pressure technique was employed, which can cause film deformation and decrease intermolecular dis-tance. This decrease in molecular spacing effectively created different local dielectric solvent environments using a controlled external parameter, as illustrated in the top images of Figure 2-2)
LU
Increasing solvent polarity
Figure 2-2: Solvatochromism: (top) change in molecular spacing to change polariz-ability, (bottom) bathochromic shift in transition energy for increasing polarizable medium for typical dye molecule, or positive solvatochromism.
2.1
Solvation Theory
To model the solute dipole interaction with surrounding solvent media, consider a dielectric continuum model with a few standard assumptions as consistent with the Onsager model for liquid state solvation effects [21]:
" solute electronic densities are reduced to dipoles
* solute molecules are enclosed in spherical cavities, and are only affected by neighboring molecules within a certain constant radius, a
A dipole as a first order approximation of the electron density is a fairly accurate
description of the dye molecules used in this work [20]. The second assumption was an implicit approximation of the solvent environment. There are many alternative models in capturing a more accurate system using explicit methods or a combina-tion, and variations on cavities and solute modeling exist to make model selection nontrivial [22]. This work focused on the spherical cavity model, which simplified much of the computation and still gives a reasonable representation of the energy shifts. To calculate the change in transition energy, consider the dipole moments of the solute and the reaction field created by the Frank-Condon effect upon absorption.
This reaction field Ereaction is dependent on the polarizability of the solvent and the
corresponding solute static dipole moment for the ground and excited states. Thus a
simple Stark perturbation on the energy is given by AE = -p -Ereaction. Considering
all the factors, the change in the transition energy as measured by emission according to Ooshika-Lippert-Mataga (OLM) solvation theory is expressed as [23, 24, 25, 26]:
as
AEPL 3A'-( ,),+A( 2)"(21
2( - 1)
A(c) = (2.2)
2E + 1
The solvent polarizability is manifest in two different capacities: the nuclear
reori-entation A(E) and the electron reorireori-entation A(n 2). Note that this transition energy
was calculated for molecular emission, and the Franck-Condon shift in energy due to molecular orientation was taken in to account. A similar expression could be derived for the absorption transition energy. However, experimentally, solvatochromism is easier measured in emission rather than absorption due to the time response of sol-vent reorientation compared to photon absorption time scales. To further simplify the system to have a direct relationship between change in transition energy and density, a few more assumptions were included:
* the solute electron reorientation term pgA(n 2) is negligible with respect to the
. solute molecule dipole moments are constant with pressure
The high frequency solvent electron reorientation term is approximately on the same time scale as solute absorption and emission with some contribution to the solvation effect. Since the dipole moment of the ground state of DCM is almost 5 times less than that of the excited state [20], any effect due to change in density would be dominated by the first term. Thus, the contribution of the second term was assumed to be relatively invariant as a function of pressure compared to the low frequency solvent nuclear reorientation term. The second assumption specifies
that the dipole moments of the excited state Pe ground state pg, and transition Ap
were only dependent on the doping molecule properties and were also constant with pressure. These assumptions result in a simple relationship of change in transition energy as a function of local dielectric constant [18]:
AEPL - -AA(e) + C (2.3)
We used the relationship of x = E - 1 to find the relationship between the change
in dielectric susceptibility from its initial value and the change in transition energy.
AEPL
~ -A+
C = -A ( m2Xj(IjA
) + C (2.4)(4X + 3 4xm(1 + AX) + 3)
Note that Em Xm 1 is simply the bulk dielectric constant of the host-guest
system under zero pressure. For example, polystyrene (PS) with 0.5% doped DCM(II) has em = 2.44 [18]. From here, the constants A and C are found for specific dye
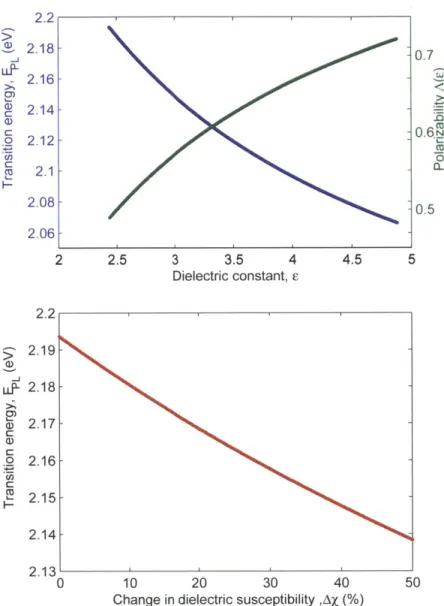
molecules by simply fitting the peak PL emission energy of the dye dissolved in various liquid solvents as a function of dielectric constants, for which there exist an abundance of published works for most common organic dyes. Such fitting of DCM(II) dye in liquid state studies will give the values: A = .55 eV, C = 2.4 eV [18], and the transition energy as a function of dielectric is plotted in Figure 2-3.
Further approximations were necessary to relate these theoretical results to ex-perimental values. A first order consideration of the relationship between the density of molecules and dielectric susceptibility revealed a direct proportionality, such that
a percent change in density would be directly reflected in a percent change in
suscep-tibility, AN(%) = -=x AX(%). Now, we have a direct relationship between
change in film density and change in emission energy. Since pressure P was applied in only one dimension, the change in density is the change in linear strain in the axis of applied stress. Thus, the fit to theory for the pressure-dependent experimental results is a simple relationship as expressed below, where the elastic modulus of the material Em is used as a fitting parameter:
AEPL ~ -A + C -A
21
1)(2
mi- +C4 (emn - 1) (1 + AN) + 3) 4(Em - 1) 1 + + 3
(2.5)
2.2 u.)-LL C C 2.18- 2.16-2.14 2.12 -2.1 [ 2.08 [ 2.06
[
2 2.5 3 3.5 4 Dielectric constant, c 2.2 LLfL C a) 0 C 2.13' 0 10 20 30 40Change in dielectric susceptibility ,AX (%)
0.7 0.6~ 0-5 0 0.5 4.5 5 50
Figure 2-3: DCM(II) emission transition energy shift as predicted by OLM theory: (top) the theoretical prediction of the emission transition energy (on the left axis in blue) and the solvent nuclear polarizabilty (on the right axis in green) as a function of dielectric constant for DCM(II); (bottom) the same transition energy as a function of the percent change in dielectric susceptibility from an initial solvent property of polystyrene.
Chapter 3
Steady-State Photoluminescence
Steady-state spectroscopy was performed with a common spectrograph system, which spectrally resolves the signal using a slit and grating and creates a spatial mapping of spectral data. A detector system measures the light intensity for each wavelength, in this case an array of Si photodetectors. The resolution of the spectrograph can be limited by the slit size as well as detector pixel size'. Photoluminescence (PL) is a standard and widely-accepted method of measuring transition energy in emission of semiconductors.
The peak PL emission of materials is often used as a measurement of the excitonic band-gap energy. However, it is important to note that the emission spectrum are dependent on factors such as the density of states and energy relaxation or transfer, thus the spectrum may be multi-peaked. To further complicated the measurement, a significant Stokes shift often exists between peak absorption and emission energies. In these organic systems, the peak energy measured is the peak emission of the organic
molecules, which undergoes a Franck-Condon shift [27] to a significantly lower energy due to molecular re-orientation.
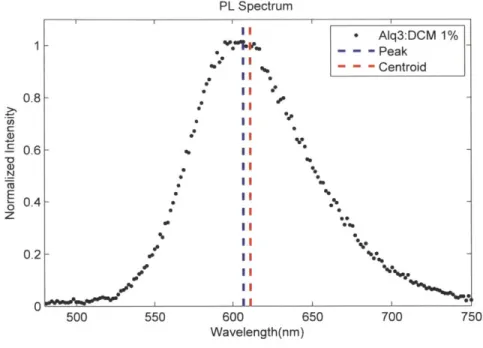
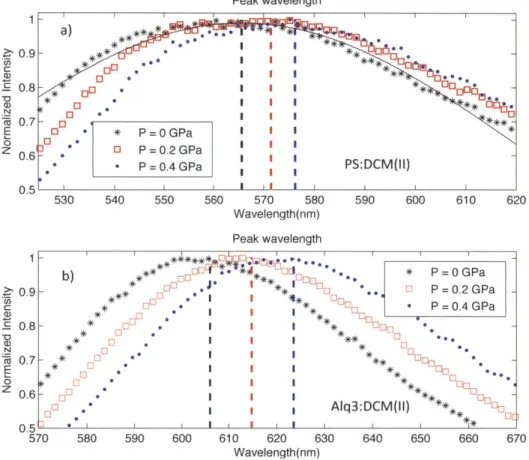
For SSSE experiments, emission of dye molecules such as DCM(II), shown in Fig-ure 3-1, have a single peak (indicated with blue dash), which represents the most likely exciton emission transition energy. The theoretical expression derived from the
'In the following experiments, signal intensity was sufficiently high such that all measurements were pixel resolution limited.
previous chapter is based on emission energy; thus, PL is an accurate experimental measure of this transition. Note that due to energy transfer, the emission spectrum is slightly asymmetric with a red tail. It may be useful to also consider the cen-troid energy (indicated with red dash), the median energy resulting from a weighted averaging of the intensity over wavelength.
PL Spectrum 4b . II -- II **0 I I 4PE 0AI AIq3:DCM 1% - - - Peak - - - Centroid * -.*, 500 550 600 650 Wavelength(nm)
Figure 3-1: Typical Alq3:DCM(II) (1% doping) PL emission spectrum with
corre-sponding peak and centroid wavelength
The difference between the peak and the centroid highlights the difference between
the normalized intensity PL spectral profile and a Gaussian curve2. The combination
of the two metrics gives a better picture of any change in the emission spectrum, both peak and shape. Only the peak is used when considering the most probably bandgap energy.
2
A Gaussian distribution has the same peak and centroid. C N 0 Z 0.8 0.6 0.4 0.2 0 700 750 1
3.1
Sample Preparation
Samples were deposited on clean thick quartz substrates by either vacuum thermal
evaporation or solution spin coating. Films of 200 nm Alq3:DCM(II) were deposited
using thermal co-evaporation at a chamber pressure below 10-6 Torr at a total rate of 4.0 A/s. Sample doping concentration was controlled by calibrated relative deposition rates with doping variability within 0.5%. For example, a 1% doped film would be de-posited by using DCM(II) doping rate of .04 A/s. Films of 200 nm PS:DCM(II) were spin-cast from a 30mg/ml chloroform solution at 2000 RPM; doping concentrations were controlled by relative mass dissolved in initial solvent.
PS
AIq3K i
NN
DCM
DCM2
NC CN NC CN
Figure 3-2: Chemical structure: DCM class dyes DCM and DCM(II), polystyrene,
and Alq3
After deposition, each sample of organic film was packaged with a clean, thin glass cover to avoid any photo-oxidation related degradation. The glass cover is flexible to allow pressure probing of the sample, but adds uncertainty in pressure by spreading the applied force.
We recorded the steady-state PL spectra using a spectrograph and Si camera detector array as shown in Figure 1-2. An excitation source of A = 475 nm was used, where DCM(II) has large absorption and the host materials has relatively insignificant
absorption; specifically, PS and Alq3 are transparent at 475 nm
[28].
For each PLspectra taken, the peak was found by fitting to a Gaussian to quantify shifts in spectra; an example peak fit is shown in Figure 3-3 as a solid black curve to find peak of PL plotted as black dots.
3.2
Spectral Results
Peak wavelength a* .* I I I * 0- I I I 0 0 0 - * P0GPa * 0 3 P = 0.2 GPa ' * P=0.4GPa 530 540 550 560 570 580 Wavelength(nm) Peak wavelength 610 620 630 Wavelength(nm) 590 600 610 620 * P=OGPa SP = 0.2 GPa SP= 0.4 GPa * El 3:DCM(II) 0* El C) 640 650 660 670Figure 3-3: Typical PL emission spectrum shift for PS:DCM(II) at 0.5% doping
(top) and Alq3:DCM(II) at 1% doping(bottom) under pressure. The top figure shows
an example Gaussian smoothing fit to find peak wavelength. The computed peak wavelengths are indicated by correspondingly colored dotted lines for each spectrum.
3.2.1
Sample Scan
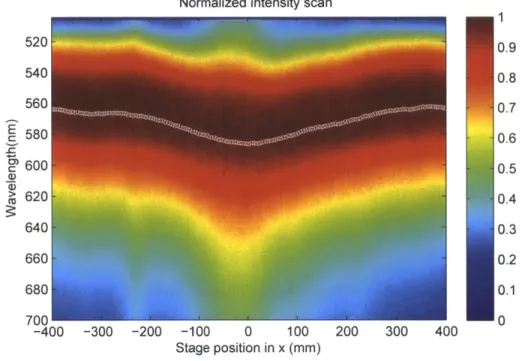
We scanned a laser of spot size diameter -50 pm across the point of pressure in a sample scan to find the spectrum red shift induced by the pressure probe (Figure 3-4). Each vertical slice of the figure represents the steady-state PL spectrum with intensity shown in color-scale verses the vertical axis of wavelength. A peak wavelength was found for each spectrum and plotted as white dots overlaying the sample scan data.
0.9 0.8 0.7 0.6 0.5 C: CD N 0 C Ni C E 0 Z
A clear red shift of over 20 nm was observed under pressure.
The sample scan data suggests a possible use of pressure for exciton energy gra-dient on the micrometer scale. Since excitons (electron and hole pairs) are neutral in charge, diffusion studies are difficult due to lack of precise creation of energy
gradi-ents3. It may intriguing to consider patterned microscopic pressure probes to create
shorter scale energy gradients for possible studies on excitonic diffusion, which is usually on the scale of tens of nanometers.
Normalized intensity scan
E C (D C 520 540 560 580 600 620 640 660 680 700 -400 -300 -200 -100 0 100 Stage position in x (mm) 200 300 400 1 0.9 0.8 0.7 0.6 0.5 0.4 0.3 0.2 0.1 0
Figure 3-4: Typical sample scan for PS:DCM(II) at 0.5% doping under with peak PL plotted in white. The probe makes contact around the
indicated by the shift in emission.
P ~ 0.4 GPa center and is
3.2.2
Pressure Scan
Pressure scans are performed by observing the PL of the film under the point of pressure as a function of micrometer displacement. A 3-D data plot similar to the sample scan data is generated for each pressure scan as shown below in Figure 3-5.
3Diffusion study on charged particles are often performed using electric field to create energy
Normalized intensity scan 700 1 680 0.9 660 0.8 640 0.7 E 0.6 E.:- 620 @ 600 0.5 > 0.4 c 580 560 0.3 540 0.2 0.1 0 2 2.5 3 3.5 4 4.5 5 Stage position in z (mm)
Figure 3-5: Typical pressure scan for PS:DCM(II) at 0.5% doping with peak PL plotted in white.
Pressure scan results showed a reversible bathochromic shift in peak PL emission
over 15nm in samples of 200nm thin film of Alq3:DCM(II) at 1% doping. For 200nm
thin films of PS:DCM(II) at 0.5% doping, around 10nm reversible bathochromic peak
shift was observed. For increasing pressure, the observed effects are consistent with increasing the concentration of guest molecules in SSSE, as expected. This indicates an increase in the local dielectric constant under compression. To confirm the spectral shift, the centroid was also computed for each spectrum. The comparison between
the fitted peak and computed centroid as a function of pressure for the two different samples is plotted in Figure 3-6.
Because the spectrum of PS:DCM(II) is slightly more asymmetric with more
emis-sion in the longer wavelength tail, the difference between the centroid and the peak
is larger than that of Alq3:DCM(II). For both samples, the shifts in PL centroid are well correlated with the shift in peak emission, confirming the homogeneity spectral shifts of the sampled dye molecules.
590 585 E 580 : 575 c50 :570 565""' '' 0 Centroic 560 0 0.1 0.2 0.3
Estimated Pressure (GPa)
C C (D a) 630 625 620 615 610 605. 600 0 0.1 0.2 1.98 2 2.02 2, CD 2.04 k itroid 2.06 0.3 0.4
Estimated Pressure (GPa)
Figure 3-6: Peak and centroid wavelength shift under pressure for PS:DCM(II) at
0.5% doping (top) and Alq3:DCM(II) at 1% doping(bottom).
12 14-162) a1 18 0.4
3.3
Experimental Fit to Theory
The experimental PL peak energy can be now plotted with the theoretical prediction given in Equation 2.5 using the elastic modulus of the host material as a fitting parameter. 2.2 UP 0 C Cu -2.195 2.19 2.185 2.18 2.175 2.17 2.165 2.16 2.155 564 566 568 CD 570 (D 572 574 0 5 10 15 20 25 30 Change in density, AN (%)
Figure 3-7: Fitting experimental results of PS:DCM(II) peak energy shift as function of change molecular packing density to simplified OLM theory using host modulus
fitting parameter, resulting in Eps = 1.2 + 0.6 GPa.
PS:DCM(II) experimental results fitted the simplified OLM theory as shown in Figure 3-7, with an PS elastic modulus of 1.2±0.6 GPa. This was in relatively good agreement with measured literature values [29], which confirms that the observed bathochromic shift was dominated by local dielectric effects, as expected. A similar fit
was performed for the Alq3:DCM(II) to find an estimated elastic modulus of 0.9t0.4
GPa for Alq3 as shown in Figure 3-8. This fitted value was within error of measured
2.05 - 606 - - - Theory 2.04 o AIq3:DCM(II) -608 - 610-w 2.03 -612 0 CU c 2.01 -H--618 2 - o - 620 622 1.99 '' ' ' 0 5 10 15 20 25 30 35 40 Change in density, A N (%)
Figure 3-8: Fitting experimental data of Alq3:DCM(II) peak energy shift to OLM
theory, resulting in EAIq3 = 0.9 ± 0.4 GPa.
These results show that the pressure probing technique is a viable method in studying SSSE, and provides a unique parameter for exciton energy tunability. More precise pressure systems may result in a new method of measuring elastic modulus of thin amorphous organic films to corroborate established methods such as nano-indentation or wrinkle-based techniques. As mentioned, further work with patterned micro-scale probes may yield an interesting technique to study exciton diffusion, sim-ilar to pressure systems used to trap exciton-polaritons in microcavity structures [32].
Chapter 4
Time-Resolved Photoluminescence
Time-resolved PL (TRPL) is a standard technique employed to understand the time response of a material to pulsed excitation and is often used to measure exciton life-times in semiconductors. To fully understand the effects of compression on organic thin films, time response data is essential. TRPL comparisons between compression and doping results are made. A streak camera setup was used to obtain simultane-ously time-resolved and wavelength-resolved PL data.
4.1
Streak Camera
To obtain spectral data in TRPL, one common method is a streak camera system (Figure 4-11). The setup has a spectral slit and grating similar to a spectrograph. Subsequently, the spectrally resolved photons are limited by a second, orthogonal spatial slit (for temporal resolution) and are converted to electrons using a photo-cathode. Then, a pair of sweeping electrode deflects the electrons to create a spatial mapping of the temporal data. The electrons, spectrally separated in one dimen-sion and temporally resolved in the other, are captured using a phosphor screen and camera setup.
The Hamamatsu streak camera system used is capable of time resolution measure-ments up to ps; for even finer time resolution spectral measurement, a Kerr shutter
system may be employed. For the organic materials under study, the time resolution of the streak setup was sufficient.
TRIGGER SIGNAL SWEEP STREAK IMAGE ON ELECTRODE PHOSPHOR SCREEN
LENS
4
0 0
0A~
0LIGHT MS - SE
INTENSITY TilME S.-- E SCE TIME
PHOTOCATHODE ACELERATING PHOSPHOR SPACE
Figure 4-1: Schematic of streak camera system. Curtesy of Hamamatsu.
4.2
Wavelength- or Time-Integrated
TRPL techniques are often used to observe exciton radiative lifetime and a fast-response photo-detector may perform the same lifetime measurement in a more sim-plified setup. However spectrally resolved measurements could give additional insights on spectral diffusion and will be considered in the next section. In this section, we analyze the data from the streak camera using either wavelength or time integration: time integration will produce similar result as steady-state and will be a confirmation of the experimental result of the previous chapter; wavelength integration will result in the time response measurement used to determine exciton lifetime.
To fully quantify the effect of pressure, time resolve measurement of both PS:DCM(II) and Alq3:DCM are performed under select pressures. In previous works, drastic changes in lifetime were observed for host:guest organic thin films due to sample dop-ing concentration [33]. The drivdop-ing mechanism behind the change in exciton lifetime is the significant aggregation of guest dye molecules for increasing doping concen-tration, creating non-radiative states and quenching sites. Notably, this aggregation effect and other film composition related effects should not play a significant role in pressure techniques.
I
30 25 20 - 15 i 2.5 1 3 10 3.5 5 4 4.5 0 500 550 600 650 700 750 800 Wavelength (nm) P - 0 GPa 0 0 0.5 0.5 1 1 1.5 15 2 2I 2.5 -_ 2.5 3.5 3.5 4 4 500 550 600 650 700 750 800 500 550 600 650 700 750 800PWavelength (n) P 0.2 GPa Wavelength (nm)
0 0 0.5 0.5 S1.5 2 2 3 3 35 3.5 4 4 4.5 500 550 600 650 700 750 800 4.5 500 550 600 650 700 750 800
P 0.3 GPa WavelengthP ~ 0.4 GPa Wavelength (nm)
Figure 4-2: Streak camera data of PS:DCM(II) at 0.5% doping under select pressures (labeled below each figure); with time as vertical axis, wavelength as horizontal axis, and intensity indicated in color scale. The time-integrated PL spectra are plotted in white on the bottom of each figure. The wavelength-integrated time response data are plotted in white on the left of each figure.
pressures are shown in Figure 4-2. The time-integrated PL spectrum for each set of data was plotted to find the same result as the steady-state measurements; an evident red shift in peak emission was observed as consistent with the steady-state findings (Figure 4-3). ~0 N 700 580 600 6,' Wavelength (nm) Figure 4-4: Streak doping under select
time-integrated PL spectra of PS:DCM(II) at 0.5% doping
3 3.5 4 4.5
camera: wavelength-integrated TRPL of PS:DCM(II) at 0.5% pressures. Intensity normalized to unity for lifetime comparison. Figure 4-3: Streak camera:
under select pressures.
10 (D N10 =GPa. E o 0 P=0.2GPa z SP =.3 GPa 0 P=.4GPa 10-2 ' ' ' ' 0 0.5 1 1.5 2 2.5 Time (ns)
This confirms the steady-state trend discussed in the previous chapter. For the exciton lifetime measurements, Figure 4-4 plots the wavelength-integrated time re-sponse of the PS:DCM(II) under pressure.
Each TRPL was fitted to an exponential lifetime, which are listed in Table 4.1. Instead of a significant decrease in lifetime as expected for aggregation effects, a slight increase in lifetime was observed. This supports the supposition that pressure technique was a more direct method compared to doping experiments, where the change in composition could also contribute to a red shift in emission, the same effect as the bathochromic shift of SSSE. The sample streak camera measurements and analysis were performed for Alq3:DCM(II) films and are plotted in Figure 4-5
1 0.8 0.6 0.4 0 z 0.2 0 10 580 600 620 640 660 680 700 wavelength (nm) 00 P 0.21 ~ - . ' 0 * P=OGPa .* e P=0.2GPa P=0.4GPa -0. 0 P=0.6GPa 0 0 * 0 kg.2 8 1 3 1 1, 0 1 2 3 4 5 Time (ns) 6 7 8 9 10
Figure 4-5: Streak camera: time-integrated PL spectra (top) and wavelength-integrated TRPL (bottom) of Alq3:DCM(II) at 1% doping under select pressures. Intensities are normalized for comparison; inset in top figure is the time-integrated PL spectrum with un-normalized intensities.
W C 0 Z 10 102 1-3 10 -1
The integrated data analysis of Alq3:DCM(II) yielded similar results as the PS:DMC(II) films. A similar red shift in spectrum is observed, and lifetime changes were minimal. Because Alq3 is a polar medium, the following analysis of spectral diffusion focused mainly on PS samples.
4.3
Spectral Diffusion
The advantage of using a streak camera over a simple photo-detector setup in observ-ing TRPL is the simultaneous time-resolved and spectrally resolved measurement capability. Thus, it was useful in tracking any change in PL spectrum over time, namely spectral diffusion as the exciton relaxed to lower excited energy states during a short time between excitation and emission. The focus of this section is on the spec-tral diffusion of PS:DCM(II) films and comparison of the effects of pressure verses doping techniques. This information was extracted from the TRPL streak camera data such as those shown in Figure 4-2 by taking each temporal slice and finding the peak of the emission spectrum at each specific time after excitation. This analysis was performed for each set of data, and plotted as peak emission energy as a function of time in Figure 4-6 for select pressures.
The spectral diffusion rate was found for each set of measurements by fitting a line to the peak energy shift during the first nanosecond after excitation and is listed in Table 4.1. To clarify the effect of pressure, the relative increase in diffusion rate was found by normalizing the diffusion rate to that measured under zero pressure. The relative diffusion rate scale factor is also listed.
2.3 ) Q) C wU 2.25 2.2 2.15L-0
Peak Spectral Diffusion
0.2 0.4 0.6
Time (ns)
Figure 4-6: Streak camera: spectral diffusion as
PS:DMC(II) wt0.5% under select pressures.
0 -2)5 0 555 00:) 00) 560 0 ~ 565 -570 -575 0.8 1
measured by peak PL emission for
Pressure (GPa) 0 0.1± 0.1 0.2+ 0.1 0.3+ 0.1 0.4± 0.1 Table 4.1: Fitted li The relative rate f to the no pressure.
Lifetime (ns) Spectral Diffusion Rate (eV/ns) _Relative Rate Factor 1.24± 1.22± 1.28± 1.30± 1.35± 0.04 0.02 0.02 0.03 0.03 -0.019± -0.028± -0.030± -0.035+ -0.036± 0.004 0.004 0.003 0.002 0.002 1 1.43 1.55 1.84 1.90
ifetime, spectral diffusion rate, and rate factor for select pressures. actors are found by normalizing each fitted spectral diffusion rate
Since the Frenkel exciton energy transfer in these organic thin films occur through Forster radiative energy transfer (FRET) [34, 35], the change in spectral diffusion rate is expected. The change in spectral diffusion rate under compression is due to two major processes. First, under pressure, the intermolecular spacing between the solvent and the solute dye decreases, thus the spacing between the sparsely doped
DCM(II) dye molecules, r, also decreases proportionally. Since FRET transfer rate
scales as kFRET OC !, we expect a increase in transfer rate. Second, assuming a
constant FRET radius rFRET, as more molecules are packed closer, the number of
available transfer sites also increases. Both factors contribute to an overall increase in the magnitude of spectral diffusion rate.
Consider only the effect of change in molecular density on FRET rate, which is estimated from pressure and the fitted elastic modulus of 1.2 GPa for PS. Similar theoretical relative scale factors on the FRET rate were computed and compared with the corresponding scale factor on spectral diffusion rate in Figure 4-7.
2.5 0 U 2 CD .0 1.5 1 Theory 0 Experimental 0.5' 0 0.1 0.2 0.3 0.4
Estimated Pressure (GPa)
Figure 4-7: Relative Spectral diffusion rate (dot) compare to FRET rate i factor (solid line) due to change in dye density.
To compare these pressure result, the same spectral TRPL measurements and analysis were performed on films of PS:DCM(II) at varying doping concentration by weight. The measured spectral diffusion is plotted in Figure 4-8.
5-C) C CO a) 2.3-2.25 2.2 2.15 2.1~ 2.05 . 0.1
Peak Spectral Diffusion
0.2 0.3 0.4 0.5 0.6 0.7 0.8 0.9 Time (ns) 540 550 560 570 580 D 590 ' 600 610 620
Figure 4-8: Streak camera: spectral diffusion as measured by peak PL emission for
PS:DMC(II) with a range of doping concentration by percent weight.
The fitted diffusion rates and relative rate scale factors are listed in Table 4.2. Doping (wt%) 0.5 2 5 10 Spectral Diffusion -0.019+ -0.048± -0.096± -0.103± Rate (eV/ns) 0.004 0.011 0.006 0.007
Relative Rate Factor
1 2.5 5.0
5.4
Table 4.2: Spectral diffusion rate and rate factor for select doping concentrations.
Although a larger change in the spectral diffusion rate is observed for the doping method than for sample under pressure, the doping analysis is not as simple. The same simple comparison to the FRET rate is no longer valid since a 10% doped film
by dye molecule density consideration should have 400 times the rate of of 0.5% doped film, which is significantly different from the observed factor of 5.4.
iii, ::!IC 0 0 )~O000000oO. 00.~0ho00o0 000~000 :Ki: )000 0 00000COO 000 00 oO 2% ooo 0 0 5 0000 0% S05% 2% ooo0 o00 00 5%00 10%
Chapter 5
Application to Exciplex System
Any technique that reveals some property of the physical world is important. How-ever, the importance stems from an application of that understanding or technique that could advance current technology. One relevant application of organic films stud-ied this thesis is in the form of OLEDs. OLEDs have been commercially successful partly due to ease of fabrication, device flexibility, and range of color availability. In this section, we discuss preliminary work on organic material systems for more efficient OLEDs. The system under consideration is a blend bulk heterojunction
of 4,4' ,4"-Tris(N-3-methylphenyl-N-phenylamino)triphenylamine (m-MTDATA) and Tris(2,4,6-trimethyl-3-(pyridin-3-yl)phenyl)borane (3TPYMB).
5.1
Background
The interfaces formed by m-MTDATA (hole-injection layer) and 3TPYMB
(electron-injection layer) create exciplex states, which are a form of charge-transfer (CT) states.
A CT state involves an exciton delocalized across 2 different molecules; in this case,
the bound electron is localized on the 3TPYBM, while the corresponding hole is on the m-MTDATA. This bound state is an intermediary between free charge states and exciton states. In OLEDs, this exciplex eventually recombines and emits a photon of the energy difference between the lowest unoccupied molecular orbit (LUMO) of the electron-injection layer and the highest occupied molecular orbit (HOMO) of the
hole-injection layer (Figure 5-1). Most OLEDs suffer from the unfortunate property that 75% of created excitons exist in the non-radiative triplet state. Since only the singlet state is quantum mechanically allowed to transition to ground state, emission is somewhat limited to the 25% singlet excitons. Previous work on phosphorescent OLEDs used doped films to assist spin-orbit coupling in order for the triplet exciton to transfer into singlet before emitting in delayed fluorescence. [36, 37].
N 2.0 eV LUMO m-MTDATA P33 eV level N 5.1 eV 3PM 6.8 eV HOMO o"'Cm' i alevel
Figure 5-1: Illustration of CT state recombination in energy diagram of m-MTDATA and 3TPYMB and respective chemical structures [2].
However, there is a lack of a clear understanding of the mechanism and rates of intersystem crossing (ISC) from singlet to triplet and reverse intersystem crossing (RISC) from triplet to singlet. We propose the SSSE via pressure method of tuning exciton energies, both singlet and triplet, which may change the energy splitting between the two states. Due to the nature of the exciples state, tuning the distance between the two different molecules will change the spatial overlap and alter the delocalization of the exciton across the molecules, which should also change the energy splitting. Note that transition between ground state and triplet state is quantum mechanically forbidden. Thus, all emission and absorption transition occurs between the ground state and the singlet state.
This material system has the characteristics of a clear prompt PL fluorescence (emission directly from singlet state) and a significant delayed fluorescence (emission from the singlet state after ISC and RISC). Due to the time necessary for the exciton to transfer from the initially excited singlet to triplet, then back to singlet before emis-sion, the lifetime of the delayed fluorescence is orders of magnitude longer than that of the prompt. Recent work on m-MTDATA:3TPYMB and similar OLED systems demonstrated the importance of temperature on thermally assisted delay fluorescence
(TADF) on OLED emission [2]. Since the RISC pathway is a thermally-assisted pro-cess, the change in temperature determined the thermal energy available to help the triplet exciton to overcome the energetic barrier of the splitting. This was observed in an increase in RISC rate as measured by delayed PL fluorescent lifetimes for increas-ing sample temperature. However, similar measurements could be performed under pressure, and may yield interesting results and a better physical understanding of the system. 1 Eu 0 4-0 1 14 300 400 500 600 Wavelength (nm) 700
Figure 5-2: PL emission spectra of both PL and EL [2].