Publisher’s version / Version de l'éditeur:
Technical Note (National Research Council of Canada. Division of Building Research), 1960-03-14
READ THESE TERMS AND CONDITIONS CAREFULLY BEFORE USING THIS WEBSITE.
https://nrc-publications.canada.ca/eng/copyright
Vous avez des questions? Nous pouvons vous aider. Pour communiquer directement avec un auteur, consultez la
première page de la revue dans laquelle son article a été publié afin de trouver ses coordonnées. Si vous n’arrivez pas à les repérer, communiquez avec nous à PublicationsArchive-ArchivesPublications@nrc-cnrc.gc.ca.
Questions? Contact the NRC Publications Archive team at
PublicationsArchive-ArchivesPublications@nrc-cnrc.gc.ca. If you wish to email the authors directly, please see the first page of the publication for their contact information.
NRC Publications Archive
Archives des publications du CNRC
For the publisher’s version, please access the DOI link below./ Pour consulter la version de l’éditeur, utilisez le lien DOI ci-dessous.
https://doi.org/10.4224/20338534
Access and use of this website and the material on it are subject to the Terms and Conditions set forth at
Water temperature observations taken 12 Jan. to 1 Feb. 1960 during air bubbling trials
Williams, G. P.
https://publications-cnrc.canada.ca/fra/droits
L’accès à ce site Web et l’utilisation de son contenu sont assujettis aux conditions présentées dans le site LISEZ CES CONDITIONS ATTENTIVEMENT AVANT D’UTILISER CE SITE WEB.
NRC Publications Record / Notice d'Archives des publications de CNRC:
https://nrc-publications.canada.ca/eng/view/object/?id=2a339064-5030-450c-a4d2-fcf74ea575cf https://publications-cnrc.canada.ca/fra/voir/objet/?id=2a339064-5030-450c-a4d2-fcf74ea575cf
DIVISION OF BUILDING RESEARCH
NATIONAL RESEARCH COUNCIL OF CANADA
'fE
C
1HIN II CAlL
NOTE
セ
セi
NOT FOR PUBLICATION
PREPARED BY G. P. Williams
PREPARED FOR Record purposes
CHECKED BY LWG
FOR INTERNAL USE
APPROyED By NBR
SUBJECT WATER TEMPERATURE OBSERVATIONS TAKEN l2 JAN. TO 1 FEB. 1960
DURING AIR BUBBLING TRIALS
This study was undertaken by the Division of Building Research at the request of the Hydraulics Laboratory of the National Research Council, Division of Mechanical Engineering.
Description of Ice Conditions Before Experiments (25 Jan 1960) The total ice thickness varied from 16 to 17.5 inches.
Approximately 12 inches of this amount was solid ice. The upper 6 inches was a mixture of ice and water, overlain by approximately 4 inches of snow with a density of about 0.25 gm/cc.
Apparatus Used
The air bubbling equipment was a single air-line installed on the bottom in the middle of the 400- by 600-foot tank. The water depth was about
7.3
feet.The water temperature was measured with an instrument developed by the Radio and Electrical Engineering Division of NRC. The tempera-ture sensing element is
a
thermistor. The readings were probablyaccurate to within ±'O.l C.
.,
2
-thermocouples at various positions relative to the air bubbling unit. The bridge used in connection with these thermocouples was installed inside a heated bUilding by the side of the tank. Though these
thermocouple readings generally checked with the thermistor readings, it was found that they were of limited usefulness because the water temperature pattern developed was different than expeoted. Thus the more mobile method of taking temperature readings with the portable thermistor proved most valuable.
All temperature readings now reported were taken with the thermistor and portable resistance bridge.
Figure 2 shows the water temperature changes in the hole opened in the ice by the air bubbler.
Figure 3 shows typical water temperature profile changes approximately 60 feet from the air bUbbling unit (i.e. from centre of the hole opened in ice).
I .
Summary of Observations
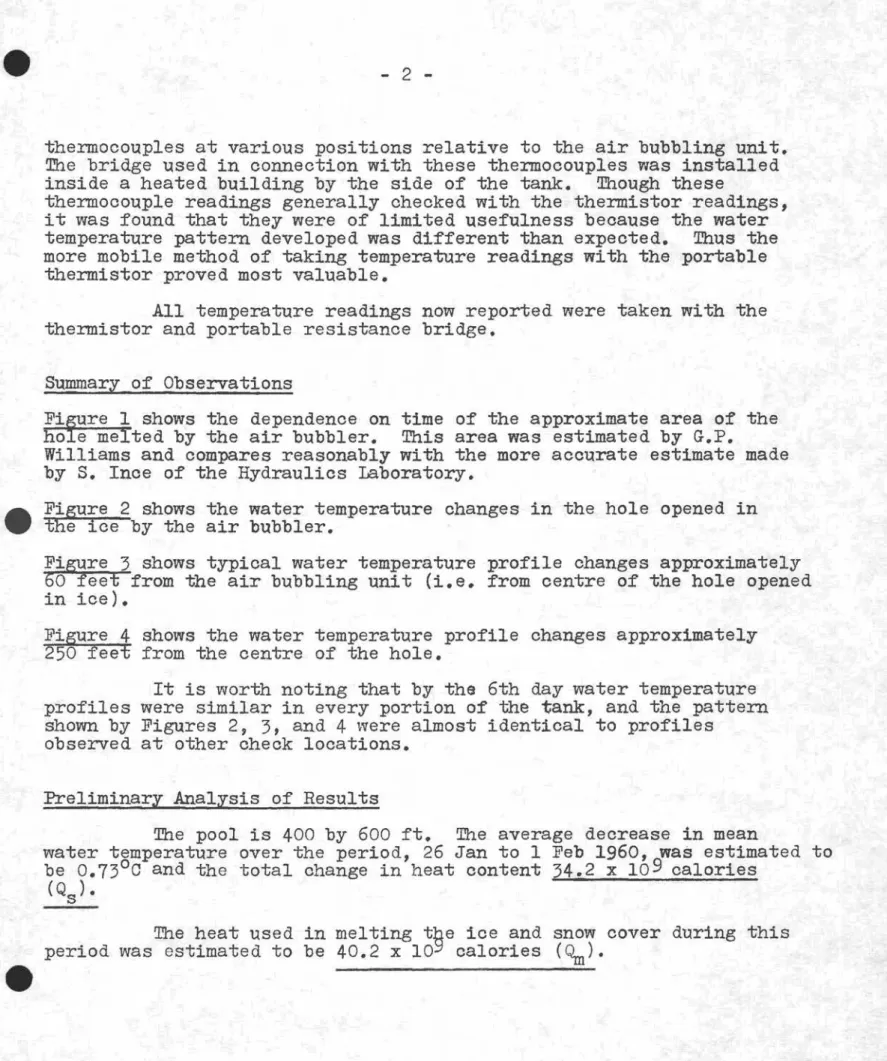
Fiyure I shows the dependence on time of the approximate area of ho e melted by the air bubbler. This area was estimated by G.P. Williams and compares reasonably with the more accurate estimate by S. Ince of the Hydraulios Laboratory.
the made
Figure 4 shows the water temperature profile changes approximately 250 feet from the centre of the hole.
It is worth noting that by the 6th day water temperature profiles were similar in every portion of the tank, and the pattern shown by Figures 2, 3, and 4 were almost identical to profiles
observed at other check locations. Preliminary Analysis of Results
The pool is 400 by 600 ft. The average decrease in mean
water temperature over the period, 26 Jan to I Feb 1960'9was estimated to be 0.7300 and the total change in heat content 34.2 x 10 calories
(Qs) •
The heat used in melting the ice and snow cover during this period was estimated to be 40.2 x QPセ calories HセIN
..
3
-Assuming the heat gained by the water from the bottom of the pool was 1.0 Btu/sq ft/hr (Nybrant), the total heat gained from the bottom was calculated to be 8.56 x 10⁹ calories (Qb).
The heat loss by snow falling into the open water during this period was calculated to be 0.15 x 10⁹ calories (Q snow) •
The heat loss to the atmosphere through the ice cover was neglected because both the upper and lower surfaceS of the ice cover were at 000, indicating that heat loss by conductiou. was negligible.
Oalculating the heat balance the heat loss to the atmosphere (Qa) is estimated to be:
Qa = Q snow + Qs + Qb + セ
2.56 x 10⁹ calories
= 21.5 oalories/sq cm/hr
= 80 Btu/sq ft)hr (assuming average area of 900 sq ft) During this period the average sol-air temperature recorded at the DBR meteorological site was -11.100. Assuming a mean water
surface temperature of +3.700, the average difference between the
sol-air temperature and the water surface temperature is 14.800.
Previous studies show that this difference would result in a heat loss of approximately 70 to 90 Btu/sq ft/hr which compares with the cal-culated value. Actually what this confirms is that the heat .e;ain from the bottom of the whole pool must have been near the 1.0 Btu/sq ft/hr used in the estimate.
Oonclusions
1. Under these experimental conditions, the air bubbling unit produced convection currents enabling heat to be carried to the open hole from the whole volume of water in the tank. There was therefore a good thermal reserve available for the considerable ioe melting during the period of trial. Probably this hole could have been kept open for a long period, as there was still considerable thermal reserve when the tests were discontinued.
2. It was interesting to note that for this case the heat loss from the open water surface was considerably less than the
4
-estimated heat gain from the bottom of the pool. In any additional experiments it would be worth while trying to obtain observations of this heat gain from the bottom.
3. The large amount of heat used in melting the ice requires that a more precise estimate be made of the volume of ioe melted in future experiments.
4. The ice seemed to melt primarily at the circumference of the hole with no evidence of melting at the underside away from the rim of the open hole.
5.
In future experiments it would be interesting to observe the minimum amount of air flow needed to obtain convective mixingthroughout the tank. It would also be interesting to repeat these
experiments in a lake to see over how large an area convective currents can be established by a single air bubbling unit.
DiVISION OF BUILDING RESEARCH. NATIONAL RESEARCH COUNCIL -2000 セ セ 0 1500 (f) <[ 1000 LLJ a:: <[ z 500 LLJ a. 0
V
/VI
V
V!
/ VV
0 1 2 3 4 5 6 7 8 TIME (DAYS) FIGURE IOPEN AREA - RELATED TO DURATION OF TEST
TLCHNICAL NOT£.
#305
0:/ セLp £VIL.L IAA4S. £ ...5.
I
1 F£B, 18/iPO! , f•• I-2
'0
FIGURE 2
OPEN WATER AT END OF PIER
WATER TEMPERATURE (OC)1-0 2·0 3-0 4·0 5·0
.#
0 0-
セ 2 w W LL 4 I セ a.. 6 w 0 4 - - - -4 - - - -BOTTOM ORIGINAL PROFILE;:
AG|セセ
Pセ
FIGURE 3
UNDER ICE COVER 60 FT FROM CENTRE OF HOLE
oNNNLNNNLセNNNNNNNLNNNNLLNNNNLNNNNLNNNNLNNNNNLNMLMLLNNNLNNNNNイMッM ...NNLNNNNNLNNNNNLNNNNLNセセセNNLNNNNLNNNNLNNNセNNLLNNNNLNNNNLNNNL t:i 2 w LL
セ
2イZセセセセ]ZsセZZMZセセセセセc]セQ
w LL ORIGINAL I I-セ 6 o I I-セ 6 -oo
1-0I 2·0I 3·0I 4·0IWATER TEMPERATURE (OC)
5·0
NOTE: CIRCLED NOS. INDICATE NO. OF· DAYS FROM BEGINNING OF TEST