Development, testing, and application of quantitative oxygenation
imaging from magnetic susceptibility by MRI
by Audrey P. Fan
B.S., Stanford University, 2008
S.M., Massachusetts Institute of Technology, 2010
Submitted to the Department of Electrical Engineering and Computer Science in Partial Fulfillment of the Requirements for the Degree of
DOCTOR OF PHILOSOPHY
at the
MASSACHUSETTS INSTITUTE OF TECHNOLOGY June 2014
© 2014 Massachusetts Institute of Technology. All rights reserved.
Signature of author
Certified by
Signature redacted
Department of Electrical Engineering and Computer Science May 21, 2014
Signature redacted
Elfar AdalIsteinsson Associate Professor, Electrical Engineering and Computer Science, Health Sciences and Technology, Institute of Medical Engineering and Science Thesis Supervisor
Accepted by
_______Signature redacted
I
(2
J
Leslie A. KolodziejskiProfessor of Electrical Engineering and Computer Science
sF TrS INsQLOGY
Development, testing, and application of quantitative oxygenation
imaging from magnetic susceptibility by MRI
by Audrey P. Fan
Submitted to the Department of Electrical Engineering and Computer Science in Partial Fulfillment of the Requirements for the Degree of Doctor of Philosophy.
ABSTRACT
The healthy brain consumes 20% of total oxygen used by the body under normal conditions. Continuous oxygen delivery to neural tissue is needed to maintain normal brain function and viability. Reliable measurements of brain oxygenation can provide critical information to diagnose and manage diseases in which this oxygen supply is disturbed, including stroke and tumor. In acute stroke, for instance, metabolic biomarkers such as local oxygen extraction fraction (OEF) have been shown to identify tissue at risk of infarction by positron emission tomography. This knowledge can then be used to identify patients who are candidates for reperfusion therapies or to avoid thrombolytic therapy in futile situations.
Unfortunately, there is currently no clinically feasible method for radiologists to assess brain oxygenation in patients. My thesis aims to address this need through development of a clinically viable tool to examine regional OEF in the brain with magnetic resonance imaging (MRI).
We have designed a novel imaging and analysis method to quantify oxygenation in cerebral veins. MRI phase images are sensitive to local, oxygenation-dependent magnetic field variations in brain vessels, due to the presence of paramagnetic deoxyhemoglobin molecules in venous blood. Our method was developed on a 3 Tesla MRI scanner and tested in 10 healthy volunteers during hypercapnia, i.e. breathing of low levels of C02. This respiratory challenge
changes the baseline oxygenation state of the brain, enabling us to test whether our MRI method can detect different levels of OEF in vivo. We also show that OEF is reduced in 23 patients with multiple sclerosis, an autoimmune disease of the central nervous disease, and relates to their performance on cognitive tasks.
Thesis Supervisor: Elfar Adalsteinsson
Title: Associate Professor, Department of Electrical Engineering and Computer Science, Department of Health Sciences and Technology, Institute of Medical Engineering and Science
Acknowledgements
This page of the thesis was the certainly hardest for me to write.
To my adviser Elfar Adalsteinsson, thank you for welcoming me to the MRI Group. You've bravely shepherded me, through dark times and good, and you've made me into a better person.
Bruce Rosen, without you this thesis would literally not have possible. Thank you for your creative insight, and for being my utmost champion.
Denny Freeman, you've been a rock and mentor throughout my time at MIT. Thanks for teaching me to teach, and preparing me for "the beginning of the beginning" after graduation. Ellen Grant and Karl Evans, your energy and kindness were my fuel through the last stretch of the PhD.
Dwight Nishimura, you have supported me during college and throughout graduate school. I can't wait to come home to Stanford and share with you the person I've become.
I appreciate Leslie Kolodziejski and Martha Gray for challenging me to look at the big picture, and the impact I could make if I use my skills for good. I thank Arlene Wint, Linda Butler, Donna Crowe, and Elizabeth Hoy for their radiant smiles and making my life so much easier.
My labmates Trina, Berkin, Itthi, Christin, Paula, Borjan, Jeff, Filiz, Adrien, Shaoying, Joonsung, Kawin, Lohith, Obaidah, Patrick, Jean-Philippe, Bo, Shivang and German have seen me at my worst, and yet still believe in me. I'm grateful for their companionship and intellectual vibrancy. I thank my clinical collaborators in the MS group and the QTIM group and David Boas for giving me a reason to go to work every day.
To my friends, what a wonderful time it's been! I'll miss the "get-fit-get-fat" escapades with Lori, Chelsea, Yvonne, Tiffany, Tim, and James. I treasure the potlucks with my fam-bam, Ramesh, Carrie, and William. John and Grace, you gave me a home, physically and emotionally, when I needed it the most. Vineeta, you always made me feel that I could run the distance. Kristina, perhaps I need you to help me express how much I cherish our friendship. I thank the lovely ladies in EECS, Rose, Ermin, Shreya, Bonnie, Ying, and Lei for being my role models.
To my sisters Kathy, Denise, and Lillian, and my parents, your love is precious. This thesis is dedicated to you.
Contents
Acknow ledgem ents ... 5
Figures...11
Tables ... 15
1. Specific Aim s ... 17
2. Background and Significance... 19
2.1. Clinical need for oxygenation imaging... 19
2.2.1. Acute ischem ic stroke and oxygenation imaging ... 19
2.2.2. Brain cancer and tumor hypoxia imaging ... 23
2.2.3. Metabolic changes in neurodegenerative diseases and normal aging...25
2.3. Q uantitative M RI of Oxygenation ... 27
2.3.1. Calibrated BOLD measurements of oxygenation during functional activity...28
2.3.2. Intravascular T2 relaxation measurements of oxygenation... 30
2.3.3. Susceptibility weighted imaging of oxygenation ... 32
2 .4 . S ig n ific a n c e ... 3 3 3. Development: Quantitative oxygenation venography from MRI susceptibility ... 35
3 .1 . A b s tra c t ... 3 5 3 .2 . In tro d u c tio n ... 3 5 3.3. Materials and Methods... 37
3.3.1. Relationship between OEF and magnetic susceptibility ... 37
3.3.2. Regularized approaches for quantitative susceptibility mapping ... 39
3.3.3. Numerical sim ulations... 40
3.3.4. M RI Acquisition... 41
3.3.5. Quantitative susceptibility map reconstruction... 41
3.3.6. Vessel graphing and display of quantitative OEF venograms... 42 3 .4 . R e s u lts ... 4 3
3.4.1. Effect of
et-
versus e2- regularization on OEF ... 433.4.2. Comparison between OEF from MR susceptometry and QSM ... 44
3.4.3. OEF reconstruction profile across vessel tilt angle... 48
3.4.4. Quantitative oxygenation venograms in vivo... 49
3 .5 . D is c u s s io n ... 5 1 3.5.1. Quantitative oxygenation venograms in healthy volunteers and comparison with p re v io u s stu d ie s ... 5 1 3.5.2. Limitations of the study ... 53
3 .5 .3 . C o n c lu s io n s ... 5 4 4. Testing: Regional quantification of cerebral venous oxygenation from susceptibility during hypercapnia...55
4 .1 . A b s tra c t ... 5 5 4 .2 . In tro d u ctio n ... 5 6 4.3. Materials and methods... 58
4.3.1. MRI acquisitions ... 58
4.3.2. Gas manipulations ... 59
4.3.3. Quantitative susceptibility mapping reconstruction... 60
4.3.4. Processing of arterial spin labeling scans ... 61
4.3.5. Quantitative measurements of brain physiology...62
4.3.6. OEF predictions from blood flow changes... 64
4.3.7. Statistical methods... 64
4 .4 . R e s u lts ... 6 5 4.4.1. Measurements of CBF and OEF during eucapnia and hypercapnia...65
4.4.2. Comparison of measured versus predicted OEF in various brain regions ... 65
4 .5 . D is c u s s io n ... 6 9 4.5.1. Vessel contrast during gas modulation... 69
4.5.2. Regional OEF changes during hypercapnia... 69
4.5.3. Assumption of constant CMRO2 during hypercapnia and potential pitfalls...70
4.5.4. Future methodological improvements to oxygenation imaging ... 71
4 .5 .5 . C o n c lu s io n s ... 7 3 5. Application: Quantitative oxygenation extraction fraction and reproducibility in m ultiple sclerosis at 7 Tesla MRI susceptibility... 75
5 .1 . A b s tra c t ... 7 5 5 .2 . In tro d u c tio n ... 7 6
5.3. Materials and Methods... 77
5.3.1. Patients and Control Subjects... 77
5.3.2. Data Acquisition... 78
5.3.3. Data Processing for OEF Quantification... 79
5.3.4. MRI Characterization of Tissue Volumes, Lesion Volumes and Lesion Counts....81
5.3.5. Neuropsychological Testing Methods ... 82
5.3.6. Statistical analysis ... 82
5 .4 . R e s u lts ... 8 4 5 .5 . D is c u s s io n ... 8 8 5.5.1. OEF findings in multiple sclerosis and reproducibility... 88
5.5.2. Lim itations of the work ... 89
5.5.3. Conclusions ... 90
6. Conclusions and Future Directions...93
6.1. Modeling the vasculature for improved accuracy of OEF imaging ... 93
6 .1 .1 . Im p a c t...9 3 6.1.2. Proposed approach... 94
6.1.3. Metrics of success ... 95
6.1.4. Potential pitfalls and alternative strategies ... 95
6.2. Fast, efficient acquisition of susceptibility to enable a clinical oxygenation exam. ... 96
6 .2 .1 . Im p a c t...9 6 6.2.2. Proposed approach... 97
6.2.3. Metrics of success ... 97
6.3. High-resolution estimation of the cerebral metabolic rate of oxygen (CMRO2) at 7 Tesla 98 6 .3 .1 . Im p a c t...9 8 6.3.2. Proposed approach... 98
6.3.3. Metrics of success ... 99
6.3.4. Potential pitfalls and alternative strategies ... 99
Figures
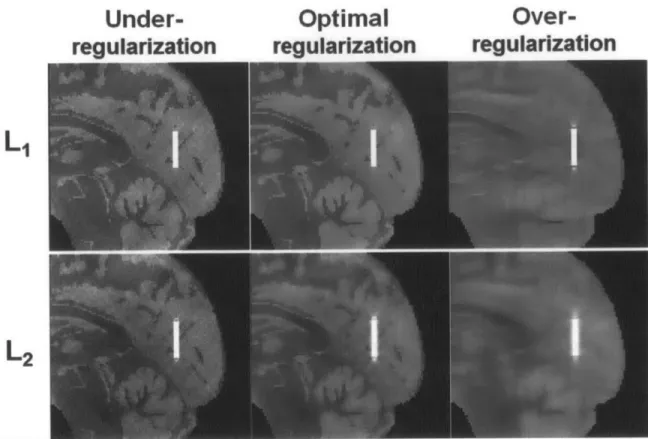
Figure 3.1. Susceptibility mapping results with
el-
and f2- regularization in numerical simulation of a parallel vessel. The optimal regularization weighting parameters determined by thediscrepancy principle were k1 = 3.0x10-4 and X
2 = 1.5x10⁻². Images are also shown for
under-regularized solutions with smaller regularization weighting than optimum (11 = 5.0x10⁻⁵ and 2 = 2.0x10⁻³
); as well as over-regularized solutions with larger regularization weighting than
optim um (11 = 3.0x10⁻³ and k2 = 0.2)... 44 Figure 3.2. (Left) Plot of absolute OEF error in venous oxygenation (%) from QSM across regularization weighting parameters in numerical simulation. At the optimal weighting of k1 = 3.Oxl 04, fl-regularized QSM resulted in 1.6% error. In contrast, at the optimal weighting of k2 = 1.5x1 0-2, F2-regularized QSM resulted in 6.9% error... 45 Figure 3.3. (Right) The same sagittal slice is shown from in vivo susceptibility maps from -1F-and e2-regularized QSM. The susceptibility maps were created at the optimal regularization parameters for the in vivo data, k1 = 4.5x1 0-4 and X2 = 1.Ox1 0-2. The zoomed inset highlights a cortical pial vessel on the susceptibility maps. OEF from QSM in this cortical vein was 33.5% and 29.7% for F1- and F2-regularization, respectively. ... 45
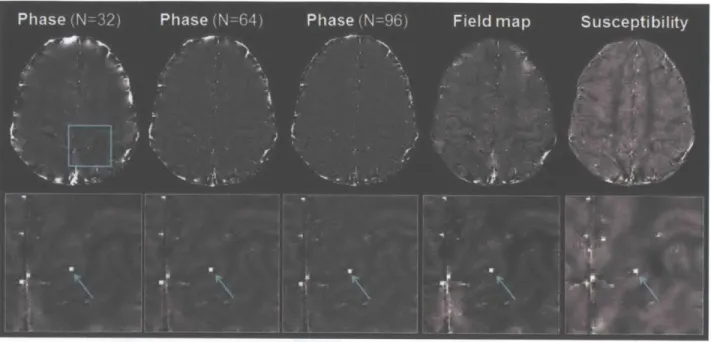
Figure 3.4. Parallel vessel identified on the same slice in phase, field map, and susceptibility images. The phase images at TE = 20.3 ms are shown after removal of background signal and phase wraps with Hanning filter of width 96/512, 64/512, and 32/512 of the image matrix size respectively. The field map image is shown after removal of undesired global fields estimated by projection onto dipole fields (Liu et al., 2011 a). The susceptibility map was reconstructed with fl-regularization at the optimal weighting of A1 = 4.5x1 04. The same cross-section of the
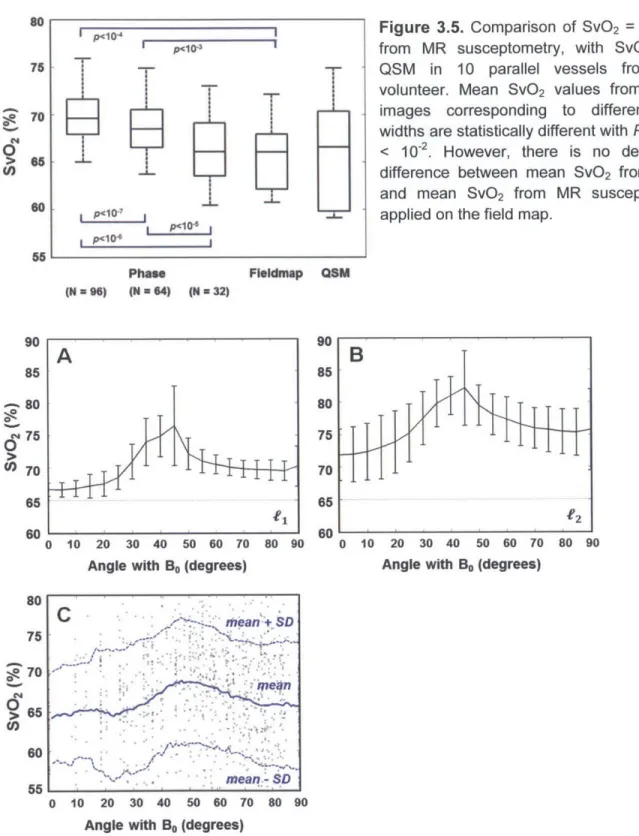
Figure 3.5. Comparison of Sv0 2 = 1- OEF from MR susceptometry, with SvO2 from QSM in 10 parallel vessels from one volunteer. Mean SvO2 values from phase images corresponding to
different filter widths are statistically different with P-values < 10-2. However, there is no
detectable difference between mean SvO2 from QSM and mean SvO2 from MR susceptometry a p p lie d o n th e fie ld m a p ... 4 7 Figure 3.6. Mean SvO2 from QSM in numerical simulation across vessel tilt angle with respect to
the main field (Bo) for fl-regularized (A) and V2-regularized QSM algoirthms (B). The error bars indicate standard deviation of estimated SvO2 and the dotted line delineates the true simulated
value of 65% (dotted line). (C) Mean SvO2 from QSM across vessel tilt angle observed in vivo from one healthy volunteer. Each data point represents a SvO2 measurement from a single
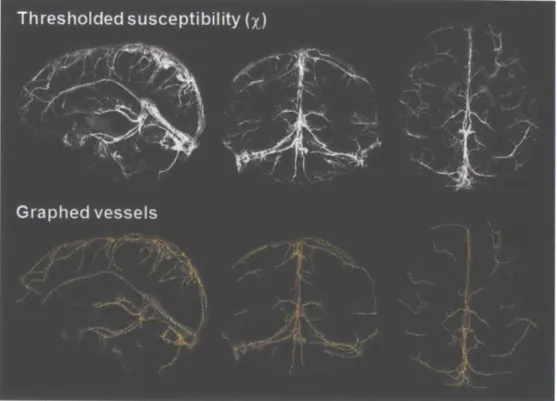
v e s s e l e d g e ... 4 7 Figure 3.7. Susceptibility map in one healthy volunteer thresholded at X > 0.15, and the
corresponding vessels that are graphed by the Volumetric Image Data Analysis software in MATLAB (Tsai et al., 2009). In this volunteer, the venous vasculature is represented by a total of 1090 edges inside the vessels. ... 48
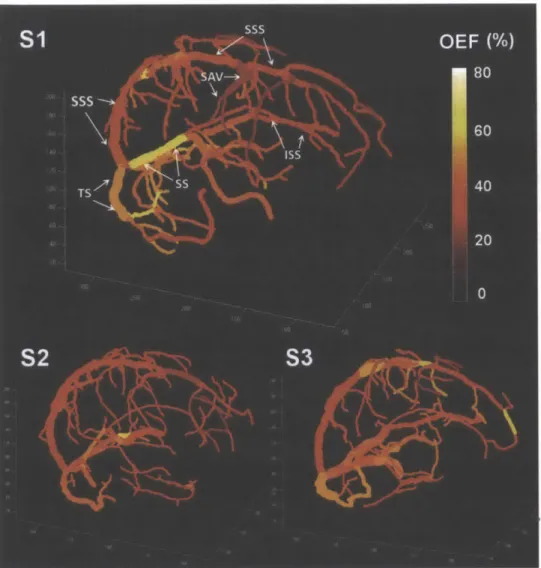
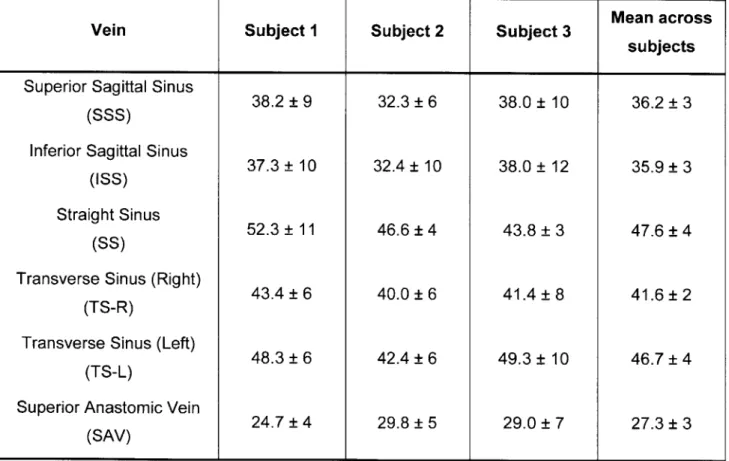
Figure 3.8. Quantitative oxygenation venograms which display baseline OEF along each vein in three healthy volunteers. In the first subject, major veins in the brain are labeled, including the superior sagittal sinus (SSS), inferior sagittal sinus (ISS), straight sinus (SS), transverse sinus (TS), and superior anastom ic vein (SAV). ... 49
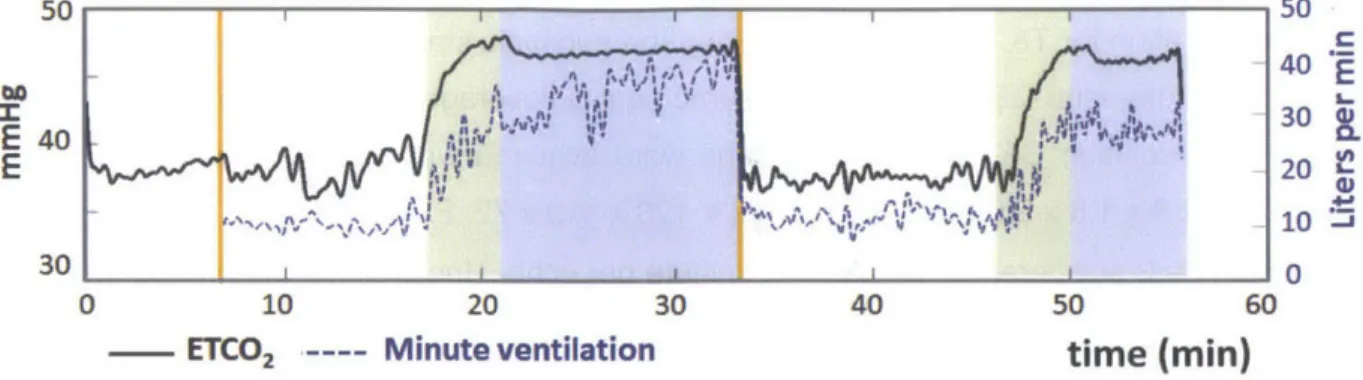
Figure 4.9. Physiological time courses of end-tidal C02 (ETCO2) in mmHg and minute ventilation in L/min for one healthy volunteer. Green regions indicate transition periods (-4 minutes) between eucapnia and hypercapnia, and blue regions indicate periods of stable
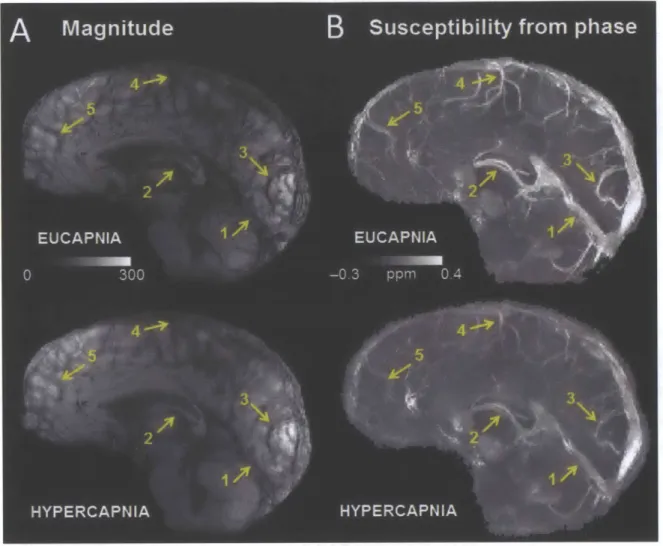
hypercapnia. As expected, ETCO2 increased during hypercapnia and was associated with an increase in m inute ventilation... 60 Figure 4.10. (a) Minimum intensity projection of gradient echo magnitude images and (b)
maximum intensity projections of quantitative susceptibility maps (ppm) over 20-mm
corresponding to eucapnia and hypercapnia in one volunteer. Notice the diminished vessel contrast due to decreased venous blood susceptibility during the hypercapnic condition relative to the eucapnic condition on both magnitude and susceptibility images. Yellow arrows indicate
individual vessels of interest including (1) the straight sinus, (2) the internal cerebral veins, (3) occipital pial veins, (4) parietal pial veins, and (5) frontal pial veins. ... 62
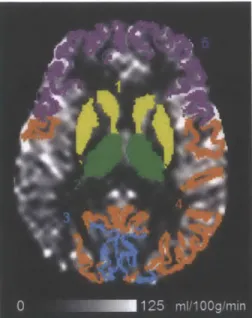
Figure 4.11. Regions of interest (ROI) defined from Freesurfer
(http://surfer.nmr.mgh.harvard.edu) cortical segmentation for quantification of local cerebral blood flow (CBF) on arterial spin labeling data in one healthy subject. ... 63 Figure 4.12. Scatter plots across subjects of normalized % change in oxygen extraction fraction (OEF) versus increase in end-tidal C02 (ETCO2) in mmHg. The plots are generated separately for (a) the straight sinus and internal cerebral veins draining deep gray matter; and (b) cortical pial vessels draining surface gray matter. Linear fits are shown for each graph with slope (% OEF / mmHg) indicating reactivity of vessel OEF to the hypercapnic challenge, and R value to characterize the goodness of fit. ... 67 Figure 4.13. Scatter plots across subjects of measured versus predicted percent change of oxygen extraction fraction (OEF) in (a) deep gray matter, and in (b) superficial cortical regions. Measured OEF values (vertical axis) derive from susceptibility measurements in individual veins; while the OEF predictions (horizontal axis) are determined solely by cerebral blood flow (CBF) values from the arterial spin labeling acquisitions. Linear fits are shown for each graph with slope with R value to characterize the goodness of fit... 68
Figure 5.14. Orientation and geometry of representative cortical vessel segment in a patient with clinically isolated syndrome. (a) Sagittal views of magnitude (top) and filtered phase (bottom) from the gradient echo acquisition. The rectangles highlight the vessel identified in (b), which depicts the zoomed magnitude (left) and phase (right) of the vein. The double-sided arrow indicates the segment of the vessel approximately parallel to Bo. (c) Axial view of magnitude (left) and phase (right) of the same vessel, as indicated by the single-sided arrow. ... 80 Figure 5.15. Examples of the distribution of cortical vessels in various brain regions selected for quantitative oxygen extraction measurements. Axial phase images are displayed after filtering from a control subject (top) and a patient with secondary progressive MS (bottom). ... 80 Figure 5.16. Bland-Altman plots depicting (a) inter-observer and (b) inter-observer
reproducibility of mean cortical OEF made from the same data in 5 controls and 5 patients. (c) Scatter plot depicting scan-rescan variability of mean cortical OEF in 5 separate healthy subjects scanned twice in sessions a week apart. The diamonds show confidence intervals based on the mean standard deviation of OEF across sessions computed in the group. ... 86
Figure 5.17. Box-plot representation of OEF in 14 controls and 23 patients with MS in the (a) sensorimotor cortex, (b) parietal cortex, (c) prefrontal cortex, and (d) averaged across the entire cortex. The asterisks indicate significantly reduced OEF in all patients relative to healthy
controls by the Mann-Whitney test before correction for multiple comparisons... 87
Figure 5.18. Scatter plot of the correlation between mean cortical OEF with (a) processing speed Z-score (p = 0.50, uncorrected P = 0.01), and with (b) executive function Z-score (p = 0.48, uncorrected P = 0.03). These relationships remained significant even after correction for
Tables
Table 3.1. Mean absolute OEF (%) levels in major veins of the brain for three healthy volunteers ... 5 0 Table 4.2. Mean and standard deviation of cortical physiological parameters measured by MRI in each gas condition (N = 10)... . . 66 Table 5.3. Demographics and cognitive characteristics of 23 patients with multiple sclerosis... .78
Table 5.4. Table of References for Neuropsychological Test Normative Values...83 Table 5.5. Mean and standard deviation of OEF across the cortex (%) in reproducibility
a n a ly s e s ... 8 5 Table 5.6. MRI characteristics of 23 patients with multiple sclerosis... 85 Table 6.7. Accelerated acquisitions for QSM... 97
1. Specific Aims
The overall goal of this thesis is to develop magnetic resonance imaging (MRI) tools for non-invasive, quantitative imaging of human brain oxygenation during normal physiology and in neurological disorders such as stroke, tumor, and Alzheimer's disease. Venous oxygen saturation (SvO2) and Oxygen extraction fraction (OEF) in the brain are important indicators of
tissue health and viability. To date, established in vivo methods to measure these parameters have relied on positron emission tomography (PET) imaging with 150 radiotracers. However, 150
PET is not clinically used because it requires injection of short-lifetime radiotracers, invasive arterial sampling, and specialized equipment that is not widely available in hospitals. A regional, quantitative MRI method to study brain oxygenation would offer non-invasive imaging with improved resolution and scan time, and serve to replace 150 PET measurements of OEF.
We have developed new MRI technique, phase-based regional oxygen metabolism (PROM), to quantify regional brain oxygenation (Fan et al., 2012). The approach measures local OEF in individual vessels by direct quantification of the oxygenation-dependent magnetic susceptibility shift between cerebral veins and surrounding brain tissue (Haacke et al., 1997a; Weisskoff and Kiihne, 1992b). PROM uses standard sequences available on most clinical scanners to acquire MRI phase images, and applies post-processing to extract relevant metrics of physiology. Initial oxygenation measurements in healthy human volunteers from PROM MRI studies fall in the normal physiological range identified by 150 PET studies in the literature (Fan
et al., 2012). Despite these promising findings, the method is limited to cerebral vessels with specific geometry and orientation, and its reliability has not been characterized in different oxygenation settings.
To make the MRI tool more broadly applicable in the brain, 3-dimensional susceptibility distributions were reconstructed, from which absolute OEF can be visualized along the cerebral venous vasculature. We tested the new method in human subjects at rest and during mild hypercapnia, i.e. inhalation of low concentrations of C02, which provides known alterations the
global oxygenation state of the brain. After this validation, susceptibility-based oxygenation imaging was applied to patients with multiple sclerosis (MS), an autoimmune disease of the central nervous system. Subtle reductions in cerebral OEF have been observed in MS both from PET and MRI studies (Brooks et al., 1984; Ge et al., 2012). The pilot study may further our understanding of the pathophysiology underlying MS disease, and supports use of OEF imaging as a novel metabolic biomarker to monitor MS evolution. The specific aims of this thesis are to:
Aim 1: Develop quantitative oxygenation venography from MRI. We demonstrated new acquisition and processing methods to create oxygenation venograms that map absolute OEF along the brain venous vasculature. State-of-the-art quantitative susceptibility mapping (QSM) was used to reconstruct susceptibility values and estimate OEF in veins of arbitrary orientation and geometry. OEF imaging was then implemented in vivo and compared to values from previous phase-based MRI approaches. We also evaluated the performance of the method for various vessel orientations with respect to the main magnetic field.
Aim 2: Test oxygenation imaging during hypercapnia. Here we tested whether the susceptibility-based MRI approach can detect expected OEF changes during CO2
inhalation. Healthy volunteers were scanned on a 3 Tesla MRI during eucapnic and hypercapnic gas states. Local OEF changes between the two conditions were measured in individual cerebral vessels, both in the deep gray matter and cortical gray matter. Assuming no change in the underlying oxygen metabolism in each condition, regional changes in perfusion were used to predict local oxygenation changes. We compared our OEF measurements with these predictions to build confidence in the technique.
Aim 3: Apply oxygenation imaging to patients with multiple sclerosis. In collaboration with Dr. Caterina Mainero at the Athinoula A. Martinos Center for Biomedical Imaging, we compared brain oxygenation in patients at different stages of MS to age-matched controls. We also evaluated the reproducibility of OEF measurements in both cohorts at 7 Tesla. Finally, because the pathological and clinical correlates of altered oxygen metabolism are not well understood, we evaluated quantitative OEF changes against MRI measures of tissue damage and measures of clinical disability in patients.
The outcomes of this thesis are contributions toward a validated, quantitative MR-based toolset to investigate human brain oxygenation in vivo. These tools will be significantly more accessible to clinicians and researchers than PET-based methods, and may ultimately lead to improved diagnosis and management of neurological disease including stroke and tumor.
2. Background and Significance
2.1.
Clinical need for oxygenation imaging
The healthy brain receives 15% of cardiac output and consumes 20% of total oxygen used by the body under normal conditions (Gallagher et al., 1998; Magistretti and Pellerin, 1999). Continuous oxygen delivery to neural tissue is necessary to maintain normal brain function and viability. Consequently, oxygen extraction fraction (OEF) and the cerebral metabolic rate of oxygen consumption (CMRO2) are important indicators of tissue health in the brain. Noninvasive imaging of brain oxygenation would provide new metabolic biomarkers to study cerebral physiology at rest and during functional activity (Davis et al., 1998; Ito et al., 2005a). Oxygenation imaging can also inform pathophysiological models and target therapies in brain disorders with aberrant regional oxygenation, such as stroke (Geisler et al., 2006) and tumor (Elas et al., 2003); as well as in neurodegenerative disorders with more subtle metabolic changes, such as Alzheimer's disease (Hock et al., 1997) and multiple sclerosis (Ge et al., 2012).
2.2.1. Acute ischemic stroke and oxygenation imaging
Stroke is a common disorder and a major cause of death worldwide, leading to over 140,000 deaths each year in the United States alone. Currently, intravenous tissue plasminogen activator (tPA) is the only medication approved by the Federal Drug Administration to treat acute ischemic stroke patients. Because improved outcomes have only been demonstrated within 4.5 hours of symptom onset (Hacke et al., 2008), tPA treatment is limited to a mere 3.4 - 5.2% of stroke patients (Adeoye et al., 2011). The effectiveness of delayed intervention beyond the 4.5-hour time window depends on accurate identification of potentially recoverable tissue. The therapeutic window likely varies between individuals depending on vascular anatomy, collateral flow patterns, and comorbidities. Therefore, distinguishing the penumbra (Astrup et al., 1981; Heiss and Graf, 1994; Hossmann, 1994) - under-perfused tissue with functional impairment
("misery perfusion") but maintained structural integrity - from irreversibly infarcted tissue per patient is essential.
150 PET imaging has shown that early disturbances in blood flow and energy metabolism
during acute stroke inform the physiological state of affected tissue (Baron et al., 1981). Simultaneous decreases in flow and oxygen consumption below threshold values indicate
permanent infarction, while flow decreases with preserved oxygen consumption indicate penumbric tissue with a potential for recovery (Baron et al., 1981; Sobesky et al., 2005). PET and MRI studies have also revealed minimum thresholds for oxygen metabolism (65 pmol/100g/min) and flow (20 ml/100g/min) that are needed to maintain tissue morphology (Takasawa et al., 2008; Zaro-Weber et al., 2010a, b). These threshold values successfully delineated necrotic versus potentially salvageable tissue in the infarct (Dani et al., 2011; Hakim et al., 1987; Heiss et al., 2000; Wise et al., 1983). Absolute measurements of regional oxygen consumption in the brain are thus important to identify the presence of viable tissue to determine whether the patient is a good candidate for stroke therapy.
Although 150 PET can reliably identify penumbric tissue, its clinical use is limited by the complexity, invasiveness, and radiation exposure of the methods (Heiss and Sobesky, 2008). Previous 150 PET oxygenation studies in stroke have either used a continuous gas inhalation
approach (Baron et al., 1981; Kuwabara et al., 1998), which requires a complex gas delivery system, or bolus administration of H2
150 and 1502 (Gibbs et al., 1984; lbaraki et al., 2004;
Sobesky et al., 2005). Each approach requires complex setup for sequential delivery of radiotracers, and arterial blood sampling to determine an arterial input function for quantitative measurements (Baron et al., 1989; Frackowiak et al., 1980; Herscovitch et al., 1985; Jones et al., 1976; Mintun et al., 1984). Furthermore, because 150 markers have a half-life of only two
minutes, the PET scanner must be located near a cyclotron which creates the radiotracers. These obstacles to 150 PET imaging have led to use of surrogate markers via other
modalities, including MRI, to identify penumbra in clinical practice.
In the past two decades, the mismatch between diffusion weighted imaging (DWI) and perfusion-weighted imaging (PWI) has been widely used as a surrogate MRI biomarker to identify the ischemic penumbra (Davalos et al., 2004; Rother et al., 2002; Schellinger et al., 2003; Warach et al., 2012). DWI detects the irreversible infarct lesion area, while PWI detects tissue with reduced perfusion. It has been suggested that the penumbra can be determined from the diffusion-perfusion mismatch region (Albers et al., 2006; Kidwell et al., 2003;
Neumann-Haefelin et al., 1999). Several clinical trials for desmoteplase, a new thrombolytic agent, in fact selected patients based on pre-randomized penumbral imaging with this mismatch method (Furlan et al., 2006; Hacke et al., 2005; Hacke et al., 2009). However, several assumptions of the DWI-PWI approach have recently been challenged. For instance, the initial diffusion lesion may not consist only of permanently damaged tissue because the lesion can be reversed if blood flow is restored early in the stroke (Chalela et al., 2004; Kidwell et al., 2000; Parsons et al., 2002). Distinguishing true penumbra from oligemia (tissue with flow defects but low risk of tissue damage) is also difficult, as PWI tends to overestimate the volume of tissue at risk (Parsons et al., 2001). For these reasons, current DWI-PWI standards do not predict the penumbra as accurately as 150 PET (Kajimoto et al., 2003; Kidwell et al., 2004; Sobesky et al., 2005), and on average overestimate the penumbric volume by 66% (Sobesky et al., 2005). Underlying challenges of DWI-PWI include the lack of quantitation from surrogate MRI markers for oxygenation.
As an alternative to DWI-PWI, extravascular measurements of relaxation parameters in brain tissue via MRI have been proposed to assess oxygenation in stroke. Because of its sensitivity to changes of deoxyhemoglobin (dHb) concentration in tissue, known as the blood-oxygenation level dependent (BOLD) effect, T2* relaxation is thought to closely reflect the
metabolic state of tissue (Bandettini et al., 1994; Boxerman et al., 1995). Elevated OEF in tissue corresponds to higher dHb concentration and lower T2*. This information could help distinguish
metabolically active and inactive tissues within hypoperfused brain regions. T2* hypointensities
in the affected hemisphere, consistent with elevated OEF, have been observed in the animal models (De Crespigny et al., 1992; Roussel et al., 1995) and in small case studies of patients with acute stroke (Morita et al., 2008; Tamura et al., 2002; Wardlaw and von Heijne, 2006). However, T2* signal did not correlate with gold-standard OEF measurements derived from PET
(Donswijk et al., 2009). This discrepancy may be due to background field inhomogeneities that lead to underestimation of T2* relaxation in focal regions not related to misery perfusion.
Furthermore, separating oxygenation-related T2* signal from T2 relaxation changes due to
cerebral blood volume (CBV), vasogenic edema, or inflammation is challenging (Grohn et al., 1998). As a result, preliminary T2* imaging in patients has not provided clear conclusions
about the time course and spatial extent of oxygenation changes in stroke evolution.
Improvements to the relaxation approach have been proposed to better identify the penumbra. For instance, T2' relaxation (1/T 2* = 1/T2 + 1/T2') is more directly related to dHb
1998). Geisler et al. found the lowest T2' (lowest OEF) in the irreversible diffusion lesion and
highest T2' (highest OEF) in the penumbral tissue (Geisler et al., 2006). T2' has also been used
to predict infarct growth to select patients for thrombolytic treatment (Siemonsen et al., 2008). However, T2' measurement are not immune to artifacts due to field inhomogeneities, and can
increase in all ischemic regions, making it difficult to distinguish between the core, penumbra, and oligemia based on T2' alone (Zhang et al., 2011). To overcome background susceptibility as a potential confounder, other groups have instead measured changes in T2* or T2' during a
100% oxygen challenge (OC) to the patient. During OC, higher signal change is expected in the penumbra because of its higher baseline concentration of dHb (high OEF). This trend was experimentally observed in rat models (Santosh et al., 2008). In a clinical trial of 35 patients with stroke, however, there was large variability in T2* OC responses across patients, and poor
spatial correspondence between regions with high OC responses and the DWI-PWI mismatch (Dani et al., 2010). This finding is not surprising, given the intrinsic differences in physiology between patients and additional variability in CBV, reperfusion status, and T1 relaxation due to
dissolved 02 in blood that confound the interpretation of the OC signal.
Recent studies have applied an advanced oxygenation MRI method, termed quantitative BOLD (qBOLD), in the stroke setting. This approach incorporates a biophysical model of T2*
spin dephasing to extract absolute oxygenation values per voxel (An and Lin, 2000; Yablonskiy and Haacke, 1994). Rat studies applying qBOLD have revealed that absolute oxygenation is lower in areas of final infarction and decreased over time within this region (An et al., 2009; Lee et al., 2003). This observation is consistent with metabolically active penumbra that evolves into the infracted core over time. Furthermore, in a prospective clinical study of 40 patients, thresholds based on qBOLD maps outperformed DWI-PWI imaging in predicting ischemia (An et al., 2013; Lee et al., 2013; Lin et al., 2013). Despite these promising results, the accuracy of qBOLD inherently depends on reliable T2* measurements. Consequently, qBOLD is still
sensitive to artifacts due to magnetic field inhomogeneities and edema-related changes in T2
signal, as in other relaxation methods. In practice, qBOLD also requires complex data analysis that is sensitive to noise and imaging artifacts. This initial literature reveals the utility of quantitative MRI for stroke evaluation, but also highlights the need for technical developments for robust, reliable oxygenation imaging to replace DWI-PWI identification of penumbra.
2.2.2. Brain cancer and tumor hypoxia imaging
Malignant brain cancer is a common disorder affecting 7.3 out of every 100,000 people in the United States, and leading to over 13,700 deaths each year nationwide. The presence of hypoxia, or reduced oxygenation levels, in tumor tissue is known to affect the outcome of cancer treatment with radiation (Churchill-Davidson et al., 1957; Deschner and Gray, 1959; Gray et al., 1953; Warburg, 1956) and chemotherapy (Teicher, 1994; Teicher et al., 1990). Oxygenated tumors are more sensitive to radiation-induced DNA damage during radiotherapy (Deschner and Gray, 1959; Gray et al., 1953; Rockwell et al., 2009), so that the treatment is more effective. As such, identification of tumor hypoxia has prognostic value for patient survival (Brizel et al., 1999; Dunst et al., 2003; Nordsmark et al., 2005; Rudat et al., 2001) and local disease control of head and neck tumors (Brizel et al., 1999; Nordsmark and Overgaard, 2004). In addition, new treatments have been proposed to re-sensitize cancerous tissue to radiotherapy with concurrent delivery of gases with high oxygen content (Brown and Wilson, 2004; Rischin et al., 2010; von Pawel et al., 2000), or to interfere with downstream molecular processes induced by hypoxia in the tumor (Kung et al., 2000). For these reasons, a technique to image brain hypoxia is of considerable clinical interest to monitor cancer therapies and detect tumor recurrence (Tatum et al., 2006; Vaupel and Mayer, 2007).
The first direct observation of hypoxia in tumors were based on polarographic measurements of the partial pressure of oxygen (pO2) made with microelectrodes in tissue (Braun et al., 2001; Vaupel et al., 2007; Young et al., 1996). Due to the invasive nature of this technique, polarographic information is limited to superficial tumors and cannot be applied in the clinic. The procedure could also alter the microenvironment in the tumor, leading to inaccurate readings of oxygen concentration. As a result, practical biomarkers to characterize the oxygenation status (Evans and Koch, 2003) and oxygenation heterogeneity within tumors (Menon and Fraker, 2005) are currently unavailable.
To fulfill this need, novel PET tracers have been developed to noninvasively assess hypoxia in tumors. Such hypoxia tracers include the metabolic compound [18F]-fluoromisonidazole ('1
F-MISO) (Krohn et al., 2008; Kubota et al., 1999; Lee and Scott, 2007; Rasey et al., 2000) and the metallic complex 60 64Cu-ATSM (Dearling et al., 1998; Fujibayashi et al., 1997; Lewis et al., 1999). The tracers undergo an intracellular metabolic reaction that directly depends on the level of tissue hypoxia. This process enables identification of hypoxic tissue that comports well with microelectrode PO2 measurements (Gagel et al., 2007; Lawrentschuk et al., 2005). Hypoxia
brain (Hino-Shishikura et al., 2014; Hirata et al., 2012; Tateishi et al., 2013); and has prognostic value in predicting response to radiation therapy (Hicks et al., 2005; Rajendran et al., 2006; Rischin et al., 2006; Thorwarth et al., 2006).
However, PET imaging with hypoxia markers has not been widely adopted in clinical use due to critical limitations, which make it difficult to selectively assess oxygen metabolism in tumors (Mees et al., 2009). These limitations include slow tracer accumulation in tumors, and nonspecific tracer binding, and incomplete understanding of measurement reproducibility. For instance, a recent 18F-MISO reproducibility study in 20 head and neck cancer patients found
substantial variability in spatial uptake of the tracer between scan sessions (Nehmeh et al., 2008). Relative to histological measures, different analysis methods for 18F-MISO PET can also
lead to different interpretations of the presence of tumor hypoxia (Shi et al., 2012). More work is thus necessary before single time-point PET images can be safely used to guide hypoxia-targeted radiotherapy. A small number of 150 PET studies have also attempted to directly quantify cerebral rate of oxygen metabolism (CMRO2) in cancerous tissue (Beaney et al., 1985; Ito et al., 1982; Lammertsma et al., 1983; Leenders, 1994; Rhodes et al., 1983). Although this early work demonstrated in vivo feasibility to detect baseline oxygen metabolic dysfunction in tumor (Leenders, 1994; Rhodes et al., 1983), "0 PET is also not widely used due to the complex experimental setup and short half-life of the tracers. These obstacles represent an unmet need for reliable oxygenation imaging in tumors to monitor outcomes of cancer therapy.
As an alternative to PET imaging, oxygen-sensitive MRI is attractive because it avoids the need for an exogenous tracer to detect hypoxia. The feasibility of BOLD and tissue oxygen level dependent (TOLD) MRI, a distinct oxygenation contrast based on T1 relaxation (O'Connor et al.,
2009a), have been demonstrated in patients with tumor. The appearance of tumor on these MRI contrasts were investigated at baseline (Jiang et al., 2013; O'Connor et al., 2009b); and during hyperoxic gas challenges (Alonzi et al., 2009; Jerome et al., 2014; Rijpkema et al., 2002; Taylor et al., 2001). However, initial MRI studies in animal models and in patients have reported conflicting findings. Some groups observed strong associations between T2* and independent measurements of PO2 (Elas et al., 2003; Hoskin et al., 2007; McPhail and Robinson, 2010; Punwani et al., 1998); and support the prognostic value of T2* MRI in tumor (Rodrigues et al., 2004). On the other hand, other groups found no obvious link between T2* and known metrics of tumor physiology (Baudelet and Gallez, 2002; Chopra et al., 2009; Christen et al., 2012b). This debate in the literature speaks to the challenge in interpreting relative BOLD and TOLD signals,
and has motivated the simultaneous use of multiple MRI contrasts to assess tumor oxygenation status (Burrell et al., 2013; Hallac et al., 2013; Remmele et al., 2013).
To directly measure tissue oxygenation, our collaborators adopted a calibrated BOLD MRI technique to quantify absolute changes in CMRO2 during hyperoxia gas challenge in patients with glioblastoma (Chiarelli et al., 2007c; Davis et al., 1998). Kim et al. found that during breathing of 100% 02, absolute CMRO2 increased in cancerous tissue but not in healthy gray
matter (Kim et al., 2011 b), which was consistent with observations from 18F-MISO PET (Kim et
al., 2011 a). The results indicate preserved oxygen metabolic machinery in tumors that can potentially be manipulated with therapy (Kim et al., 2011b). At the same time, baseline measurements of OEF or CMRO2 have not been shown in tumors by MRI, and could solidify interpretations of the calibrated BOLD results from Kim et al. This initial work reveals that quantitative MRI is promising for tumor evaluation, and motivates technical developments to improve in vivo oxygenation imaging in tumors.
2.2.3. Metabolic changes in neurodegenerative diseases and normal aging
In contrast to stroke and tumor, in which the oxygen supply to the brain is acutely disturbed, many neurodegenerative disorders exhibit subtle dysfunction in oxygen consumption. Reproducible, quantitative imaging is necessary to detect these subtle metabolic changes, and may offer new biomarkers to detect early brain pathophysiology and evaluate novel pharmacological treatments for these diseases. For example, Alzheimer's disease (AD) has growing incidence and socioeconomic impact in our aging population, but is difficult to detect in its early stages. Although new treatment strategies aim to slow or prevent neuronal death in AD, there are no established imaging markers to diagnose the disorder or reliably monitor drug interventions (Mueller et al., 2005). As a result, AD is typically treated in later stages of dementia such that drug therapy offers only small benefits.
To date, several studies have observed differences in brain oxygenation attributed to AD. Hock et al. used near-infrared spectroscopy (NIRS) to non-invasively study changes in cerebral hemoglobin oxygenation in the frontal and parietal cortex during performance a verbal fluency task in patients compared to age-matched controls (Hock et al., 1997). In patients, NIRS revealed a marked reduction of regional CBF and cerebral hemoglobin oxygenation during activation in the parietal cortex, most likely driven by degenerating brain areas. This finding is consistent with 150 PET measurements of decreased relative CBF and CMRO2in the frontal,
parietal, and temporal cortex in patients with senile dementia of Alzheimer's type (Tohgi et al., 1998). In addition, the hemodynamic control of cortical oxygenation (measured by NIRS) relative to cerebral blood flow velocity (measured by transcranial Doppler) was different in patients with mild to moderate AD relative to healthy controls, suggestive of disease-related disruptions to the cerebral microvasculature (van Beek et al., 2012). These changes are most apparent in high-risk individuals, i.e. those with at least one copy of the apolipoprotien E F4 (APOE4) gene. For instance, a recent MRI study found that individuals with increased risk for AD have elevated resting CBF in the medial temporal lobe (Fleisher et al., 2009). However, the subsequent interpretation of the BOLD signal trends observed in high-risk populations and in rat models remains challenging (Sanganahalli et al., 2013).
If a new, robust metabolic marker is developed, scientists would be able to characterize AD through longitudinal observation of subtle oxygenation changes across patient populations. In its own right, OEF measurements in AD may predict early cognitive impairment before the onset of anatomical brain changes (Yamauchi et al., 1994). Clinicians could also begin to tease apart whether hemodynamic disruptions are a cause or consequence of neuronal dysfunction and structural changes in neurodegeneration, including amyloid-P plaque deposition typical in AD disease (Vlassenko et al., 2010). Additional morphological alterations in cerebral capillaries (Farkas and Luiten, 2001) and infarct-like lesions in white matter have been described by pathological studies (Brun and Englund, 1986); but their relationship to other pathophysiology is not well studied. This includes dysfunction along other metabolic pathways including glucose utilization, which is also common in AD (Adriaanse et al., 2014; Desgranges et al., 1998; Friedland et al., 1985). Improved understanding of this pathology would lead to earlier diagnosis of AD and the potential for better clinical outcomes with early intervention. Longitudinal investigations in other neurodegenerative disorders; including Huntington's disease (Cepeda-Prado et al., 2012; Leenders et al., 1986), Parkinson's disease (Beal, 2003; Karimi et al., 2008), and multiple sclerosis (Ge et al., 2012); would similarly benefit from technical advances in oxygenation imaging.
To apply oxygenation biomarkers in cases of neurodegenerative disorders, it is important to distinguish disease-related metabolic changes from those that occur in healthy aging. For decades, hemodynamic changes in the brain have been known to accompany normal aging based on the studies by Kety and Schmidt (Kety, 1956). The original work of Kety and Schmidt found global declines in CBF and CMRO2, as well as an increase of OEF with age by the nitrous oxide technique. Developments in 150 PET imaging later made it possible to study subdivisions
in the brain, revealing regional decreases both of CBF (Borghammer et al., 2008; Leenders et al., 1990; Lenzi et al., 1981; Pantano et al., 1984); and of CMRO2 in aging populations (Eustache et al., 1995; Ibaraki et al., 2010; Marchal et al., 1992; Takada et al., 1992; Yamaguchi et al., 1986). In contrast, other authors found no changes or equivocal results for CBF and CMRO2 (Burns and Tyrrell, 1992; Meltzer et al., 2000; Pantano et al., 1984), and only one PET study has replicated the increase of OEF with age first reported by Kety and Schmidt (Leenders et al., 1990). Given these contradictory results, it remains unclear how the underlying neuronal metabolic demand and the coupling between oxygen usage and CBF evolve with healthy aging. The inconsistencies between studies may partially derive from poor spatial resolution (-16mm isotropic resolution) in early PET imaging, such that signals from white matter, cortex, and cerebrospinal fluid (CSF) cannot be resolved. These limitations prompted Aanerud et al. to re-analyze regional metabolic measurements with information from several recent studies (Aanerud et al., 2012). However, much work remains to be done to distinguish the effects of aging and inter-individual variability on these biomarkers. MRI measurements of oxygenation would facilitate prospective, longitudinal designs in future studies of aging populations.
2.3. Quantitative MRI of Oxygenation
Although there is a great unmet clinical need for robust and reliable imaging of brain oxygen utilization, this measurement is technically challenging in vivo. Many early studies of oxygenation disturbance in brain disease and during healthy aging relied on PET imaging, either by 150 tracers or hypoxia tracers such as 18F-MISO. PET remains the gold standard for
quantitative measurements of cerebral physiology, but has relatively poor spatial resolution compared to other, more accessible modalities such as MRI. Furthermore, PET imaging requires the use of ionizing radiation, such that repeated use to monitor patients during the course of treatment is limited. In particular, 150 PET requires complex setup to image short
half-life tracers, and radiologists are unable to evaluate oxygenation in current medical routines. MRI is also sensitive to the oxygenation-dependent effects of deoxyhemoglobin (dHb) on tissue relaxation and intravascular phase signal. Hemoglobin is the predominant molecular carrier of oxygen in the arterial blood supply, and in its deoxygenated state has a paramagnetic effect which perturbs the local magnetic field (Pauling and Coryell, 1936). At high and medium magnetic fields, the transverse relaxation rates T2 and T2* of water protons in blood are largely determined by the oxygenation state of the hemoglobin, i.e. oxygen saturation (Atalay et al.,
1995; Silvennoinen et al., 2003; Thulborn et al., 1982). Due to this effect, T2*- and T2- weighted MRI provide well-known blood-oxygen level dependent (BOLD) contrast, which has pervaded the field of cognitive neuroscience for use in functional neuroimaging investigations (Bandettini et al., 1997; Kwong et al., 1992; Ogawa et al., 1990). Functional MRI (fMRI) with BOLD contrast is noninvasive and detects hemodynamic changes due to functional activity with high temporal and spatial resolution.
However, the BOLD signal has limited specificity to brain function because the relationship between T2* and blood oxygenation is confounded by macroscopic field inhomogeneities, water diffusion, and the geometry and orientation of the underlying blood vessel network. Furthermore, exact models that relate BOLD to underlying physiological parameters, including OEF and CMRO2, are complex at best. In fact, individuals with smaller baseline oxygenation tend to have smaller BOLD signal. Lu et al. characterized inter-subject variability in BOLD and found that every 10% difference in baseline oxygenation across individuals led to 0.4% and -30.0% variation in BOLD and CBF signal (Lu et al., 2008). Consequently, interpretations of neural activity and brain oxygen utilization based on BOLD alone are rarely quantitative and can be misleading (Christen et al., 2012b).
New approaches using MRI have been developed to exploit the effects of dHb for measurement of absolute blood oxygenation. These techniques fall into three categories - (1) calibration of the T2*-weighted magnitude (BOLD) signal to quantify changes in CMRO2 during
functional activity; (2) measurement of T2 relaxation in isolated venous blood from tissue or in
large vessels; and (3) measurement from blood susceptibility on MRI phase images to quantify oxygen saturation in cerebral veins.
2.3.1. Calibrated BOLD measurements of oxygenation during functional activity Calibrated BOLD MRI is a set of techniques to measure relative changes in CMRO2 from the BOLD and CBF signal during a functional task. During functional activation, CMRO2 in brain tissue increases to meet the increased energy demand of activated neurons. Calibrated BOLD approaches model the resulting extravascular BOLD signal as a function of relative change in CMRO2 (Davis et al., 1998; Hoge et al., 1999). Use of this model requires estimation of the "M" calibration parameter, which corresponds to the maximum achievable BOLD fMRI signal change. The "M" parameter is typically measured through a gas challenge, most commonly hypercapnia, in which the CO2content of the blood is increased.
During hypercapnia, it is assumed that CBF is measurably increased but that CMRO2
remains constant, thereby providing ideal conditions from which to estimate "M". Hypercapnic calibration of the BOLD signal has been explored via (a) breathing of C0 2-enriched air (Chiarelli et al., 2007b; Kim et al., 1999; Stefanovic et al., 2004); (b) use of simple breath-hold tasks to create hypercapnic stress (Kastrup et al., 1999a; Thomason et al., 2007); or (c) use of a carbogen gas mixture with elevated C02 and 02 but without any nitrogen (Gauthier and Hoge, 2013; Gauthier et al., 2011; Macey et al., 2003; Vesely et al., 2001). In a study of visual activation in 10 healthy subjects, calibrated BOLD measurements were stable across days from the same individual, with a low coefficient of variation (COV) = 7.4% (Leontiev and Buxton, 2007). On the other hand, comparisons between different "M" calculation methods resulted in different methodological recommendations. One investigation found that hypercapnia and breath-hold challenges performed equally well to estimate "M" (Kastrup et al., 2001), while others reported that mild hypercapnia provided the most robust calibration (Bulte et al., 2009). Other studies explored the use of hyperoxic gas (increased 02 content) for calibration to achieve increased signal-to-noise ratio (SNR) (Chiarelli et al., 2007c; Goodwin et al., 2009; Mark et al., 2011); but this approach may not be robust to different baseline hematocrit and OEF levels (Blockley et al., 2012).
Calibrated BOLD techniques suffer from several limitations that prevent their use in the clinic. (1) The techniques do not offer absolute quantification of oxygen usage in the brain and instead only measure relative changes in CMRO2 during a functional task. (2) To estimate CMRO2 changes in this manner, a separate gas calibration experiment is necessary, throughout
which oxygen consumption in the brain is presumably constant. This isometabolic assumption has been called into question, as some reports suggest a CMRO2 increase (Horvath et al., 1994; Martin et al., 2006; Yang and Krasney, 1995) or CMRO2 decrease during hypercapnia (Bolar et al., 2010; Xu et al., 2011; Zappe et al., 2008). (3) Furthermore, in the calibrated fMRI model, changes in cerebral blood volume (CBV) are inferred from MRI perfusion measurements via the flow-volume parameter a (Griffeth and Buxton, 2011). Literature values for a range between 0.29 and 0.64 (Ito et al., 2003; Rostrup et al., 2005); and vary across different brain regions (Mark and Pike, 2012), and between males and females (Ciris et al., 2013). Although a direct measurement of CBV would improve the accuracy of calibrated BOLD, in vivo imaging of CBV is in itself challenging. (4) Finally, there is evidence that the "M" parameter varies between cortical and subcortical regions (Ances et al., 2008); as well as between different cortical areas (Chiarelli et al., 2007a). For this reason, assumption of a constant value for "M" across the brain
may lead to errors in the calibrated BOLD model (Lin et al., 2008). Because of these potential confounders, different calibrated fMRI approaches may be optimal in various settings, such that widespread use of the technique is challenging.
To address some of the limitations of calibrated BOLD, alternative methods to analyze the BOLD signal have recently been proposed. Separate groups have independently demonstrated mapping of baseline, absolute OEF in human volunteers through use of a pair of respiratory challenges (Gauthier and Hoge, 2012; Germuska and Bulte, 2014). These OEF maps can be incorporated into the calibrated BOLD model to create a comprehensive mapping of vascular and metabolic biomarkers (Gauthier et al., 2012). The use of multiple gas modulations, however, may be prohibitive in clinical settings.
Separately, other groups proposed a quantitative BOLD (qBOLD) approach to map OEF, through modeling the extravascular BOLD signal in each voxel in the presence of dHb (An and Lin, 2000; He and Yablonskiy, 2007). This signal model has been tested in physical phantoms (Pannetier et al., 2013; Sohlin and Schad, 2011), and agreed well with blood oxygenation levels in venous blood drawn from the superior sagittal sinus in vivo of rats (He et al., 2008). In addition, the qBOLD approach has been applied in humans to image brain oxygenation during breathing of carbogen (An et al., 2012), and to perform oximetry in skeletal muscle (Zheng et al., 2014). Although qBOLD can provide estimates of OEF maps in vivo, it relies heavily on a complex signal model that is difficult to implement in practice. More work to investigate geometry of the vessel network assumed in this model (Christen et al., 2012d) and to improve the accuracy of OEF maps with additional information from MRI flow scans (Christen et al., 2012c), are necessary before qBOLD can be broadly adopted.
2.3.2. Intravascular T2 relaxation measurements of oxygenation
A distinct class of MRI methods for oxygenation imaging measures T2 relaxation from
intravascular signal. T2 relaxation in blood is influenced by the presence of dHb, and relates to
the underlying blood oxygenation level through a theoretical model (Oja et al., 1999; van ZijI et al., 1998) that has been confirmed empirically in vitro (Krishnamurthy et al., 2013b; Silvennoinen et al., 2003; Wright et al., 1991; Zhao et al., 2007).
T2-based oxygenation imaging enjoys high temporal resolution and to date is the most commonly employed approach for absolute quantification of OEF. The most utilized of these methods is T2-Relaxation-Under-Spin-Tagging (TRUST), which applies a magnetic spin labeling
scheme to isolate pure blood signal in the superior sagittal sinus. Since its recent introduction into the field (Lu and Ge, 2008), TRUST MRI has been validated against pulse oximetry for arterial blood signal (Lu et al., 2012), and has been optimized to provide fast, reproducible measurements of global venous oxygenation, in a scan time of 1 minute 12 seconds (Liu et al., 2013; Xu et al., 2012). Because of its short acquisition time and reliability, TRUST is suitable for clinical use even in the most challenging applications (Liu et al., 2014).
The main obstacle to T2-based oxygenation imaging is the isolation of venous blood signal for T2 measurements. Previous studies primarily focus on blood signal from large vessels
identified by visual inspection, for which partial volume effects with surrounding tissue are minimal and there is sufficient SNR to robustly estimate robust T2 relaxation. Example vessels
include large draining veins, such as the superior sagittal sinus (Jain et al., 2012c; Lu and Ge, 2008) and the jugular veins of the neck (Qin et al., 2011); as well as medium-sized vessels in the visual cortex identified via a fMRI activation task (Golay et al., 2001). Most T2-based
oxygenation imaging studies to date trade off the ability to spatially resolve OEF values in the brain for clinically feasible scan times. As such, these methods (including TRUST) only provide global OEF values and cannot localize regional aberrations of oxygen metabolism in stroke and tumor. In response, Krishnamurthy et al. proposed a T2-based method that applies bipolar gradients sensitive to flow velocity to isolate blood in smaller veins (Krishnamurthy et al., 2013a). The work adopted fast echo-planar-imaging MRI to achieve a sagittal section with-in-plane resolution of 0.72 x 2.41mm2, in a scan time of 7 minutes. This spatial resolution enables
OEF measurement in smaller pial veins with diameter as small as -2mm, and is a promising extension of T2-based oxygenation imaging.
More sophisticated methodology to map OEF from T2 has been proposed by our group and
independently replicated. This novel approach, termed quantitative imaging of extraction of oxygen and tissue consumption (QUIXOTIC), takes advantage of velocity-selective spin labeling to isolate MR signal from postcapillary venular blood on a voxel-by-voxel basis (Bolar et al., 2011). Not only is QUIXOTIC the first T2-based MRI approach to map OEF in cerebral tissue, but in theory enables the user to designate the microvascular compartment from which oxygenation values are derived. Guo et al. proposed a variation of the method, called velocity-selective excitation with arterial nulling (VSEAN), to mitigate contamination of the venous blood signal by CSF contributions and eddy current effects (Guo et al., 2014; Guo and Wong, 2012). Despite the elegance of these methods, QUIXOTIC and VSEAN are inherently plagued by low SNR because its OEF values derive from parenchyma with less than 5% blood by volume (Ito et
al., 2005b). Thus, regional mapping of absolute OEF with spin-tagging approaches remain difficult without prohibitively long scan times to achieve adequate SNR, or relatively poor spatial resolution.
2.3.3. Susceptibility weighted imaging of oxygenation
Although not usually exploited, MRI phase signal provides excellent tissue contrast in the brain, due to local field variations from paramagnetic substances such as dHb, myelin, and iron (Duyn et al., 2007; Shmueli et al., 2009b). In the context of oxygenation imaging, MRI phase allows for quantification of OEF in individual veins from the magnetic susceptibility shift between vessels and brain tissue. This susceptibility shift is modulated by the presence of paramagnetic dHb molecules, and directly relates to the oxygenation level of the vein (Weisskoff and Kiihne, 1992b). Susceptibility differences then lead to small field perturbations that ultimately manifest as phase contrast from standard gradient echo scans.
In susceptibility-weighted imaging (SWI), gradient echo magnitude images are modulated by a phase mask to enhance the contrast between tissues with different magnetic susceptibilities (Haacke et al., 2004; Rauscher et al., 2005b; Reichenbach and Haacke, 2001). Because of its phase contrast, cerebral veins are highly visible as dark structures on SWI images (Cho et al., 1992) and change their appearance in different oxygenation states (Rauscher et al., 2005a). This vessel contrast, especially in small veins, improves at high field because of (1) increased SNR to achieve higher spatial resolution; and (2) increased susceptibility differences such that suitable contrast is achieved at shorter echo times (Deistung et al., 2008; Koopmans et al., 2008; Rauscher et al., 2008). The main benefit of SWI contrast is its simple and robust acquisition, since the gradient echo sequence is already available on most clinical scanners. For this reason, SWI has found clinical use in detection of cerebral microbleeds in traumatic brain injury (Hammond et al., 2009a) and even in fetal imaging (Neelavalli et al., 2014).
In addition to venous contrast, phase images have been analyzed to quantify absolute OEF in cerebral veins. By modeling each vessel as a long cylinder approximately parallel to the main magnetic field, there is a simple relationship between the measured phase difference between blood and brain tissue to the underlying oxygenation in the vein (Fernandez-Seara et al., 2006; Weisskoff and Kiihne, 1992b). This approach, known as MR susceptometry, is easy to implement and provides simple calibration of susceptibility differences to absolute OEF via