HAL Id: hal-00297696
https://hal.archives-ouvertes.fr/hal-00297696
Submitted on 14 May 2008
HAL is a multi-disciplinary open access
archive for the deposit and dissemination of
sci-entific research documents, whether they are
pub-lished or not. The documents may come from
teaching and research institutions in France or
abroad, or from public or private research centers.
L’archive ouverte pluridisciplinaire HAL, est
destinée au dépôt et à la diffusion de documents
scientifiques de niveau recherche, publiés ou non,
émanant des établissements d’enseignement et de
recherche français ou étrangers, des laboratoires
publics ou privés.
respiration and leaves in Amazonian forest
A. C. de Araújo, J. P. H. B. Ometto, A. J. Dolman, B. Kruijt, M. J.
Waterloo, J. R. Ehleringer
To cite this version:
A. C. de Araújo, J. P. H. B. Ometto, A. J. Dolman, B. Kruijt, M. J. Waterloo, et al.. Implications
of CO2 pooling on ?13C of ecosystem respiration and leaves in Amazonian forest. Biogeosciences,
European Geosciences Union, 2008, 5 (3), pp.779-795. �hal-00297696�
www.biogeosciences.net/5/779/2008/
© Author(s) 2008. This work is distributed under the Creative Commons Attribution 3.0 License.
Biogeosciences
Implications of CO
2
pooling on δ
13
C of ecosystem respiration and
leaves in Amazonian forest
A. C. de Ara ´ujo1, J. P. H. B. Ometto2,5, A. J. Dolman1, B. Kruijt3, M. J. Waterloo1, and J. R. Ehleringer4
1Department of Hydrology and Geo-Environmental Sciences, Faculty of Earth and Life Sciences, Vrije Universiteit, De
Boelelaan 1085, 1081 HV, Amsterdam, The Netherlands
2Laborat´orio de Ecologia Isot´opia, Centro de Energia Nuclear na Agricultura, USP, Av. Centen´ario, 303, Piracicaba, SP, CEP
13416-190, Brazil
3Earth System Science-Climate Change, Centre for Water and Climate, Wageningen-UR, PO Box 47, 6700 AA, Wageningen,
The Netherlands
4Department of Biology, University of Utah, 257S 1400E, Salt Lake City, UT, 84112-0840, USA
5IGBP Regional Office/INPE, Av. dos Astronautas, 1.758 - Jd. Granja, S˜ao Jos´e dos Campos, SP, CEP 12227-010, Brazil
Received: 22 October 2007 – Published in Biogeosciences Discuss.: 29 November 2007 Revised: 17 April 2008 – Accepted: 17 April 2008 – Published: 14 May 2008
Abstract. The carbon isotope of a leaf (δ13Cleaf) is
gener-ally more negative in riparian zones than in areas with low soil moisture content or rainfall input. In Central Amazo-nia, the small-scale topography is composed of plateaus and valleys, with plateaus generally having a lower soil moisture status than the valley edges in the dry season. Yet in the dry season, the nocturnal accumulation of CO2is higher in the
valleys than on the plateaus. Samples of sunlit leaves and atmospheric air were collected along a topographical gradi-ent in the dry season to test whether the δ13Cleaf of sunlit
leaves and the carbon isotope ratio of ecosystem respired CO2 (δ13CReco) may be more negative in the valley than
those on the plateau.
The δ13Cleafwas significantly more negative in the valley
than on the plateau. Factors considered to be driving the ob-served variability in δ13Cleaf were: leaf nitrogen
concentra-tion, leaf mass per unit area (LMA), soil moisture availabil-ity, more negative carbon isotope ratio of atmospheric CO2
(δ13Ca) in the valleys during daytime hours, and leaf
dis-crimination (1leaf). The observed pattern of δ13Cleafmight
suggest that water-use efficiency (WUE) is higher on the plateaus than in the valleys. However, there was no full supporting evidence for this because it remains unclear how much of the difference in δ13Cleafwas driven by physiology
or δ13Ca. The δ13CRecowas more negative in the valleys than
on the plateaus on some nights, whereas in others it was not.
Correspondence to: A. C. de Ara´ujo
It is likely that lateral drainage of CO2enriched in13C from
upslope areas might have happened when the nights were less stable. Biotic factors such as soil CO2efflux (Rsoil) and the
responses of plants to environmental variables such as vapor pressure deficit (D) may also play a role. The preferential pooling of CO2in the low-lying areas of this landscape may
confound the interpretation of δ13Cleafand δ13CReco.
1 Introduction
The use of isotopic tracers in organic matter, water, and at-mospheric gases has emerged as a powerful tool that inte-grates biotic and physical processes over space and time, im-proving our understanding of plant physiology, biogeochem-istry, and ecosystem function (Pataki et al., 2003b; Pataki et al., 2007). The mean carbon isotope ratio of atmospheric CO2(δ13Ca) is currently –8‰ (Keeling et al., 2005a;
Keel-ing et al., 2005b). Plants utilizKeel-ing the C3photosynthetic
path-way (the majority of terrestrial plants) typically have values of δ13C that range from –21 to –35‰ (Pataki et al., 2007). An expression for discrimination in leaves (1leaf) of C3 plants
can be stated as follows 1leaf=a + (b − a)
ci
ca
(1) where a is the fractionation associated with diffusion (4.4‰), b is the net kinetic/enzymatic fractionation associ-ated with carboxylation (27‰), and ci and caare the
(Farquhar et al., 1982, 1989a, b). The 1leaf therefore is a
function of ci/caratio, which is sensitive to a variety of
fac-tors that influence the balance of stomatal conductance and assimilation rate, for example light and water availability (Pataki et al., 2003b).
The carbon isotope ratio of a leaf (δ13Cleaf) is a measure
that integrates the photosynthetic activity over the period of weeks to months during which the leaf tissue was synthe-sized (Ometto et al., 2002; Dawson et al., 2002; Ometto et al., 2006). In tropical forests, δ13Cleaf is strongly
cor-related with the height of the leaf within the canopy. Low δ13Cleaf(more negative) is observed in the understory
vegeta-tion, and high δ13Cleaf(less negative) is observed in the upper
canopy (Medina and Minchin, 1980; Medina, 1986; Med-ina et al., 1991; Vandermerwe and MedMed-ina, 1989; Sternberg, 1989; Zimmerman and Ehleringer, 1990; Broadmeadow, 1992; Buchmann et al., 1997; Guehl, 1998; Martinelli, 1998; Bonal, 2000; Ometto et al., 2002; Ometto et al., 2006). This trend in δ13Cleafthrough the canopy is related to the
reassim-ilation of respired CO2and differences in conditions such as
light and vapor pressure deficit through the canopy, resulting in changes in ci/caratios (Sternberg et al., 1989; Lloyd et al.,
1996; Sternberg et al., 1997; Buchmann et al., 1997; Ometto et al., 2002; Ometto et al., 2006).
The temporal and spatial variability of δ13Cleafin forested
landscapes and along environmental gradients has shown that δ13Cleaf is more negative in riparian zones or in areas
with high soil moisture content or rainfall input than in ar-eas with low soil moisture content or rainfall input (Medina and Minchin, 1980; Ehleringer et al., 1986; Ehleringer et al., 1987; Korner et al., 1988; Korner et al., 1991; Garten and Taylor, 1992; Marshall and Zhang, 1993; Stewart et al., 1995; Sparks and Ehleringer, 1997; Hanba et al., 2000; Bowling et al., 2002). Yet, plants growing in dry environments have shown lower 1leaf and higher water-use efficiency (WUE)
than those grown at low altitudes or in wet environments. In Central Amazonia, the small-scale topography is com-posed of plateaus and valleys. These give rise to a high variability of soil moisture contents (θ ) in the unsaturated zone, with plateaus generally having a lower θ than the valley edges in the dry season (J. S. de Souza, data not published). De Ara´ujo et al. (in press) made nocturnal measurements of caalong a topographical gradient at a site in Central
Amazo-nia. They showed that in the dry season, depending on the atmospheric stability, larger amounts of CO2were stored on
the slopes and in the valleys than on the plateaus of this un-dulating landscape. Lateral drainage of respired CO2
downs-lope and high soil CO2efflux (Rsoil) in the valleys were
con-sidered as possible causes for the observed variability in ca.
In addition, these authors observed that the CO2 stored in
the air in the valley took longer to be released than that on the plateau, and that ca in the valley did not decrease to the
same level as on the plateau at any time during the day. This leads to two hypotheses for dry season conditions. The first is that the δ13Cleafin the valleys may be more negative than
that on the plateaus due to both higher soil water availability and longer time of exposure to high cawith low δ13Ca. The
second is that the carbon isotope ratio of ecosystem respired CO2(δ13CReco) may be less negative on the plateaus than in
the valleys.
This study aims to investigate how δ13Cleafand δ13Cavary
in time and space along a topographical gradient at a site in Central Amazonia and analyses the biotic and physical fac-tors controlling the stable carbon isotope discrimination.
2 Site description
Measurements were made at the Manaus LBA site (2◦36′32′′S, 60◦12′33′′W, 45–110 m a.s.l. – above sea level), located in the Asu catchment in the Reserva Biol´ogica do Cuieiras. The forest belongs to the Instituto Nacional de Pesquisas da Amazˆonia (INPA). The exchange of CO2,
sen-sible and latent heat, momentum transfer, and meteorolog-ical variables have been measured almost continuously on two micrometeorological towers, installed in July 1999 and in May 2006, respectively. The first tower, known as K34 (Araujo et al., 2002), is on a medium sized plateau, whereas the second one, known as B34 (de Araujo et al. in prepara-tion1), is at the bottom of a U-shaped valley.
The mean air temperature was 26◦C between July 1999 and June 2000 (Araujo et al., 2002). Average annual rainfall is about 2400 mm, with a distinct dry season during July, Au-gust and September when there is less than 100 mm rainfall per month (Araujo et al., 2002).
There is very little large-scale variation in topography in the region, but at a smaller scale, the dense drainage network has formed a pattern of plateaus and valleys. The mean el-evation is about 100 m a.s.l. with about 40–60 m difference between plateaus and valleys bottoms. The soils along a typ-ical toposequence consist of well-drained Oxisols and Ulti-sols on plateaus and slopes, respectively, and poorly drained Spodosols in the valleys (Chauvel et al., 1987). From the plateau down to the valley, the soil (top 5 cm) clay fraction decreases (from about 75% to 5%) and the sand fraction in-creases (from about 10% to 85%) (Ferraz et al., 1998; Cham-bers et al., 2004; Souza, 2004; Luizao et al., 2004).
The vegetation is old-growth closed-canopy terra firme (non-flooded) forest. Variation in soil type, topography and drainage status has created distinct patterns in forest vege-tation composition. On the plateaus, well drained clay soils favor high biomass forests 35–40 m in height with emergent trees over 45 m tall: typical terra firme forest. Along the slopes, where a layer of sandy soil is deepening towards the valley bottom, forest biomass is lower and height is around 20–35 m with few emerging trees. In the valleys, the sandy soils are poorly drained and usually they remain waterlogged
1de Ara´ujo, A. C., Dolman, A. J.,Waterloo, M. J., Kruijt, B., et al.: Comparative measurements of CO2fluxes from a plateau and valley in Amazonian forest, in preparation, 2007.
during the rainy season, supporting low biomass and low tree height (20–35 m), with very few emerging trees. A distinct forest type, classified as Campinarana (as it resembles the
Campina forest that develops on white sand areas), also
oc-curs between the lower slope and valley bottom areas. This vegetation has lower biomass, tree diversity and tree height (15–25 m) (Guillaumet, 1987; Luiz˜ao et al., 2004). The forest canopy is stratified in four layers. The first layer is that formed by emergent trees, reaching heights of 35–45 m above ground level (a.g.l.). Below this layer, there are trees with their canopies between 20 and 35 m. The third layer is formed by understory regeneration, whereas shrubs and seedlings form a fourth layer close to the ground. More elaborate descriptions of the site can be found in Araujo et al. (2002), Chambers et al. (2004), Luizao et al. (2004) and Waterloo et al. (2006).
3 Material and methods
3.1 Air sampling collection and data conditioning
All sampling was carried out in representative plots along a transect that was divided into 3 topographical sections: plateau, slope and valley (see Fig. 1 in de Araujo et al., in press). In each plot, air samples were collected at different levels above and within the canopy for δ13Ca and ca
analy-sis. Each profile sampling system consisted of high-density polyethylene (HDPE) tubes (Dekoron 1300, 6.25 mm OD, non-buffering ethylene copolymer coating, USA) with in-takes at different heights. Nylon funnels with stainless steel filters were installed on the air intakes to avoid sample con-tamination by particles. A battery-operated air pump (Capex V2X, UK) was used to draw air through the tubing, a des-iccant tube containing magnesium perchlorate and a glass sample flask. The flow rate was 10 L min−1. The longest air sampling tube had an internal volume of about 0.65 L that corresponds to a maximum residence time of 4 s. All air sam-ples were collected in pre-evacuated 100 mL glass flasks that were closed with two high-vacuum Teflon stopcocks (34-5671, Kontes Glass Co., USA) after air had been pumped through the flask for about 3 minutes. The cawas measured
at the same time with an infrared gas analyzer (IRGA) (LI-800, LI-COR, Inc., USA). For this a “T” piece was connected at the air pump output, which allowed a low subsampling flow of about 800 mL min−1to be passed through the IRGA. Plateau air samples were collected at K34 tower (118 m a.s.l.) with a tube system attached to it. The slope profile system was suspended from the highest branch of a tall tree located about midway down the slope (89.2 m a.s.l.) at 550 m from the K34 tower, whereas the valley profile system, which was suspended in the same way as that on the slope, was installed in the valley (77.3 m a.s.l.) at about 850 m from the K34 tower (de Araujo et al., in press). This latter system had its highest intake at 11 m a.g.l. in 2002 (de Araujo et
al., in press) and was extended to reach up to 30 m a.g.l. in August 2004. In October 2006, the valley profile system was relocated 500 m to the west and attached to the newly erected B34 tower.
Nighttime sampling began about one hour after sunset (about 19:30 local time) and ended about one hour before sunrise (about 05:30 local time) to avoid any effects of pho-tosynthesis on the estimates of δ13CReco. In order to increase
statistical confidence in δ13CReco values, we aimed to
col-lected samples with a minimum ca difference of about 75
ppm between samples, which was set a priori as the mini-mum difference that shall be observed among the flasks sam-pled at each nighttime sampling (Pataki et al., 2003a; Lai et al., 2004; Lai et al., 2005). Daytime values of δ13Caand ca
within and above the canopy were obtained between 07:00 and 18:00 h. Due to both strong rainfall on 10 October and technical problems, the last sampling of atmospheric air dur-ing daytime hours occurred on 16 October at both plateau and valley.
The flasks were shipped to the Centro de Energia Nuclear na Agricultura (CENA) in S˜ao Paulo, Brazil, for stable iso-tope ratio and ca analyses. Details about the analytical
pro-cedures at CENA are given by Ometto et al. (2002). 3.2 Sampling of foliage and litter
In August 2004, leaf samples were collected once from trees at each topographical section by a tree climber, sampling a vertical profile through the forest canopy. The sampling heights were not uniform among the topographical sections, as follows: plateau (3, 10, 17, 21, 24, 26, and 30 m a.g.l.), slope (3, 8, 10, 12, 20, 26, 28, 30 m a.g.l.), and valley (3, 7, 20, 25 m a.g.l.). There was no botanical classification for the trees sampled in August 2004. In October 2006, sun leaves at the top of the canopy were collected once by a tree climber at plateau and valley sections. Trees with botanical classifi-cation to species level were now systematically selected ac-cording to either their importance value index (IVI) or occur-rence at both plateau and valley areas (Oliveira and Amaral, 2004; Oliveira and Amaral, 2005; I. L. do Amaral, personal communication). Each sample from a single tree consisted of at least five healthy leaves that were combined according to their status (either mature or young). In August 2004, lit-ter samples were randomly collected at each topographical section. These were bulked by topographic section to form single samples. The samples were pre-dried at ambient air temperature for 3 days in a home-made greenhouse located in an open-sky area and shipped to CENA for stable isotope ratio and elementary analyses.
3.3 Soil-respired CO2sampling
In August 2004, CO2 released from the soil was sampled
at each topographical section using the protocol described by Flanagan et al. (1999) and Ometto et al. (2002). The
u* ( m s -1 ) 0.0 0.2 0.4 0.6 0.8 1.0 ca ( p p m ) 350 400 450 500 D ( k P a ) 0 1 2 3
Local time (hour)
Fc ( µ m o l m -2 s -1 ) -40 -30 -20 -10 0 10 20 30 40 50 a b c
2 Aug 3 Aug 4 Aug 5 Aug 6 Aug
u* ( m s -1) 0.0 0.2 0.4 0.6 0.8 1.0 ca ( p p m ) 350 400 450 500 D ( k P a ) 0 1 2 3
Local time (hour)
Fc ( µ m o l m -2 s -1) -40 -30 -20 -10 0 10 20 30 40 50 d e f
7 Oct 8 Oct 9 Oct 10 Oct 11 Oct
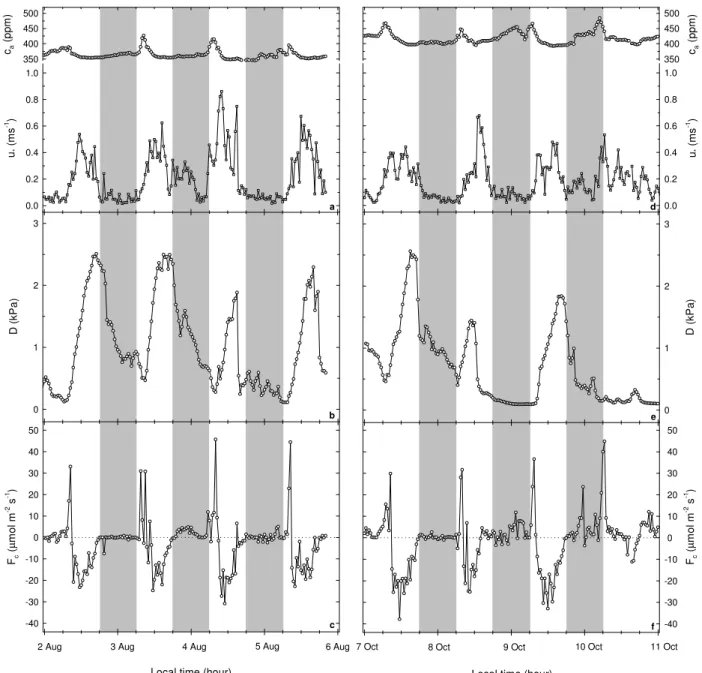
Fig. 1. Diurnal variation of some meteorological and turbulent variables measured at the top of K34 tower (53 m a.g.l. on the plateau): from
2–5 August 2004 (a–c) and from 7–10 October 2006 (d–f). Points correspond to half-an-hour averages. The shaded boxes indicate the nighttime periods. Points above the horizontal dotted line (c and f) denote CO2release, and below the line CO2uptake.
sampling was repeated at plateau and valley sites in Octo-ber 2006 and now included the Campinarana site. Samples were collected using a stainless steel chamber with an inter-nal volume of about 40 L and a small electric fan to enhance mixing within the chamber. Samples were collected at two sites in each topographical section. At each site, five sam-ple flasks were filled using five minutes time intervals be-tween sampling for determining the carbon isotope ratio of soil respired CO2(δ13CRsoil) (explained further). All
sam-ples were shipped to CENA for stable isotope ratio and ca
analyses.
3.4 Laboratory analyses
The δ13Ca in sample flasks were measured using a
continuous-flow isotope-ratio mass spectrometer (IRMS) (Delta Plus, Finnigan MAT, Germany) as described by Ehleringer and Cook (1998) and Ometto et al. (2002). Measurement precision of this method was 0.13‰ for13C (Ometto et al., 2002). The air remaining in the flask after stable isotope ratio analysis was used to measure ca using
a system similar to that described by Bowling et al. (2001a). Measurement precision and accuracy of this method were 0.2
and 0.3 ppm, respectively (Ometto et al., 2002).
Leaf and litter samples were dried at 65◦C to constant weight, then ground with mortar and pestle to a fine powder. A 1–2 mg subsample of ground organic material was sealed in a tin capsule and placed into an elemental analyzer (Carlo Erba Instruments, Model EA 1110 CHNS-O, Milan, Italy) for combustion and subsequent elemental C and N analy-sis. The CO2 generated by combustion was purified in a
gas chromatograph column and passed directly to the inlet of the IRMS (Delta Plus, Finnigan MAT, USA) operating in continuous-flow mode.
These provided stable isotope ratios of carbon, oxygen and nitrogen (13C/12C; 18O/16O;15N/14N) with a measurement precision of 0.2‰ (Ometto et al., 2006). The carbon iso-tope ratio was expressed in the delta notation (δ), which re-lates the measured13C/12C molar ratio of the sample and the international Pee Dee Belemnite (PDB) limestone stan-dard (Ehleringer and Rundel, 1989). The δ13C values are presented in parts per thousand (‰).
3.5 Correlation between δ13C
Recoand water vapor
satura-tion deficit
The possibility of a correlation with fine time lag between en-vironmental variables and δ13CRecomay confound our
anal-ysis, so we investigated the relation between ambient vapor pressure deficit and δ13CReco (Ekblad and Hogberg, 2001;
Bowling et al., 2002; McDowell et al., 2004; Knohl et al., 2005; Werner et al., 2006). We selected the water vapor saturation deficit in the air (D) as a suitable variable be-cause it may influence δ13CRecoat a short time scale,
possi-bly through changes in photosynthetic discrimination (Bowl-ing et al., 2002). Daytime mean values were used unless specified otherwise. Because there may be a significant de-lay between the time that a given carbon atom is assimilated by photosynthesis and the time that it is respired by various ecosystem components (Ekblad and Hogberg, 2001), corre-lations between D and δ13CRecowere examined over a range
of time lags (e.g., relationships between D on day X and δ13CRecoon day X+n). We calculated averages of daytime
D (from 10:00 to 17:00) from 1–5 days, and then shifted these averages back in time by 0–15 days. A 1-day average and a 0-day time lag correspond to the average daytime D on the day prior to the night of sampling. For a more detailed description of lag analysis see Bowling et al. (2002), Ekblad and Hogberg (2001) and McDowell et al. (2004).
3.6 Statistical analyses
3.6.1 Organic samples (δ13Cleafand δ13Clitter)
Statistical comparisons were made using Model I ANOVA, and comparisons between means were evaluated with Bon-ferroni t tests (Glover and Mitchell, 2002; Sokal and Rohlf,
1995). Unless otherwise indicated, a significance level of 99% was used in all hypotheses testing (Table 1).
3.6.2 Keeling plots for δ13CRecoand δ13CRsoil
A two-source mixing model proposed by Keeling (1958) was used to obtain δ13CRecoand δ13CRsoil(Flanagan et al., 1999;
Ometto et al., 2002; Pataki et al., 2003a). The Model II regression or geometric mean regression (GMR) has been recommended to determine the Y-intercept (Pataki et al., 2003a). However, Zobitz et al. (2006) argued that the use of Model II regression to obtain δ13CReco is inappropriate
because it is a biased estimator of δ13CReco and the
rela-tive error in the δ13Cameasurements is significantly greater
than the relative error in cameasurements. They suggested
therefore the use of Model I regression or ordinary least squares (OLS) to determine the Y-intercept (a) and slope (by.x). We have decided to follow their recommendation,
though we also present the slope (vy.x) and Y-intercept (av)
of Model II regression for δ13CReco (Table 2). Uncertainty
for the Y-intercept is reported as standard error estimate from a Model I regression or standard linear regression intercept (SEa) (Sokal and Rohlf, 1995; Pataki et al., 2003a; Zobitz
et al., 2006). Because we followed the suggested guidelines made by Pataki et al. (2003a) to reduce errors when using the two-source mixing approach for estimating δ13CReco, the
majority of the standard errors of the Y-intercept reported here are smaller than 1‰ (Table 2).
3.6.3 Correlation between δ13CRecoand D
First-order linear regression was used except in cases where scatter plots suggested nonlinear or second-order equations were appropriate. The Pearson product-moment correlation coefficient, usually known by correlation coefficient (r), was used as the index of association of two variables (Glover and Mitchell, 2002).
4 Results
4.1 Meteorological and turbulent variables 4.1.1 Dry season campaign on 2–5 August 2004
Figure 1 shows the diurnal variation of selected meteorolog-ical and turbulent variables measured at the top of K34 tower (53 m a.g.l.) during the sampling period. Rainfall (12 mm) occurred in the late afternoon of 4 August (data not shown), with a corresponding increase in the friction velocity (u∗)
from about 0.2 m s−1 to 0.8 m s−1 and D decreased from about 2 kPa to 0.5 kPa (Fig. 1a, b). Nighttime values of u∗
were higher at 0.2 m s−1 from 3–4 August than during the other nighttime periods (Fig. 1a), implying enhanced vertical mixing on 3–4 August. The nighttime periods from 3–4 and
Table 1. Stable carbon isotope and C:N ratios of leaves and litter along a topographical gradient in central Amazonia. Leaves were sampled
in the canopy layer in August 2004 and at the top of the canopy in October 2006. The δ13Cleaf, δ13Clitter, C:Nleafand C:Nlitterare presented as average (±standard error). Averages in the same column followed by different letters are significantly different at α=0.01 (Bonferroni
t -tests).
Date Place δ13Cleaf(‰) C:Nleaf δ13Clitter(‰) C:Nlitter n1 n2
August 2004 Plateau –28.86a±0.84 28.01a±5.5 –30.75a 27.84a 5 1 Slope –31.54ab±1.00 35.15a±5.1 –30.22a 26.67a 4 1 Valley –32.34b±0.79 35.34a±5.5 –30.12a 30.84a 5 1 October 2006 Plateau –29.71a±0.32 30.92a±2.3 13 Campinarana –30.31b±0.36 35.24a±2.8 11 Valley –30.55b±0.25 37.88a±2.7 11
The number of samples collected at each topographical section is presented as n1and n2, and refer to leaf and litter samples, respectively.
Table 2. Statistics of Keeling plots used to obtain the δ13CRecoalong a topographical gradient in central Amazonia. The values of a and av
are expressed in ‰ (per mil), cain ppm, and by.xand vy.xin ‰ ppm.
Place Period by.x a vy.x av r r2 SEa camin camax carange n
Plateau 2–3 Aug 2004 8066.06 –29.76 8221.10 –30.14 0.98 0.96 0.91 379.5 483.7 104.2 20 3–4 Aug 2004 8487.91 –30.79 8562.05 –30.97 0.99 0.98 0.71 388.1 476.3 88.2 16 4–5 Aug 2004 8069.02 –29.62 8107.45 –29.71 0.99 0.99 0.43 374.3 551.9 177.6 20 7–8 Oct 2006 7377.16 –28.02 7403.43 –28.09 0.99 0.99 0.37 374.2 513.2 139 17 8–9 Oct 2006 7698.18 –28.70 7780.70 –28.89 0.99 0.98 0.68 408.7 456.5 47.8 17 9–10 Oct 2006 5609.03 –23.64 5797.74 –24.04 0.96 0.94 0.81 419.4 553.4 134 17 Slope 2–3 Aug 2004 9441.98 –32.46 9605.08 –32.81 0.98 0.97 0.89 394.2 545.3 151.1 18 3–4 Aug 2004 8278.19 –29.39 8447.39 –29.74 0.98 0.96 0.82 428.5 545.7 117.2 20 4–5 Aug 2004 7496.50 –28.30 7517.47 –28.35 0.99 0.99 0.28 410.8 578.7 167.9 18 Valley 2–3 Aug 2004 9658.42 –32.44 9779.97 –32.69 0.99 0.98 0.73 447.7 560.6 112.9 20 3–4 Aug 2004 6489.37 –26.08 6679.55 –26.46 0.97 0.94 0.77 455.7 558.6 102.9 19 4–5 Aug 2004 8299.85 –29.69 8340.31 –29.78 0.99 0.99 0.40 422.2 559.6 137.4 20 7–8 Oct 2006 7523.61 –28.13 7615.30 –28.30 0.99 0.98 0.59 476.2 595.0 118.8 16 8–9 Oct 2006 6671.87 –26.64 7052.79 –27.48 0.93 0.89 1.29 405.1 488.4 83.3 17 9–10 Oct 2006 5809.47 –25.10 5989.76 –25.48 0.94 0.94 0.79 418.7 523.8 105.1 14
The slope of Model I regression (by.x), the Y-intercept of Model I regression (a), the slope of Model II regression (vy.x), the Y-intercept of
Model II regression (av), the correlation coefficient (r), the coefficient of determination (r2), the standard error of the Y-intercept of Model
I regression (SEa), and the caminimum, maximum and range are presented. The SEahigher than 1‰ is in bold.
4–5 August were ranked as the least and most stable, respec-tively. This was observed in the nighttime values of above-canopy turbulent exchanges of CO2 (Fc) that were higher
from 3–4 August (about 2.7±0.6 µmol m−2s−1) than from 4–5 August (about 0.2±0.4 µmol m−2s−1) (Fig. 1c). 4.1.2 Dry season campaign on 7–10 October 2006 Due to a lightning strike on the B34 valley tower neither me-teorological nor turbulent data were measured at this site dur-ing the sampldur-ing period (between 27 September and 12 Oc-tober). Figure 1d–f therefore shows the diurnal variability of meteorological and turbulent variables measured at the top of K34 tower on the plateau. Rainfall occurred in the morning of 8 October (0.2 mm) and 10 October (27 mm), respectively
(data not shown). Nighttime values of u∗ were higher for
9–10 October than at the other nighttime periods, implying enhanced vertical mixing on 9–10 October (Fig. 1d). The nighttime periods from 9–10 and 7–8 October were ranked as the least and most stable, respectively. This was observed in the nighttime values of Fcthat were higher from 9–10
tober than from 7–8 October (Fig. 1d, f). On 8 and 9 Oc-tober, between 06:00 and 08:00 local time (LT), the values of Fcwere very high showing considerable amounts of CO2
from ecosystem respiration (Reco) released in a short time
in-terval (Fig. 1f). Daytime values of Fcwere less negative on
10 October than on 8 October due to a high morning rainfall on 10 October (Fig. 1f).
4.2 Spatial variability of δ13Cleaf, δ13Clitterand canopy and
litter C:N ratio
In August 2004, the vertical profile of δ13Cleaf through the
canopy showed a similar pattern for every topographical sec-tion, decreasing with depth into the canopy (data not shown). However, δ13Cleaf of canopy layer was significantly more
negative in the valley than on the plateau, with values of –32.34‰ and –28.86‰, respectively (Table 1). On other hand, δ13Clitter showed no significant difference among the
topographical sections (Table 1). Although the litter samples had been collected randomly, they comprise a mix of litter-fall from different canopy heights and decomposition stages on the soil surface. It is very likely that the reduced num-ber of litter samples per topographical section may have not been representative of the site variability. The C:N ratios of leaves from the canopy layer and litter showed no significant difference between the means (Table 1).
In October 2006, δ13Cleafat the top of the canopy was
sig-nificantly more negative in the valley than on the plateau, about –30.55‰ and –29.71‰, respectively (Table 1). Yet, the C:N ratios of leaves from the top of the canopy were higher in the valley and Campinarana than on the plateau, though there was no significant difference between the means at the 99% level (Table 1). No significant difference was ob-served between the δ13Cleaf of old and new leaves sampled
in October 2006 (data not shown).
4.3 Temporal and spatial variability of δ13Ca, ca, δ13CReco
and δ13CRsoil
4.3.1 Campaigns on 8–9 October and 17–18 November 2002
These trial campaigns, on 8–9 October and 17–18 November 2002, provided the first insights into the variation of δ13Ca
and ca with time and topography. They suggested that the
atmospheric air below the canopy was more13C depleted in the valley than on the plateau (data not shown). Yet, δ13Ca
was uniform with height a.g.l. in the valley, whereas at both slope and plateau it was quite variable. In addition, ca was
higher in the valley and slope than on the plateau, and it was uniform with height a.g.l. in the valley (data not shown). 4.3.2 Dry season campaign on 2–5 August 2004
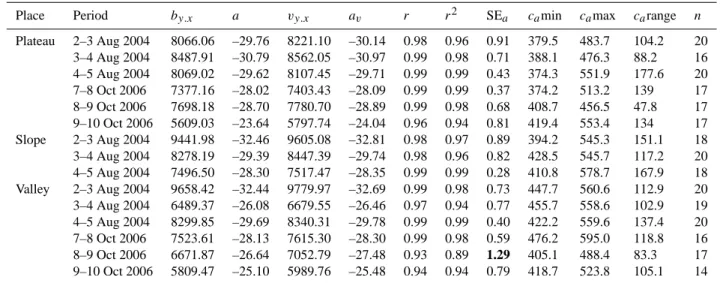
As in the trial campaigns, nighttime values of δ13Ca were
significantly different among the topographical sections. The δ13Ca was more negative in the valley and slope plots than
on the plateau (Fig. 2a–c). The δ13Cadifference between the
canopy layer (35–20 m a.g.l.) and shrub layer (from 5 m a.g.l. downwards) was larger on the plateau than on the slope and in the valley. Post-sunset or pre-dawn values of the δ13Cain
the canopy layer were always more negative at both slope and valley plots than on the plateau by at least 1.5‰ or 2.5‰ re-spectively (Fig. 2a–c). Before dawn, on 4 August, the δ13Ca
measured at 30 m a.g.l. increased sharply at both slope and valley, this was not observed on 3 and 5 August (Fig. 2b, c), thus suggesting that the erosion of the nighttime buildup in the valley had already started.
Opposing the isotopic signatures along the topographical sections, the nighttime values of cawere higher at both slope
and valley than on the plateau (Fig. 2d–f). In addition, the cadifference between the canopy layer and shrub layer was
larger on the plateau than on the slope and in the valley. Be-fore dawn, on 4 August, the cameasured at 30 m a.g.l.
de-creased sharply at both slope and valley, this was different on 3 and 5 August (Fig. 2e, f). As mentioned above, this sug-gests that the erosion of the nighttime buildup in the valley had already started.
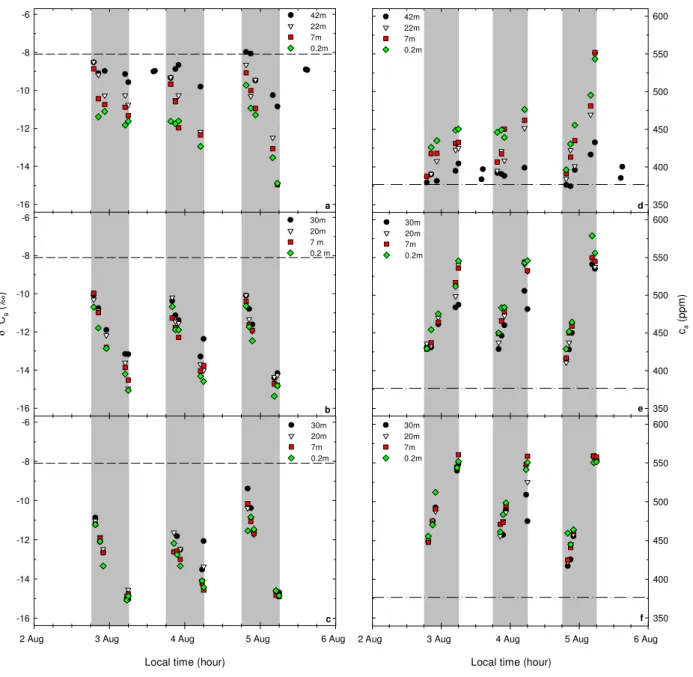
Figure 3 shows the relationship between ca and δ13Ca
for each topographical section during the three consecutive nighttime periods. Although the second-order regressions for the plateau were quite similar, their curvatures showed that for the same values of cathe values of δ13Cafrom 4–5
August were slightly less negative than from 2–3 August and 3–4 August, respectively (Fig. 3a). At both slope and val-ley, the regressions were quite variable and hard to interpret (Fig. 3b, c). The nighttime variability of caand δ13Cawas
also observed in the values of δ13CReco(Table 2). From 2–
3 August, δ13CRecowas less negative on the plateau than at
both slope and valley (Fig. 4a). On the following day, 3–4 August, δ13CReco became progressively less negative
mov-ing from the valley to the slope and onto the plateau. Finally, from 4–5 August, δ13CReco was less negative on the slope
than on both plateau and valley (Fig. 4a). On the plateau, the values of δ13CRecoagreed very well with the predictions
based on the regressions in Fig. 3a. The δ13CRsoilwas also
variable among the topographical sections. It was less nega-tive on the plateau than in the valley, but the minimum was found on the slope (Fig. 4b).
4.3.3 Dry season campaign on 7–10 October 2006 Nighttime values of δ13Cawere more negative in the valley
than on the plateau. High δ13Ca was observed early in the
night, whereas low δ13Caoccurred before dawn. The δ13Ca
was highest on 7 October on the plateau and on 8 October in the valley, and it was lowest on October 8 at both plateau and valley (Fig. 5a, b). Before dawn on 8 October, the δ13Ca
measured at 42 m a.g.l. on the plateau and at 30 m a.g.l. in the valley were about 4‰ and 1‰ more enriched in13C, respec-tively, than the levels below them (Fig. 5a, b). This suggests that the erosion of the nighttime buildup on the plateau and in the valley had already started. From 8-9 October, the values of δ13Ca from the canopy layer downwards on the plateau
and from middle layer downwards in the valley were almost uniform with height a.g.l. (Fig. 5a, b).
Nighttime values of ca were higher in the valley than on
the plateau. Low ca was observed early at night and high
-16 -14 -12 -10 -8 -6 42m 22m 7m 0.2m δ 1 3 C a ( ‰ ) -16 -14 -12 -10 -8 -6 30m 20m 7 m 0.2 m a b c 350 400 450 500 550 600 42m 22m 7m 0.2m ca ( p p m ) 350 400 450 500 550 600 30m 20m 7m 0.2m d e f
Local time (hour)
2 Aug 3 Aug 4 Aug 5 Aug 6 Aug 350 400 450 500 550 600 30m 20m 7m 0.2m
Local time (hour)
2 Aug 3 Aug 4 Aug 5 Aug 6 Aug -16 -14 -12 -10 -8 -6 30m 20m 7m 0.2m
Fig. 2. Evolution of δ13Caand caalong a topographical gradient in Central Amazonia from sunset until dawn on 2–5 August 2004: on the
plateau (a, d), slope (b, e) and valley (c, f); and measurements of δ13Caand caat 42 m a.g.l. on the plateau late in the afternoon on 5 August
2004 (a, d). Points correspond to the single measurement made at each sampling level. The dashed line in (a-c) and the dash-dotted line in (d–f) represent the carbon isotope ratio of tropospheric background CO2(δ13Cb) and the tropospheric background [CO2] (cb) measured
in the marine boundary layer at Ascension Island, UK (7.92◦S 14.42◦W; 54 m a.s.l.), respectively, on August 2004 (about –8.094‰ and 376.71 ppm) (White and Vaughn, 2007; Conway et al., 2007). The shaded boxes indicate the nighttime periods.
ca measured at 42 m a.g.l. on the plateau and at 30 m a.g.l.
in the valley were about 120 ppm and 30 ppm lower, respec-tively, than at lower levels (Fig. 5c, d). Again, as mentioned before, this suggests that the erosion of the nighttime buildup on the plateau and in the valley had already started. On 8–9 October, the values of cafrom the canopy layer downwards
on the plateau and from middle layer downwards in the val-ley were almost uniform with height a.g.l. (Fig. 5c, d).
The relation between ca and δ13Ca for each
topograph-ical section during the three consecutive nighttime periods was also investigated. The second-order regressions for the plateau had the same shape as those shown in Fig. 3a. In ad-dition, the curvatures of the regressions showed that for the same values of ca the values of δ13Ca from 9–10 October
were less negative than those of 7–8 October and 8–9 Oc-tober, respectively (data not shown). The regressions for the
-16 -15 -14 -13 -12 -11 -10 -9 -8 δ 1 3 C a ( ‰ ) -16 -15 -14 -13 -12 -11 -10 -9 -8 a b c Aug 2-3 Aug 3-4 Aug 4-5 Aug 2-3 Aug 3-4 Aug 4-5 ca (ppm) 360 380 400 420 440 460 480 500 520 540 560 580 600 -16 -15 -14 -13 -12 -11 -10 -9 -8 Aug 2-3 Aug 3-4 Aug 4-5
Fig. 3. Relationship between caand δ13Caalong a topographical
gradient in Central Amazonia from sunset until dawn on 2–5 August 2004: (a) on the plateau, (b) slope and (c) valley. Points correspond to the single measurement made at each sampling level. The solid, dotted and dashed lines denote the second-order regressions for the periods of 2–3 August, 3–4 August and 4–5 August, respectively.
valley also had a similar shape as those shown in Fig. 3c (data not shown).
Nighttime variability of ca and δ13Ca was also observed
in the values of δ13CReco (Table 2). The values of δ13CReco
were more negative in the valley than on the plateau on 7–8 October and 9–10 October and more positive on 8–9 Octo-ber (Fig. 4c). On the plateau, the values of δ13CRecoagreed
very well with the predictions based on the regressions. In
Date
2-3 Aug 04 3-4 Aug 04 4-5 Aug 04
δ 1 3C R e c o ( ‰ ) -34 -32 -30 -28 -26 -24 -22 Plateau Slope Valley Topographic section
Plateau Slope Valley
δ 1 3C R s o il ( ‰ ) -34 -32 -30 -28 -26 -24 -22 Topographic section
Plateau Campinarana Valley
δ 1 3C R s o il ( ‰ ) -34 -32 -30 -28 -26 -24 -22 Date
7-8 Oct 06 8-9 Oct 06 9-10 Oct 06
δ 1 3C R e c o ( ‰ ) -34 -32 -30 -28 -26 -24 -22 Plateau Valley a b c d
Fig. 4. δ13CRecoand δ13CRsoilmeasured along a tographical gra-dient in Central Amazonia in August 2004 (a, b) and October 2006
(c, d). Points in a and c correspond to the Y-intercept of the Keeling
plot (±standard error) for every nighttime period at each topograph-ical position. Each point in b and d corresponds to the Y-intercept of the Keeling plot (±standard error) at each topographical position on 6 August 2004 and 9 October 2006, respectively.
addition, the values of δ13CRecowere higher than those
mea-sured on August 2004. The δ13CRsoil was greater on the
plateau than at the Campinarana and in the valley, respec-tively (Fig. 4d).
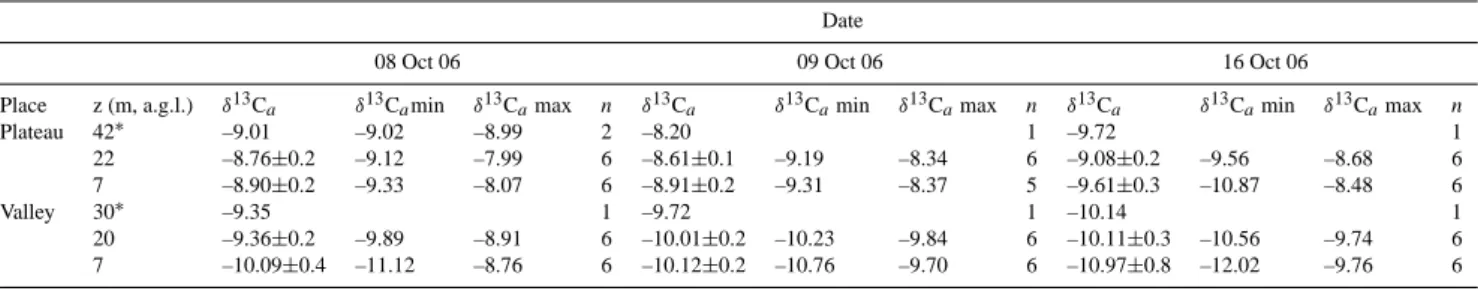
Daytime values of δ13Ca were typically less negative on
the plateau than in the valley by about 1‰ (Table 3). 4.4 Correlation between δ13CRecoand D
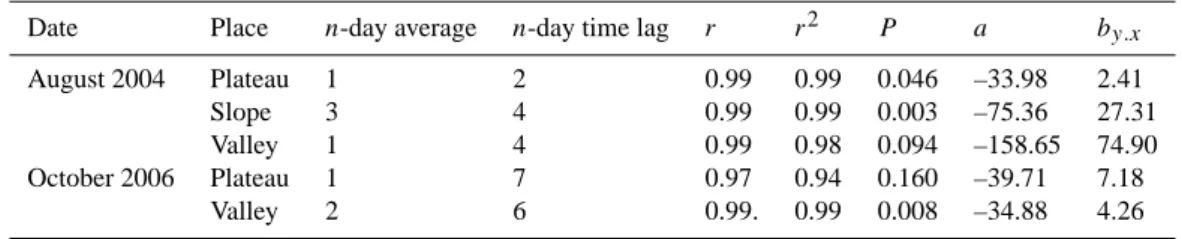
There were strong correlations between δ13CReco and D at
all topographical sections. In August 2004, the highest cor-relations were observed with 1 and 3-day average and 2 and 4-day lag times for plateau, slope and valley (Table 4). Fig-ure 6a shows that on the plateau, according to Table 4, the δ13CRecoon 2–3, 3–4 and 4–5 August had a maximum
corre-lation with the averaged D of 31 July, 1 and 2 August, respec-tively. In October 2006, the highest correlations were ob-served with 1 and 2-day average and 7 and 6-day lag times for plateau and valley, respectively (Table 4). Figure 6b shows that in the valley, according to Table 4, the δ13CRecoon 7–8,
8–9 and 9–10 October had a maximum correlation with the averaged D for the period from 30 September to 1 October, from 1 to 2 October, and from 2 to 3 October, respectively. Figure 6c shows the relationship between δ13CReco and D
for each topographical section, according to the results of Table 4. In August 2004, the δ13CRecowas more responsive
to changes on the slope and in the valley than on the plateau (Fig. 6c). However, on the slope and in the valley, δ13CReco
ranged from about –26 to –33‰ with almost no variation in D. In October 2006, on both plateau and valley, δ13CReco
a b -16 -14 -12 -10 -8 -6 42m 22m 7m 0.2m
Local time (hour)
7 Oct 8 Oct 9 Oct 10 Oct 11 Oct
δ 1 3 C a ( ‰ ) -16 -14 -12 -10 -8 -6 30m 20m 7m 0.2m c d 350 400 450 500 550 600 42m 22m 7m 0.2m
Local time (hour)
7 Oct 8 Oct 9 Oct 10 Oct 11 Oct c (a p p m ) 350 400 450 500 550 600 30m 20m 7m 0.2m
Fig. 5. Diurnal curves of δ13Caand caalong a topographical gradient in Central Amazonia on 7–10 October 2006: on the plateau (a, c) and
in the valley (b, d). Points correspond to the single measurements made at each sampling level. The dashed line (a, b) and the dash-dotted line (c, d) represent the carbon isotope ratio of tropospheric background CO2(δ13Cb) and the tropospheric background [CO2] (cb) measured
in the marine boundary layer at Ascension Island, UK (7.92◦S 14.42◦W; 54 m a.s.l.), respectively, on October 2006 (about –8.156‰ and 380.77 ppm). The δ13Cbwas determined by linear interpolation using the data from October 2004 and 2005, as these were the last data
available (about –8.105 and –8.152‰ respectively). The cbwas determined by adding the annual [CO2] growth rate for the year 2006 (about 1.73 ppm year−1) to the [CO2] on October 2005 (about 379.04 ppm) (White and Vaughn, 2007; Conway et al., 2007). The shaded boxes indicate the nighttime periods.
Table 3. Statistics of daytime values of δ13Cameasured along a topographical gradient in central Amazonia. The averaged δ13Ca(±
standard error), δ13Camin and δ13Camax are expressed in ‰ (per mil).
Date
08 Oct 06 09 Oct 06 16 Oct 06
Place z (m, a.g.l.) δ13Ca δ13Camin δ13Camax n δ13Ca δ13Camin δ13Camax n δ13Ca δ13Camin δ13Camax n
Plateau 42∗ –9.01 –9.02 –8.99 2 –8.20 1 –9.72 1 22 –8.76±0.2 –9.12 –7.99 6 –8.61±0.1 –9.19 –8.34 6 –9.08±0.2 –9.56 –8.68 6 7 –8.90±0.2 –9.33 –8.07 6 –8.91±0.2 –9.31 –8.37 5 –9.61±0.3 –10.87 –8.48 6 Valley 30∗ –9.35 1 –9.72 1 –10.14 1 20 –9.36±0.2 –9.89 –8.91 6 –10.01±0.2 –10.23 –9.84 6 –10.11±0.3 –10.56 –9.74 6 7 –10.09±0.4 –11.12 –8.76 6 –10.12±0.2 –10.76 –9.70 6 –10.97±0.8 –12.02 –9.76 6
δ 1 3C R e c o ( ‰ ) -32 -30 -28 -26 -24
30 Jul 1 Aug 3 Aug 5 Aug 28 Jul 26 Jul 24 Jul 22 Jul 20 Jul 18 Jul D (kPa) 1.0 1.5 2.0 2.5 3.0 δ 1 3C R e c o ( ‰ ) -34 -32 -30 -28 -26 -24 -22 Plateau Plateau Slope Valley Valley a Time (day) D ( k P a ) 0.0 0.5 1.0 1.5 2.0 2.5 3.0 3.5 b δ 1 3C R e c o ( ‰ ) -32 -30 -28 -26 -24 c
3 Oct 5 Oct 7 Oct 9 Oct 11 Oct 23 Sep25 Sep 27 Sep 29 Sep 1 Oct
Time (day) D ( k P a ) 0.0 0.5 1.0 1.5 2.0 2.5 3.0 3.5
Fig. 6. Diurnal curves of half-an-hour averages of water vapor saturation deficit in the air (D) measured at the top of K34 tower (53 m a.g.l. on the plateau): from 18 July to 5 August 2004 (a) and from 22 September to 10 October 2006 (b). Carbon isotope ratio of ecosystem respired CO2(δ13C
Reco)(±standard error) on the plateau from 2–5
August 2004 (a) and in the valley from 7-10 October 2006 (b).The n-day average and n-day time lag that presented the maximum correlation between δ13CRecoand D on
the plateau and in the valley (as in Table 4) are indicated by arrows (a) and horizontal bars (b), respectively. The length of the horizontal bar denotes the 2-day averaged (as in Table 4), and each horizontal bar has a corresponding δ13C
Reco, from left to
right. (c) Relationship between δ13CRecoand D (averaged and time-lagged) along
a topographical gradient in Central Amazonia in August 2004 (shaded symbols) and October 2006 (open symbols) according to the results of Table 4. The linear regressions for slope and valley in August 2004 were omitted for clarity. The error bars denote the standard error.
was positively correlated with D (Fig. 6c). The δ13CRecowas
here more responsive to changes in D on the plateau than in the valley.
5 Discussion
5.1 Spatial variability of δ13Cleaf
The δ13Cleafdecreased from plateau towards the valley
(Ta-ble 1). This result is consistent with the work of Medina and Minchin (1980) in Amazonian rainforests in the southern part of Venezuela. These authors reported averaged δ13Cleaf
of –28.7 and –30.5‰ for the upper canopy levels of forests on lateritic outcrops and sandy spodosols soils, respectively. Increased leaf-level photosynthetic capacity of plants has been linked to higher leaf nitrogen content and leaf mass per unit area (LMA), and increased leaf thickness (Sparks and Ehleringer, 1997; Hanba et al., 2000; Vitousek et al., 1990; Korner and Woodward, 1987; Friend et al., 1989). Increased leaf-level photosynthetic capacity would decrease ci at the
carboxylation site, thus reducing 1leaf and consequently
in-creasing δ13Cleaf(Sparks and Ehleringer, 1997). At our study
site, Luiz˜ao et al. (2004) observed that leaf nitrogen con-centration was significantly higher on the plateau than in the valley. Furthermore, Nardoto (2005) showed that LMA was higher on the plateau than in the valley. These results support our findings.
The δ13Cleaf may also be affected by ca, δ13Ca and soil
moisture. Even though daytime values of ca were about
20 ppm lower on the plateau than in the valley (Fig. 5c, d) it is unlikely that this difference would have contributed much to the observed pattern in δ13Cleaf. Daytime values of
δ13Cawere about 1‰ lower in the valley than on the plateau
(Table 3, Fig. 5a, b). Lower δ13Ca may have a significant
contribution to lowering the values of δ13Cleafin the valley.
Schulze (1986) demonstrated that leaf conductance might be more sensitive to soil moisture than photosynthesis. In this manner, it is very likely that decreased soil moisture content on the plateau would cause a decrease in leaf conductance, which implies in less diffusion of CO2to the interior of the
stomatal chamber therefore lowering the ci. As ci decreases
in the carboxylation site, the ci/caratio of a leaf decreases as
well 1leafand consequently δ13Cleafincreases on the plateau.
Thus, at this site, it seems that it is not only 1leafthat explains
the pattern in δ13Cleaf, but rather the combination of factors
such as the δ13Cain air surrounding the leaves, soil moisture
availability, leaf nitrogen concentration, and LMA. 5.2 Temporal and spatial variability of δ13Caand ca
In general, δ13Ca was more negative in the valley than on
the plateau at night, whereas cashowed an opposite pattern,
i.e. it was higher in the valley than on the plateau. This is consistent with the findings of de Ara´ujo et al. (in press),
Table 4. Summary of correlation analyses between δ13CRecoand water vapor saturation deficit in the air (D) at a forest site in central
Amazonia in the dry season. The values of a are expressed in ‰ (per mil) and by.xin ‰ kPa−1. Unless otherwise indicated, n=3 for every topographical section.
Date Place n-day average n-day time lag r r2 P a by.x
August 2004 Plateau 1 2 0.99 0.99 0.046 –33.98 2.41
Slope 3 4 0.99 0.99 0.003 –75.36 27.31
Valley 1 4 0.99 0.98 0.094 –158.65 74.90
October 2006 Plateau 1 7 0.97 0.94 0.160 –39.71 7.18
Valley 2 6 0.99. 0.99 0.008 –34.88 4.26
The number of days averaged (n-day average), the number of days lagged (n-day time lag), the correlation coefficient (r), the coefficient of determination (r2), the P -value of the regression, the Y -intercept of Model I regression (a), and the slope of Model I regression (by.x) are presented.
who observed that in the dry season, depending on the atmo-spheric stability, there was a preferential pooling of cain the
lower topographical areas of this landscape.
Larger differences in δ13Ca and ca between canopy layer
and shrub layer on the plateau than in the valley may result from horizontal stratification of the nocturnal CO2buildup.
According to de Ara´ujo et al. (in press), ca was stratified
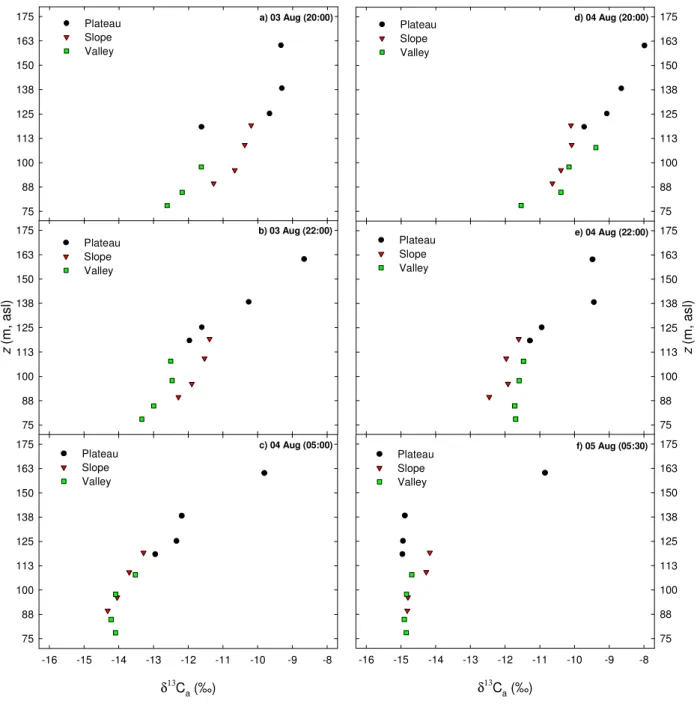
horizontally in layers of increasing concentration (from top to bottom) along the topographical gradient. They argued that horizontal stratification was caused by inversion layers that develop above and underneath the canopy. Figure 7 shows the evolution of vertical profiles of δ13Ca along the
topographical gradient during 3–4 and 4–5 August, which is consistent with the pattern described by de Ara´ujo et al. (in press). The δ13Cameasured at about 160 m a.s.l. (42 m a.g.l.
on the plateau) was consistently higher than that measured at the levels below, most likely as consequence of an inversion layer that separated the canopy air from the free atmospheric air (Fig. 7). The vertical stratification of δ13Ca was clearer
on the plateau than on the slope or in the valley, particularly before dawn, when the δ13Caprofiles on the slope and in the
valley were fairly uniform with altitude (Fig. 7). The uni-formity of δ13Ca and ca with height in the valley suggests
that the air is well mixed (vertical mixing), most likely as a consequence of the nocturnal thermal belts that might have occurred (Goulden et al., 2006; de Ara´ujo et al., in press). Vertical mixing might also have happened on the plateau and in the valley during the nighttime period from 8–9 October, when the values of δ13Caand cafrom the canopy layer
down-wards and from middle layer downdown-wards were almost uni-form with height a.g.l., respectively (Fig. 5).
The δ13Ca was more negative in the valley than on the
plateau during daytime periods, whereas ca was higher. In
addition, the decrease of cawith time of the day was faster on
the plateau than in the valley (Fig. 5). This is consistent with the findings of de Ara´ujo et al. (in press), who observed that in the dry season the CO2stored in the valley took longer to
be released than that on the plateau, and that cain the valley
did not decrease to the same level as on the plateau at any time during the day. Weak vertical mixing and high Rsoil
(discussed below) in the valleys were considered driving the observed variability in ca.
5.3 Temporal and spatial variability of δ13CReco and
δ13CRsoil
The δ13CReco is more closely associated with that of sun
fo-liage than with the shade fofo-liage across a variety of ecosys-tems (Pataki et al., 2003a). In addition, δ13C
Reco of an
en-tire ecosystem can be either more enriched or more depleted in13C than sun foliage. This association also holds at our site, even considering the high variability in δ13CRecoin both
space and time (Table 1, Fig. 4). Yet, the averaged δ13Cleafof
the most exposed sun foliage of the dominant tree species of some tropical forests was similar to the δ13CRecovalue, thus
suggesting that the major portion of recently respired CO2
in these forests was metabolized carbohydrate fixed by the sun leaves at the top of the forest canopy (Buchmann et al., 1997; Ometto et al., 2002). The δ13CRecois a dynamic
indi-cator of plant physiological response to short-term changes in environmental conditions. Tu and Dawson (2005) showed that δ13CRsoil (root plus microbial) is often enriched in13C
relative to δ13CReco whereas aboveground respiration (leaf
plus stem) is often depleted across a variety of ecosystems. In our site, δ13CRsoil was higher than δ13CReco only on the
plateau, whereas on the slope and in the valley it was the op-posite (explained below) (Fig. 4). The pattern observed on the plateau agrees with Buchmann et al. (1997) and Flana-gan et al. (1999), who also observed higher δ13CRsoil than
δ13CReco in both tropical and boreal forests. In contrast,
Ometto et al. (2002) observed that δ13CRsoil and δ13CReco
were of similar magnitude in a forest about 700 km east of our site.
During the present study, the associations among δ13Cleaf,
δ13CRecoand δ13CRsoilheld reasonably well for the plateau,
whereas for the valley they did not. For example, there were periods such as on 3–4 August and on 8–9 October in which
75 88 100 113 125 138 150 163 175 Plateau Slope Valley b) 03 Aug (22:00) z ( m , a s l) 75 88 100 113 125 138 150 163 175 Plateau Slope Valley c) 04 Aug (05:00) δ13C a (‰) -16 -15 -14 -13 -12 -11 -10 -9 -8 75 88 100 113 125 138 150 163 175 Plateau Slope Valley 75 88 100 113 125 138 150 163 175 Plateau Slope Valley e) 04 Aug (22:00) z ( m , a s l) 75 88 100 113 125 138 150 163 175 Plateau Slope Valley f) 05 Aug (05:30) δ13C a (‰) -16 -15 -14 -13 -12 -11 -10 -9 -8 75 88 100 113 125 138 150 163 175 Plateau Slope Valley a) 03 Aug (20:00) d) 04 Aug (20:00)
Fig. 7. Composite of vertical profiles of δ13Cafrom three different positions along a topographical gradient in Central Amazonia during the
nighttime periods from 3–4 August (a–c) and 4–5 August (d–f) 2004. The reference altitude corresponds to the soil surface level at 850 m in the valley (about 77.3 m a.s.l.). Points correspond to the single measurement made at each sampling level. Time is presented as Local Time.
δ13CRecowas higher in the valley than on the plateau (Fig. 4a,
c). This was somewhat unexpected because in the valley the δ13C
leafand δ13CRsoilwere well depleted in13C relative
to the plateau. Galv˜ao (2005) also observed that δ13CRsoil
was lower in the valley than on the plateau in the dry sea-son of 2003. Leaf respiration and Rsoil correspond to about
80% of Recoat our site (Chambers et al., 2004). Yet, Rsoil
measurements made during the dry season of 2003 showed that Rsoilwas lower on the plateau than in the valley (Souza,
2004). Particularly during these two nighttime periods, there
was some vertical mixing as shown by the measurements of u∗ and Fc (Fig. 1). It is unlikely that Rsoil from the
val-ley might have contributed to δ13C
Recobeing enriched in13C
rather than being depleted in13C. Higher δ13CRecoin the
val-ley than on the plateau therefore points to a combination of physical (mixing and transport) and biotic (respiration) pro-cesses as in de Ara´ujo et al. (in press). These authors ar-gued that respired CO2drains downslope and high Rsoil in
the valleys was driving the observed variability in ca along
measurements during the periods sampled at this study, we cannot corroborate the lateral drainage with empirical data. 5.4 Correlation between δ13CRecoand D
According to the highest correlations between δ13CReco and
D, the time elapsed for a given carbon atom to be assimi-lated by photosynthesis and to be respired by various ecosys-tem components varied between 2 and 7 days at this site (Table 4). Similar investigations in boreal, temperate and Mediterranean forest ecosystems have shown time lags rang-ing between 0 and 10 days (Bowlrang-ing et al., 2002; Knohl et al., 2005; Werner et al., 2006; Ekblad and Hogberg, 2001; McDowell et al., 2004; Mortazavi et al., 2005). It is impor-tant to note that at these forest ecosystems the diversity of species per unit area is very low, whereas the forests of Cen-tral Amazonia have more than 200 species ha−1(Oliveira and
Mori, 1999; Oliveira and Amaral, 2004; Oliveira and Ama-ral, 2005).
Prior to nocturnal sampling periods, there were several rainfall events in August 2004 rather than in October 2006 (data not shown), as it can be seen in the values of D from August 2004 and October 2006 (Fig. 6a, b). This might ex-plain the time lags being shorter in August 2004 than in Oc-tober 2006. We do not have a clear explanation for the time lag of plateau being shorter than for the slope and valley in August 2004 (Table 4) as it is somewhat counterintuitive, be-cause trees are taller on the plateau than on the slope and in the valley. It is likely that the high variability of δ13CReco
on the slope and in the valley may have contributed to this. As mentioned before, it is very likely that lateral drainage of air enriched in13C from upslope areas occurs at our site, which leads to unexpected values of δ13CReco on the slope
and in the valley. Nevertheless, in October 2006, the time lags for plateau and valley were 7 and 6-days, respectively (Table 4). This shows that the time elapsed for a carbon atom to move from foliage to the site of respiration is not constant, but rather, it probably shifts with changes in carbon allocation, tissue metabolism, dark discrimination, assimila-tion rates, environmental condiassimila-tions, etc. (McDowell et al., 2004; Bowling et al., 2002; Knohl et al., 2005; Werner et al., 2006).
In October 2006, δ13CReco was more responsive to
changes in D on the plateau than in the valley (Fig. 6c). As mentioned before, prior to nocturnal sampling periods, there was almost no rainfall in October 2006. Thus, it is likely that high D in combination with low soil water availability on the plateau have driven the observed pattern. Unfortunately, there were no measurements of θ available for the valley to corroborate our hypothesis with empirical data. However, for the plateau, there were. There was a strong negative cor-relation between δ13CReco and θ , and the maximum
corre-lation was observed with 1-day average and 1-day time lag (r2=0.91). This is consistent with Lai et al. (2005), McDow-ell et al. (2004), Werner et al. (2006), Ponton et al. (2006)
and Mortazavi et al. (2005). The shorter time lag for θ in comparison with that for D suggests that soil conditions have a faster and likely more direct effect on δ13CReco. For
ex-ample, it may indicate that the proportion of δ13CReco
re-leased from heterotrophic Rsoilresponds faster to changes in
edaphic conditions (Werner et al., 2006). This effect was shown by Goulden et al. (2004) at a site in Central Amazo-nia.
6 Conclusions
We formulated two hypotheses to be tested in this study. The first one proposed that δ13Cleafis more negative in the valley
than on the plateau as a consequence of both higher soil water availability in the valley and longer time of exposure to high ca with low δ13Ca in the valley than on the plateau during
daytime hours. The second one proposed that the δ13CRecois
more negative in the valley than on the plateau.
There is substantial evidence that δ13Cleafis more negative
in the valley than on the plateau (Sect. 5.1). The processes and factors that may be playing a role at our site are leaf ni-trogen concentration, LMA, soil moisture availability, 1leaf
and lower δ13Cain the valley during daytime hours.
According to the literature, there is a strong positive re-lationship between δ13Cleaf and WUE. Thus, at this site,
the observed pattern of δ13Cleafmight suggest that WUE is
higher on the plateaus than in the valleys. However, there was no full supporting evidence for this because it remains unclear how much of the difference in δ13Cleafwas driven by
physiology or δ13Ca.
The δ13Cleaf, δ13Ca and δ13CRsoilwere more negative in
the valley than on the plateau. Thus, δ13CReco is expected
to be also more negative in the valley than on the plateau. This was observed on some nights, whereas on others it was not. The most likely explanation for this was sought in lat-eral drainage of CO2 enriched in 13C from upslope areas,
when the nights are less stable. This argument is purely based on physical factors only, such as stability parameters, lateral drainage, nocturnal thermal stratification, thermal belts, etc.
However, biotic factors, such as Rsoiland the responses of
plants to environmental variables such as D may also play a role. For example, Rsoil varies spatial and seasonally along
this topography and the response of heterotrophic Rsoilto
hy-dration is faster than that of autotrophic Rsoil. The soluble
sugars produced at the top of the trees are used at the sites of respiration (e.g. stem, leaves, and roots) and their sig-nature should reflect the environmental conditions that pre-vailed when they were biosynthesized. The relationship be-tween δ13CRecoand D sheds light on this issue.
Acknowledgements. This research was done under the Large Scale Biosphere-Atmosphere Experiment in Amazonia (LBA) with the support of INPA, NASA (through LBA-ECO) and Vrije Universiteit Amsterdam. A. C. de Ara´ujo is being supported by the Brazilian government via Fundac¸˜ao Coordenac¸˜ao de
Aperfeic¸oamento de Pessoal de N´ıvel Superior (CAPES), grant BEX1845/02-0. We thank the micrometeorology team of LBA in Manaus, especially H. B. Xavier, J. Tota, A. Santos (in memoriam) and M. B. L. de Oliveira. for invaluable field work and data quality control of K34 tower, and the logistic support of Rubenildo Lima, R. Ara´ujo, E. L. Schloemp and J. Souza. Finally, A. O. Manzi and F. J. Luiz˜ao for their invaluable support throughout several stages of this work, Veber S. de Moura, who assisted us during nocturnal sampling campaigns in October 2006, M. Moreira and E. Mazzi from Laborat´orio de Ecologia Isot´opica of CENA/USP. Data are available on the Beija-Flor metadata LBA Data Information System at http://lba.cptec.inpe.br/beija-flor/.
Edited by: A. Arneth
References
Araujo, A. C., Nobre, A. D., Kruijt, B., Elbers, J. A., Dallarosa, R., Stefani, P., von Randow, C., Manzi, A. O., Culf, A. D., Gash, J. H. C., Valentini, R., and Kabat, P.: Comparative measurements of carbon dioxide fluxes from two nearby towers in a central Amazonian rainforest: The Manaus LBA site, J. Geophys. Res.-Atmos., 107(D20),8090, doi:10.1029/2001JD000676, 2002. Bonal, D., Sabatier, D., Montpied, P., Tremeaux, D., and Guehl,
J. M.: Interspecific variability of δ13C among trees in rainforests of French Guiana: functional groups and canopy integration, Oe-cologia, 124, 454–468, 2000.
Bowling, D. R., Cook, C. S., and Ehleringer, J. R.: Technique to measure CO2mixing ratio in small flasks with a bellows/IRGA system, Agricultural and Forest Meteorology, 109, 61–65, 2001. Bowling, D. R., McDowell, N. G., Bond, B. J., Law, B. E., and Ehleringer, J. R.:13C content of ecosystem respiration is linked to precipitation and vapor pressure deficit, Oecologia, 131, 113– 124, 2002.
Broadmeadow, M. S. J., Griffiths, H., Maxwell, C., and Borland, A. M.: The carbon isotope ratio of plant organic material reflects temporal and spatial variations in CO2within tropical forest for-mations in Trinidad, Oecologia, 89, 435–441, 1992.
Buchmann, N., Guehl, J. M., Barigah, T. S., and Ehleringer, J. R.: Interseasonal comparison of CO2 concentrations, isotopic composition, and carbon dynamics in an Amazonian rainforest (French Guiana), Oecologia, 110, 120–131, 1997.
Chambers, J. Q., Tribuzy, E. S., Toledo, L. C., Crispim, B. F., Higuchi, N., dos Santos, J., Araujo, A. C., Kruijt, B., Nobre, A. D., and Trumbore, S. E.: Respiration from a tropical forest ecosystem: partitioning of sources and low carbon use efficiency, Ecological Applications, 14, S72–S88, 2004.
Chauvel, A., Lucas, Y., and Boulet, R.: On the genesis of the soil mantle of the region of Manaus, Central Amazonia, Brazil, Ex-perientia, 43, 234–241, 1987.
Conway, T. J., Lang, P. M. and Masarie, K. A.: Atmospheric car-bon dioxide dry air mole fractions from the NOAA ESRL carcar-bon cycle cooperative global air sampling network, 1968–2006, ver-sion: 2007-09-19, available at: ftp://ftp.cmdl.noaa.gov/ccg/co2/ flask/event/, 2007.
Dawson, T. E., Mambelli, S., Plamboeck, A. H., Templer, P. H., and Tu, K. P.: Stable isotopes in plant ecology, Annual Review of Ecology and Systematics, 33, 507–559, 2002.
de Ara´ujo, A. C., Kruijt, B., Nobre, A. D., Dolman, A. J., Waterloo, M. J., Moors, E. J., and Souza, J. S.: Nocturnal accumulation of CO2underneath a tropical forest canopy along a topographical gradient, Ecological Applications, in press, 2008.
Ehleringer, J. R., Field, C. B., Lin, Z. F., and Kuo, C. Y.: Leaf car-bon isotope and mineral-composition in subtropical plants along an irradiance cline, Oecologia, 70, 520–526, 1986.
Ehleringer, J. R., Lin, Z. F., Field, C. B., Sun, G. C., and Kuo, C. Y.: Leaf carbon isotope ratios of plants from a subtropical monsoon forest, Oecologia, 72, 109–114, 1987.
Ehleringer, J. R. and Rundel, P. W.: Stable isotopes: History, units, and instrumentation, in: Stable isotopes in ecological research, 1 ed., edited by: Rundel, P. W., Ehleringer, J. R., and Nagy, K. A., Ecological studies, Springer-Verlag, New York, USA, 1–15, 1989.
Ehleringer, J. R. and Cook, C. S.: Carbon and oxygen isotope ratios of ecosystem respiration along an Oregon conifer transect: pre-liminary observations based on small-flask sampling, Tree Phys-iology, 18, 513–519, 1998.
Ekblad, A. and Hogberg, P.: Natural abundance of 13C in CO2 respired from forest soils reveals speed of link between tree pho-tosynthesis and root respiration, Oecologia, 127, 305–308, 2001. Farquhar, G. D., Oleary, M. H., and Berry, J. A.: On the relation-ship between carbon isotope discrimination and the inter-cellular carbon-dioxide concentration in leaves, Australian Journal of Plant Physiology, 9(2), 121–137, 1982.
Farquhar, G. D., Ehleringer, J. R., and Hubick, K. T.: Carbon iso-tope discrimination and photosynthesis, Annual Review of Plant Physiology and Plant Molecular Biology, 40, 503–537, 1989a. Farquhar, G. D., Hubick, K. T., Condon, A. G., and Richards, R. A.:
Carbon isotope fractionation and plant water-use efficiency, in: Stable isotopes in ecological research, 1 ed., edited by: Rundel, P. W., Ehleringer, J. R., and Nagy, K. A., Ecological studies, Springer-Verlag, New York, USA, 21–39, 1989b.
Ferraz, J., Ohta, S., and Sales, P. C.: Distribuic¸˜ao dos solos ao longo de dois transectos em floresta prim´aria ao norte de Man-aus (AM), in: Pesquisas florestais para a consevac¸˜ao da floresta e reabilitac¸˜ao de ´areas degradadas da Amazˆonia, 1st ed., edited by: Higuchi, N., Campos, M. A. A., Sampaio, P. T. B., and dos San-tos, J., Espac¸o Comunicac¸˜ao Ltda., Manaus, Brazil, 264, 1998. Flanagan, L. B., Kubien, D. S., and Ehleringer, J. R.: Spatial and
temporal variation in the carbon and oxygen stable isotope ratio of respired CO2in a boreal forest ecosystem, Tellus Series B-Chemical and Physical Meteorology, 51, 367–384, 1999. Friend, A. D., Woodward, F. I., and Switsur, V. R.:
Field-measurements of photosynthesis, stomatal conductance, leaf ni-trogen and δ13C along altitudinal gradients in Scotland, Func-tional Ecology, 3, 117–122, 1989.
Galv˜ao, M. S.: Dinˆamica espacial e sazonal da composic¸˜ao isot´opica do CO2 respirado por meio do solo em uma floresta prim´aria na Amazˆonia Central, M. S. thesis, Departamento de Ciˆencias Florestais Tropicais, Instituto Nacional de Pesquisas da Amazˆonia, Universidade Federal do Amazonas, Manaus, Brazil, 63 pp., 2005.
Garten, C. T. and Taylor, G. E.: Foliar δ13C within a temperature deciduous forest: spatial, temporal, and species sources of varia-tion, Oecologia, 90, 1–7, 1992.
Glover, T. J., and Mitchell, K. J.: An introduction to biostatistics, 1st ed., McGraw-Hill Higher Education, New York, 416 pp., 2002.