HAL Id: hal-03239754
https://hal.inrae.fr/hal-03239754
Submitted on 27 May 2021
HAL is a multi-disciplinary open access
archive for the deposit and dissemination of
sci-entific research documents, whether they are
pub-lished or not. The documents may come from
teaching and research institutions in France or
abroad, or from public or private research centers.
L’archive ouverte pluridisciplinaire HAL, est
destinée au dépôt et à la diffusion de documents
scientifiques de niveau recherche, publiés ou non,
émanant des établissements d’enseignement et de
recherche français ou étrangers, des laboratoires
publics ou privés.
Body size preferences for women and adolescent girls
living in Africa: a mixed-methods systematic review
Rebecca Pradeilles, Michelle Holdsworth, Oluwabukola Olaitan, Ana Irache,
Hibbah Osei-Kwasi, Christian Ngandu, Emmanuel Cohen
To cite this version:
Rebecca Pradeilles, Michelle Holdsworth, Oluwabukola Olaitan, Ana Irache, Hibbah Osei-Kwasi, et al..
Body size preferences for women and adolescent girls living in Africa: a mixed-methods systematic
review. Public Health Nutrition, Cambridge University Press (CUP), 2021, online first, pp.1-22.
�10.1017/S1368980021000768�. �hal-03239754�
Review Article
Body size preferences for women and adolescent girls living
in Africa: a mixed-methods systematic review
Rebecca Pradeilles
1,* , Michelle Holdsworth
2, Oluwabukola Olaitan
3, Ana Irache
4,
Hibbah A Osei-Kwasi
5, Christian B Ngandu
6and Emmanuel Cohen
6,71School of Sport, Exercise and Health Sciences (SSEHS), Loughborough University, Loughborough LE11 3TU, UK:
2UMR MoISA (Montpellier Interdisciplinary Centre on Sustainable Agri-food Systems), (Univ Montpellier, CIRAD,
CIHEAM-IAMM, INRAE, Institut Agro, IRD), Montpellier, France:3University Hospitals of Leicester NHS trust, Leicester,
UK:4Warwick Medical School, University of Warwick, Coventry, UK:5Department of Geography, University of
Sheffield, Sheffield, UK:6MRC/Wits Developmental Pathways for Health Research Unit, Department of Paediatrics,
University of the Witwatersrand, Johannesburg, South Africa:7UMR CNRS-MNHN 7206 « Eco-anthropologie »,
Musée de l’Homme, Paris, France
Submitted 21 October 2020: Final revision received 1 February 2021: Accepted 10 February 2021
Abstract
Objective: To synthesise evidence on body size preferences for females living in Africa and the factors influencing these.
Design: Mixed-methods systematic review including searches on Medline, CINHAL, ASSIA, Web of Science and PsycINFO (PROSPERO CRD42015020509). A sequential-explanatory approach was used to integrate quantitative and qualitative findings. Setting: Urban and rural Africa.
Participants: Studies of both sexes providing data on body size preferences for
adolescent girls and women aged≥10 years.
Results: Seventy-three articles from twenty-one countries were included: fifty quanti-tative, fifteen qualitative and eight mixed methods. Most studies reported a preference for normal or overweight body sizes. Some studies of adolescent girls/young women indicated a preference for underweight. Factors influencing preferences for large(r) body sizes included: socio-demographic (e.g. education, rural residency), health-related (e.g. current BMI, pubertal status), psycho-social (e.g. avoiding HIV stigma)
and socio-cultural factors (e.g. spouse’s preference, social standing, cultural
norms). Factors influencing preferences for slim(mer) body sizes included: socio-demographic (e.g. higher socioeconomic status, urban residency, younger age), health-related (e.g. health knowledge, being nulliparous), psycho-social (e.g. appear-ance, body size perception as overweight/obese) and socio-cultural factors (e.g. peer pressure, media).
Conclusions: Preference for overweight (not obese) body sizes among some African females means that interventions need to account for the array of factors that maintain these preferences. The widespread preference for normal weight is positive in public health terms, but the valorisation of underweight in adolescent girls/young women may lead to an increase in body dissatisfaction. Emphasis needs to be placed on education to prevent all forms of malnutrition.
Keywords Body size preferences Women Adolescent girls Africa Review
The prevalence of overweight including obesity has increased rapidly amongst women in African countries,
from 33·0 % in 2000 to 42·9 % in 2016(1). North African
and Southern Sub-Saharan African women experience the second and third highest prevalence of overweight
and obesity of the twenty one global burden of
disease regions(2), which are higher than the global
average(3).
Current literature suggests that there are underlying social and cultural factors related to body image, such as
Public Health Nutrition: page 1 of 22 doi:10.1017/S1368980021000768
*Corresponding author: Email r.pradeilles@lboro.ac.uk
© The Author(s), 2021. Published by Cambridge University Press on behalf of The Nutrition Society. This is an Open Access article, distributed under the terms of the Creative Commons Attribution licence (http://creativecommons.org/licenses/by/4.0/), which permits unrestricted re-use, distribution, and reproduction in any medium, provided the original work is properly cited.
a preference for larger body sizes, contributing to the
increasing prevalence of obesity in African females(4,5).
Body size preference plays a role in healthy weight
behaviours. It is defined as an individual’s perception of
how acceptable their body is to themselves and society(6).
This includes body image dissatisfaction that may contrib-ute to attempting to achieve an ideal body image leading to
a desire for weight loss or weight gain(7). Body
dissatisfac-tion (for slimness) may be one of the key drivers of the obesity epidemic in African women and adolescent girls. A cultural preference for a heavier body size is thought to lead to greater body satisfaction of African women at
larger body sizes(8). In addition, body dissatisfaction might
promote weight gain in slimmer women trying to fit in with cultural norms. For example, Moroccan Sahraouian women actively engage in fattening behaviours to attain the
desir-able body size within their community(9). Fatness is a sign
of femininity, fertility and being a nurturing mother.
Women’s primary role in these societies is associated
with motherhood, therefore,‘being fat’ elevates females’
status by embodying their suitability for this role(10,11).
Historically, fatness was viewed as a sign of wealth, signi-fying excess resources in settings where food shortages were common and also demonstrating that women were
well taken care of by their husbands(11).
This preference for a larger body size in women can be explained by evolutionary benefits. Prior to the industrialisa-tion of food producindustrialisa-tion, food shortages were common in all
societies; therefore, storing fat improved survival(10,12). This
was particularly important for women of childbearing age, meaning fatter women would be more successful in
preg-nancy and childbearing(10,13). Notwithstanding, in certain
African communities, weight gain during pregnancy is per-ceived negatively due to the fear of complications during
delivery(14–16). The belief that fatness represents an
advan-tage for pregnancy and childbearing might persevere in some African societies due to the persistence of
undernutri-tion secondary to poverty, particularly in rural areas(17),
potentially making fatness desirable, by setting one apart from the community and embodying excess in resource
poor settings(10). This is supported by the positive
associa-tion between socio-economic status (SES) and obesity in
low-income African countries(18,19), whereas in high-income
countries (HICs) the opposite is observed(20). In African
middle-income countries, the association between SES
and obesity is negative for women(20). Furthermore, Western
body size preferences have shifted towards a slimmer body
size, whilst the population’s mean BMI has increased,
sug-gesting that body size preferences evolve to contradict
soci-etal norms(21,22).
An aversion to ‘thinness’ may also exist in
low-income African countries because of stigmatisation associated with disease, for example, HIV and tuberculosis (TB)(23,24).
In addition to cultural factors contributing to body size preference, studies from HICs have reported that being
overweight, media exposure and psychological factors
contribute to higher body dissatisfaction(6,25–28). Younger
females are more likely to want to change their body size
to fit emerging societal norms valuing thinness(6). Therefore,
access to‘Western’ media in Africa might increase the value
of slimmer bodies, particularly amongst younger African females. Adolescence signifies the onset of puberty, which increases awareness of body image directly and indirectly
via a greater importance placed on peer perceptions(29).
Indeed, studies have reported an increased‘drive for
thin-ness’ in Black South African adolescents when compared
with their White South African counterparts. This contradicts
studies of fattening practices in African women(9,30). This
might be a result of transitioning cultural norms and genera-tional differences.
In light of the increasing obesity epidemic in African women and the contradictory results reported from the
studies discussed earlier(8,30–32), this paper presents the
results of a mixed methods systematic review, to assess body size preferences for African women and adolescent girls living in Africa and the factors influencing these preferences.
Methods
Review typology
A mixed methods systematic review was chosen as it
com-bines quantitative and qualitative evidence(33)generating a
complete, and deeper understanding of women’s body
size preferences and the factors influencing these (PROSPERO #: CRD42015020509).
Inclusion and exclusion criteria
Inclusion criteria were based on the SPIDER tool (Sample, Phenomenon of Interest, Design, Evaluation and Research Type) (Table 1). Studies conducted in any African country
among female adolescents (10–19 years) and women
(≥18 years) were included. The review focused exclusively
on Black African or Arab females. All studies that assessed preferred body size of African females (adolescent girls and women) using narrative and/or pictorial measures, and those that elicited factors influencing these preferences were included. Furthermore, studies assessing African
males’ preferences for African females’ body size were
included. All non-randomised quantitative, qualitative and mixed methods studies were eligible for inclusion.
Search strategy
The SPIDER tool was used to define search terms and
eligibility criteria(34). The search was conducted on
ASSIA, CINAHL, Medline, PsycINFO and Web of Science. Initial searches were conducted from 20/04/2015 until 15/05/2015. A supplementary search was then conducted, repeating the search strategies up to 31/08/2019. An
2 R Pradeilles et al.
example full search can be found in online Supplemental Material 1. Furthermore, the reference lists of studies included after full text screening were searched and topic experts consulted to identify additional studies.
Screening
Duplicates were removed in MS Excel before screening. All papers were first screened on titles and abstracts and then on full text in MS Excel (OO, EC, RP, MH, CBN). Reasons for exclusion were recorded at full-text stage (i.e. no measure of body size preferences or factors influ-encing these; data not stratified by gender, ethnic group or country). To ensure consistency in the application of inclusion criteria, two authors (HO and CBN) checked 10 % of all excluded documents screened. There was a good degree of concordance overall; discrepancies were resolved through discussion.
Data extraction
Data extraction of included studies was conducted in MS Excel by OO, EC, RP, MH, HO. Quantitative and qualitative data from mixed methods studies were extracted separately (see online Supplemental Material 2).
Data extracted from studies included general informa-tion (study ID, title, authors, date, study locainforma-tion (country, urban v. rural), study aim); study eligibility (participant selection, sample size, participant characteristics); method used to measure body image dimensions; ideal body size; body size self-assessment; body size self-satisfaction and factors influencing body size preferences. One author (RP) checked the full data extraction file to ensure accuracy and consistency across team members. Where data could not be extracted, authors were contacted to request rel-evant data, e.g. disaggregated data for pooled male and female samples.
Quality appraisal
The ‘Standard Quality Assessment Criteria for Evaluating
Primary Research Papers from a Variety of Fields’ (QualSyst)
was used to critically appraise both the quality of the studies
and their reporting(35). This tool was chosen because it
pro-vided a standard checklist for all study designs(35). Each
study included in the review was rated using a predefined list of criteria (n 14 for quantitative studies, n 10 for qualita-tive studies). The original tool was modified by replacing the score for each criterion (0, 1, 2) with a qualitative assessment of high quality/green (low risk of bias), medium quality/ yellow or low quality/red (high risk of bias) as the
Cochrane guidance advises against the use of scores(36).
Five authors (OO, EC, RP, MH, HO) independently con-ducted quality appraisal and this was double-checked by RP and EC. Discrepancies in the rating were discussed until agreement was reached.
Table 1 SPIDER brea kdown of resear ch ques tion and sea rch terms Categ ory Sam ple (S) P henome non of inter est (PofI) Design (D) Evalu ation (E) Resea rch type (R) Resear ch questio n Afric an fem ales and males, aged 10 and abov e res iding in Afric a P referred body size; desi re to gain or lose wei ght. Non-r andomis ed quantita tive stud ies; qualitati ve; mixe d meth ods Narra tive or picto rial ass essme nt; views; attitu des; opin ions Qual itative, quantita tive and mixed m ethods Asso ciated searc h terms All Africa n countr ies and reg ions liste d separatel y; Africa ; (ke yword and MeS H te rm); In itial sea rch: Body image; thinne ss; body size Not used in sea rch Body image ; body percepti on; body estee m; body satis faction ; thinnes s OR associa ted MeS H te rms Not used in search S uppleme ntary sea rch. Body Ima ge; body size; body wei ght; body estee m; weigh t con trol; body ideal; weigh t idea l; size idea l OR associa ted Me SH te rms Boolea n operato rs used OR OR N/A OR N/A Final Search Strate gy: S AND PofI or E * NOT Africa n-American AND *limited to humans.
Body size preferences for African females 3
Data synthesis
A sequential-explanatory approach was used to integrate
quantitative and qualitative evidence(37,38) (Fig. 1). In
phase one, quantitative studies were synthesised to define
African females’ body size preferences and the factors
influ-encing these. Phase two involved summarising the evi-dence from qualitative studies on factors influencing body size preferences, and phase three aimed at integrating findings from both quantitative and qualitative studies. The qualitative data synthesis provided contextual and cultural understanding of the quantitative data. Phase four focused on generating an integrated (quantitative and qualitative evidence) visual map to represent factors associated with body size preferences.
Phase 1: Summarising body size preferences quantitatively and factors influencing these
To identify and summarise body size preferences, we focused on three specific body image dimensions: ideal body size, body size self-assessment and body size
self-satisfaction(39).
Ideal body size, assessed with various body image (i.e. figural/photographic rating) scales in several quantita-tive and mixed methods studies, was synthesised graphically where possible. To facilitate the comparison
between studies using different scales, females’ ideal body
size mean and males’ ideal body size mean for women and
adolescent girls were converted into the four main BMI
categories: underweight, normal weight, overweight and obesity, through the Silhouette Photographs scale
present-ing a convenient body image metric(40).
For scales with real BMI values(40–42), we matched BMI
categories with each silhouette. For scales without real BMI values, we assigned a BMI category to each silhouette according to the BMI classification defined by authors of the selected articles below. For all articles using
the Figure Rating Scale (FRS)(43), the Body Image
Instrument(44), the Contour Drawing Rating Scale(45), the
Body Image Assessment for Obesity(46), the Ideal Body
Subscale(47), the Figural Stimuli(48), the Body Silhouette
Chart(49)and the Body Size Silhouettes(50), we used
respec-tively the BMI classification stated by Matoti-Mvalo and
Puoane(24), Pulvers et al.(44), Thompson and Gray(45),
Ettarh et al.(51), Cogan et al.(52), Duda et al.(48), Caradas
et al.(53) and Rguibi and Belahsen(8) (see online
Supplemental Material 3). We extracted the BMI
categories preferred by participants, defined from the ideal
body size mean and itsSDmeasured with the body image
scales.
Studies that measured ideal body size using a question-naire were summarised narratively. The second (i.e. body size assessment) and third (i.e. body size self-satisfaction) dimensions of body image were also summar-ised narratively.
To identify factors influencing body size preferences quantitatively, we summarised the associations between Fig. 1 (colour online) Visual model for mixed methods sequential explanatory design procedures
4 R Pradeilles et al.
a given factor and the outcome (i.e. either a preference for a slim(mer) or a large(r) body size).
Phase 2: Summarising qualitatively factors influencing body size preferences
Thematic synthesis was used to summarise qualitative
studies(54,55). Themes, defined as concepts that occurred
frequently across more than one article, were identified from the analysis of the extracted text.
Phase 3: Connecting the quantitative and qualitative phases
Summative content analysis(56)from quantitative data was
integrated into qualitative data synthesis. Factors identified from the quantitative and qualitative synthesis were grouped under four main overarching categories: socio-demographic, health-related, psycho-social and socio-cultural. These cat-egories were defined based on the findings that emerged.
Phase 4: Generating an integrated map of the factors influencing body size preferences
Evidence from all studies was summarised in a map with factors split into the four categories described above.
Results
Description of studies
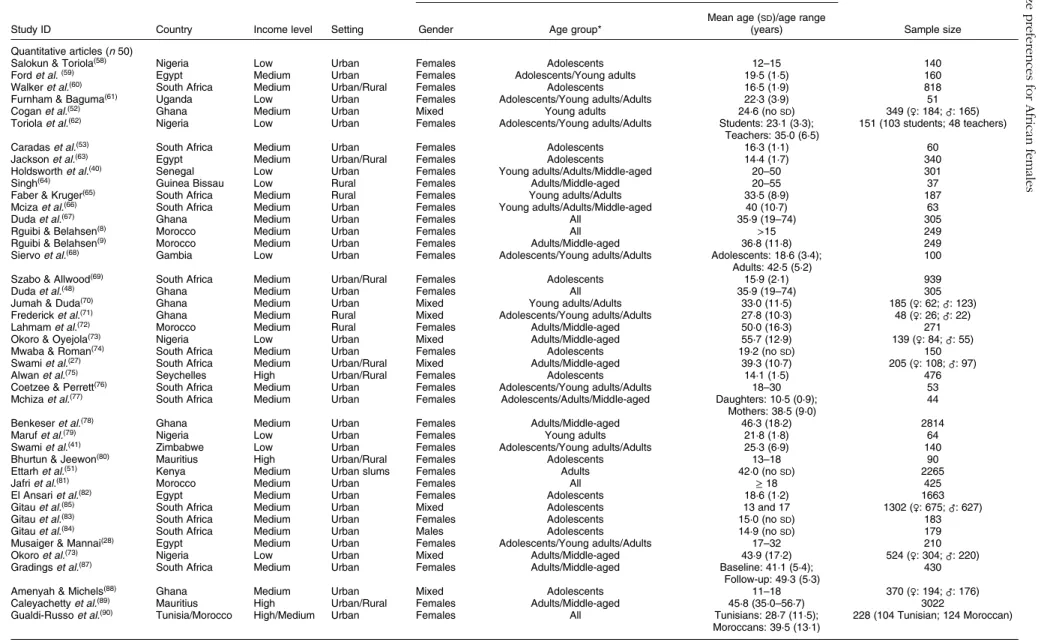
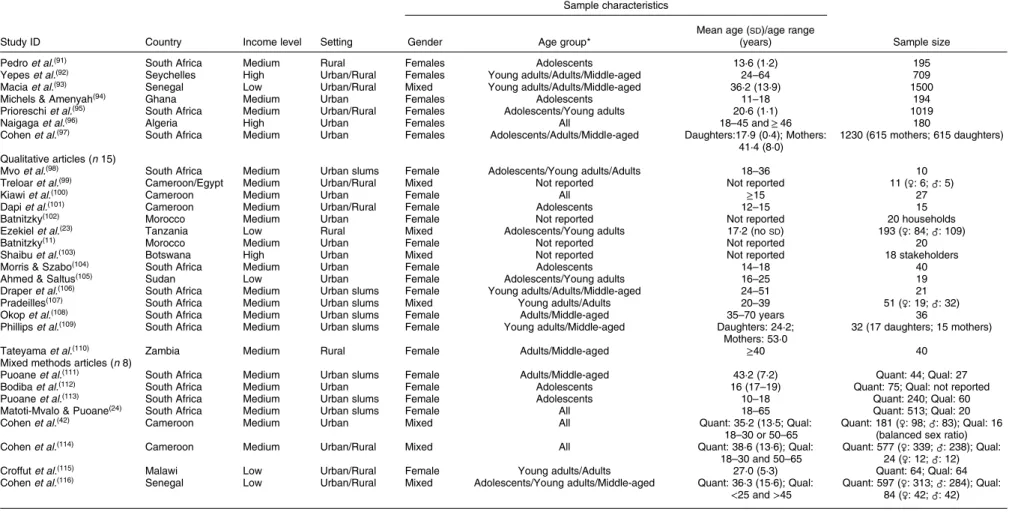
Seventy three articles were included (Fig. 2(57)). Studies were
conducted in 21/54 African countries and clustered particu-larly within three regions: Southern Africa, West Africa and East Africa, with a predominance in South Africa (Fig. 3). More studies took place in urban (n 51) than rural (n 7) settings; and 15 studies included data from both settings.
Of the seventy-three articles, fifty were quantita-tive(8,9,27,28,40,41,48,51–53,58–97), fifteen were qualitative(11,23,98–110)
Fig. 2 (colour online) Preferred reporting items for systematic reviews and meta-analyses flow diagram showing the selection of studies for the present systematic mixed-methods review
Body size preferences for African females 5
and eight mixed methods(24,42,111–116)(Table 2). All
quantita-tive studies utilised a cross-sectional design, with the exception
of one longitudinal design(87). A total of 25 512 females and
2090 males aged≥10 years from 17 African countries were
included. Twenty-three qualitative studies from ten countries were included. Data from 828 participants and twenty
house-holds aged 10–70 years were synthesised (sample sizes
between 10 and 193). Samples across studies were diverse in terms of age, SES, ethnicity, education and BMI.
Quality appraisal
The quality assessment (see online Supplemental Material 4) revealed that quantitative and qualitative studies sepa-rately scored highly on criteria such as question/objective sufficiently described, evident and appropriate study design and conclusions. Quantitative studies scored highly on well-defined outcome measures; however, some stud-ies reported poorly on subject selection and characteristics, estimate of variance and control for confounding. Similarly, in almost all qualitative studies, authors failed to show reflexivity and/or to report verification of the procedure to establish credibility.
Data synthesis
Body size preferences for African women and adolescent girls
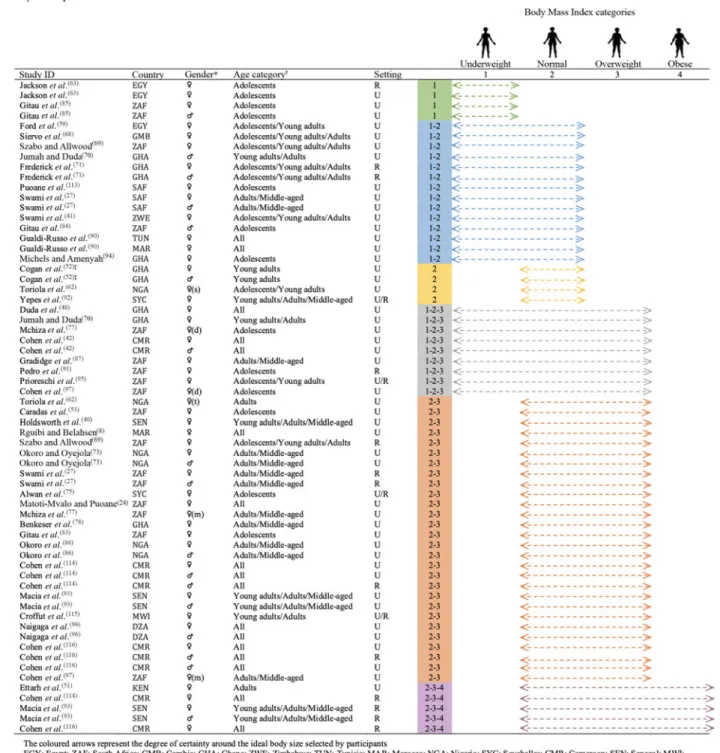
Dimension one: ideal body size. The majority of
quantitative and mixed methods studies (46/58 (79·3 %))
assessed African women’s body size ideals (see online
Supplemental Material 5). Most studies used body image scales whilst the remaining studies used questionnaires to capture the relationship between specific attributes (e.g. healthy, wealthy, dignified, respected) and different body sizes.
For studies using body image scales and for which a BMI category could be extracted, we found that, overall, participants in most studies preferred normal weight to overweight (Fig. 4). We observed a positive relationship
between age category and ideal body size, with valorisation
of underweight in some adolescent females(63,85)and
valor-isation of overweight in middle-aged women(27,73,77,78,86,97).
The rural–urban comparison showed that the ideal BMI
category was higher in rural than urban areas in South
Africa(27,69), Senegal(93,116)and Cameroon(114).
Few studies explored attributes associated with different
body sizes. One study(66) observed differences between
urban black and white South African women, especially
in middle-aged women, regarding the ‘normal’ and ‘fat’
attributes; and observed that black girls and their mothers
were less likely to associate‘fatness’ with being unhappy in
comparison with the white and mixed ancestry group.
Likewise, another study(65)found that more than 80 % of
black South African rural women disagreed that‘fat people
eat more than thin people’. Moreover, 25 % of these women
associated overweight with a lack of financial problems, and more women with a normal weight associated over-weight/obesity with food intake, compared with those overweight and obese. In a black township of Cape Town, 74 % of black females considered that being fat ‘made you dignified’ and 43 % believed that this weight
status led one to‘feel better about yourself’(111). Indeed,
a woman who was overweight was perceived as
‘well-liked’ (100 %), ‘proud of her movements’ (100 %), ‘healthy’
(100 %) and‘happy’ (94 %). However, a woman who was
‘thin’ was perceived by 33 %, 58 % and 60 % of the sample
as‘sick’, a ‘woman with worries’ and ‘not treated well by
her husband’, respectively.
Dimension two: body size self-assessment. In total, 19/58 (32·7 %) studies included information on body size self-assessment (see online Supplemental Material 5).
Using body image scales, one study(51)found that 34·6 %
of Kenyan women living in urban Nairobi underestimated their body weight; with 28·8 % of women who underesti-mated their weight classified as obese, a pattern also
observed in Cameroonian urban women(42). The same
was also observed with overweight/obesity in Nigerian students and South African black urban women, as well as in black schoolgirls, Algerian Saharawi refugees, urban Fig. 3 (colour online) Map displaying the African countries included in the review
6 R Pradeilles et al.
Table 2 Description of included studies
Study ID Country Income level Setting
Sample characteristics
Sample size Gender Age group*
Mean age (SD)/age range (years) Quantitative articles (n 50)
Salokun & Toriola(58) Nigeria Low Urban Females Adolescents 12–15 140 Ford et al.(59) Egypt Medium Urban Females Adolescents/Young adults 19·5 (1·5) 160 Walker et al.(60) South Africa Medium Urban/Rural Females Adolescents 16·5 (1·9) 818 Furnham & Baguma(61) Uganda Low Urban Females Adolescents/Young adults/Adults 22·3 (3·9) 51 Cogan et al.(52) Ghana Medium Urban Mixed Young adults 24·6 (noSD) 349 (♀: 184; ♂: 165) Toriola et al.(62) Nigeria Low Urban Females Adolescents/Young adults/Adults Students: 23·1 (3·3);
Teachers: 35·0 (6·5)
151 (103 students; 48 teachers) Caradas et al.(53) South Africa Medium Urban Females Adolescents 16·3 (1·1) 60
Jackson et al.(63) Egypt Medium Urban/Rural Females Adolescents 14·4 (1·7) 340 Holdsworth et al.(40) Senegal Low Urban Females Young adults/Adults/Middle-aged 20–50 301 Singh(64) Guinea Bissau Low Rural Females Adults/Middle-aged 20–55 37 Faber & Kruger(65) South Africa Medium Rural Females Young adults/Adults 33·5 (8·9) 187 Mciza et al.(66) South Africa Medium Urban Females Young adults/Adults/Middle-aged 40 (10·7) 63 Duda et al.(67) Ghana Medium Urban Females All 35·9 (19–74) 305 Rguibi & Belahsen(8) Morocco Medium Urban Females All >15 249 Rguibi & Belahsen(9) Morocco Medium Urban Females Adults/Middle-aged 36·8 (11·8) 249 Siervo et al.(68) Gambia Low Urban Females Adolescents/Young adults/Adults Adolescents: 18·6 (3·4);
Adults: 42·5 (5·2)
100 Szabo & Allwood(69) South Africa Medium Urban/Rural Females Adolescents 15·9 (2·1) 939 Duda et al.(48) Ghana Medium Urban Females All 35·9 (19–74) 305 Jumah & Duda(70) Ghana Medium Urban Mixed Young adults/Adults 33·0 (11·5) 185 (♀: 62; ♂: 123) Frederick et al.(71) Ghana Medium Rural Mixed Adolescents/Young adults/Adults 27·8 (10·3) 48 (♀: 26; ♂: 22) Lahmam et al.(72) Morocco Medium Rural Females Adults/Middle-aged 50·0 (16·3) 271 Okoro & Oyejola(73) Nigeria Low Urban Mixed Adults/Middle-aged 55·7 (12·9) 139 (♀: 84; ♂: 55) Mwaba & Roman(74) South Africa Medium Urban Females Adolescents 19·2 (noSD) 150 Swami et al.(27) South Africa Medium Urban/Rural Mixed Adults/Middle-aged 39·3 (10·7) 205 (♀: 108; ♂: 97) Alwan et al.(75) Seychelles High Urban/Rural Females Adolescents 14·1 (1·5) 476 Coetzee & Perrett(76) South Africa Medium Urban Females Adolescents/Young adults/Adults 18–30 53 Mchiza et al.(77) South Africa Medium Urban Females Adolescents/Adults/Middle-aged Daughters: 10·5 (0·9);
Mothers: 38·5 (9·0)
44 Benkeser et al.(78) Ghana Medium Urban Females Adults/Middle-aged 46·3 (18·2) 2814 Maruf et al.(79) Nigeria Low Urban Females Young adults 21·8 (1·8) 64 Swami et al.(41) Zimbabwe Low Urban Females Adolescents/Young adults/Adults 25·3 (6·9) 140 Bhurtun & Jeewon(80) Mauritius High Urban/Rural Females Adolescents 13–18 90 Ettarh et al.(51) Kenya Medium Urban slums Females Adults 42·0 (noSD) 2265
Jafri et al.(81) Morocco Medium Urban Females All ≥ 18 425
El Ansari et al.(82) Egypt Medium Urban Females Adolescents 18·6 (1·2) 1663 Gitau et al.(85) South Africa Medium Urban Mixed Adolescents 13 and 17 1302 (♀: 675; ♂: 627) Gitau et al.(83) South Africa Medium Urban Females Adolescents 15·0 (noSD) 183 Gitau et al.(84) South Africa Medium Urban Males Adolescents 14·9 (noSD) 179 Musaiger & Mannai(28) Egypt Medium Urban Females Adolescents/Young adults/Adults 17–32 210 Okoro et al.(73) Nigeria Low Urban Mixed Adults/Middle-aged 43·9 (17·2) 524 (♀: 304; ♂: 220) Gradings et al.(87) South Africa Medium Urban Females Adults/Middle-aged Baseline: 41·1 (5·4);
Follow-up: 49·3 (5·3)
430 Amenyah & Michels(88) Ghana Medium Urban Mixed Adolescents 11–18 370 (♀: 194; ♂: 176) Caleyachetty et al.(89) Mauritius High Urban/Rural Females Adults/Middle-aged 45·8 (35·0–56·7) 3022 Gualdi-Russo et al.(90) Tunisia/Morocco High/Medium Urban Females All Tunisians: 28·7 (11·5);
Moroccans: 39·5 (13·1) 228 (104 Tunisian; 124 Moroccan) Body size preferences for African females 7 Downloaded from https://www.cambridge.org/core . 27 May 2021 at 14:17:25
Table 2 Continued
Study ID Country Income level Setting
Sample characteristics
Sample size Gender Age group*
Mean age (SD)/age range (years)
Pedro et al.(91) South Africa Medium Rural Females Adolescents 13·6 (1·2) 195 Yepes et al.(92) Seychelles High Urban/Rural Females Young adults/Adults/Middle-aged 24–64 709 Macia et al.(93) Senegal Low Urban/Rural Mixed Young adults/Adults/Middle-aged 36·2 (13·9) 1500 Michels & Amenyah(94) Ghana Medium Urban Females Adolescents 11–18 194 Prioreschi et al.(95) South Africa Medium Urban/Rural Females Adolescents/Young adults 20·6 (1·1) 1019 Naigaga et al.(96) Algeria High Urban Females All 18–45 and ≥ 46 180 Cohen et al.(97) South Africa Medium Urban Females Adolescents/Adults/Middle-aged Daughters:17·9 (0·4); Mothers:
41·4 (8·0)
1230 (615 mothers; 615 daughters) Qualitative articles (n 15)
Mvo et al.(98) South Africa Medium Urban slums Female Adolescents/Young adults/Adults 18–36 10 Treloar et al.(99) Cameroon/Egypt Medium Urban/Rural Mixed Not reported Not reported 11 (♀: 6; ♂: 5)
Kiawi et al.(100) Cameroon Medium Urban Female All ≥15 27
Dapi et al.(101) Cameroon Medium Urban/Rural Female Adolescents 12–15 15 Batnitzky(102) Morocco Medium Urban Female Not reported Not reported 20 households Ezekiel et al.(23) Tanzania Low Rural Mixed Adolescents/Young adults 17·2 (noSD) 193 (♀: 84; ♂: 109) Batnitzky(11) Morocco Medium Urban Female Not reported Not reported 20 Shaibu et al.(103) Botswana High Urban Mixed Not reported Not reported 18 stakeholders Morris & Szabo(104) South Africa Medium Urban Female Adolescents 14–18 40 Ahmed & Saltus(105) Sudan Low Urban Female Adolescents/Young adults 16–25 19 Draper et al.(106) South Africa Medium Urban slums Female Young adults/Adults/Middle-aged 24–51 21 Pradeilles(107) South Africa Medium Urban slums Mixed Young adults/Adults 20–39 51 (♀: 19; ♂: 32) Okop et al.(108) South Africa Medium Urban slums Female Adults/Middle-aged 35–70 years 36 Phillips et al.(109) South Africa Medium Urban slums Female Young adults/Middle-aged Daughters: 24·2;
Mothers: 53·0
32 (17 daughters; 15 mothers) Tateyama et al.(110) Zambia Medium Rural Female Adults/Middle-aged ≥40 40
Mixed methods articles (n 8)
Puoane et al.(111) South Africa Medium Urban slums Female Adults/Middle-aged 43·2 (7·2) Quant: 44; Qual: 27 Bodiba et al.(112) South Africa Medium Urban Female Adolescents 16 (17–19) Quant: 75; Qual: not reported Puoane et al.(113) South Africa Medium Urban slums Female Adolescents 10–18 Quant: 240; Qual: 60 Matoti-Mvalo & Puoane(24) South Africa Medium Urban slums Female All 18–65 Quant: 513; Qual: 20 Cohen et al.(42) Cameroon Medium Urban Mixed All Quant: 35·2 (13·5; Qual:
18–30 or 50–65 Quant: 181 (♀: 98; ♂: 83); Qual: 16(balanced sex ratio) Cohen et al.(114) Cameroon Medium Urban/Rural Mixed All Quant: 38·6 (13·6); Qual:
18–30 and 50–65 Quant: 577 (♀: 339; ♂: 238); Qual:24 (♀: 12; ♂: 12) Croffut et al.(115) Malawi Low Urban/Rural Female Young adults/Adults 27·0 (5·3) Quant: 64; Qual: 64 Cohen et al.(116) Senegal Low Urban/Rural Mixed Adolescents/Young adults/Middle-aged Quant: 36·3 (15·6); Qual:
<25 and >45 Quant: 597 (♀: 313; ♂: 284); Qual:84 (♀: 42; ♂: 42)
♀: females; ♂: males.
*Age group: adolescents: 10–19; young adults: 20–25; adults: 25–44 and middle-aged: 45þ.
8 R Pradeilles et al. Downloaded from https://www.cambridge.org/core . 27 May 2021 at 14:17:25
Tunisian, Moroccan and Malawian women(24,53,79,87,90,96,97,115).
Only 37·1 % of Ghanaian women living in Accra perceived their current body size as overweight or obese, even though
49·9 % were in these weight categories(70), a pattern also
observed by others in the same city(48,78).
Using questionnaire items in rural Morocco, almost all (99·2 %) women who were overweight/obese underesti-mated their body weight status, which increased with
age(72). Similarly, 89 % of middle-aged South African black
women living in Cape Town were happy with their weight,
whereas most of them were overweight or obese(66).
Likewise, approximately two-thirds of Black women with overweight/obesity in Cape Town did not perceive
them-selves as such(111). Finally, in urban Cameroon, 37·5 %
of women considering themselves normal weight were
overweight or obese(42).
Fig. 4 (colour online) Body size ideals for African women and adolescent girls
Body size preferences for African females 9
Using body image scales, most adolescent Egyptian schoolgirls estimated their body weight accurately along
the spectrum of BMI categories(63). Similarly, in the
Seychelles, 24 % of adolescent girls of normal weight
con-sidered themselves overweight,(75)and in Mauritius most
adolescent girls who classified themselves as overweight
were in fact normal weight(80).
Dimension three: body size self-satisfaction. Overall, 44/58 (75·9 %) studies included information on body size self-satisfaction (see online Supplemental Material 5).
Of the studies that assessed satisfaction using scales (n 24), seventeen found a positive Feel minus Ideal
Discrepancy (FID) (i.e. current > ideal), meaning that
women and/or adolescent girls wanted to lose
weight(27,42,48,53,59,66,69,71,73,79,87,90,91,95,97,114,116). A further
five studies found a negative FID (i.e. current < ideal),
meaning that women and or/adolescent girls wanted to
gain weight(41,52,62,86,115) and two found mixed results.
The two studies reporting mixed results included Mchiza
et al.(77)with a positive FID among mothers and null FID
(i.e. satisfied with current weight) among black girls,
and Siervo et al.(68)with a positive FID among middle-aged
women and a negative FID among young women.
Of the studies that assessed satisfaction using
questionnaires (n 30), ten found that women who were overweight or obese were satisfied with their current body size(8,40,51,60,65,75,78,80,88,97). The percentage of participants
with a BMI≥ 25 kg/m2who were satisfied with their current
weight ranged from 10·5 % (obese women only)(40) to
95·0 % (overweight women only)(65). For all papers
report-ing prevalence of body satisfaction among women who were overweight or obese separately, we found that the percentage of satisfaction was higher among women who were overweight, indicating that they were overall more satisfied with their body size in comparison with
women who were obese(8,40,51,65,78). One study conducted
in South Africa(97)found that the level of body satisfaction
was slightly higher among mothers (28·0 %) when compared
with their daughters (23·1 %) (both had a BMI≥ 25 kg/m2),
and another study in South Africa(60)showed that body
sat-isfaction was higher among women who were overweight or obese in rural areas (61·4 %) compared with those in urban areas (32·3 %). Eleven studies reported information
on the proportion of participants with a BMI≥ 25 kg/m2
wanting to be larger(8,40,51,65,72,75,78,80,88,96,97). We found that
this phenomenon ranged from none in the Seychelles(75),
Mauritius(80)and Algeria(96)to 45·5 % in Morocco(72).
Of the studies that assessed satisfaction using question-naires (n 30), eight found underweight participants
(BMI< 18·5 kg/m2) were satisfied with their current body
weight(8,40,51,60,78,80,88,97). The proportion of participants
satisfied ranged from 2·3 % amongst women in urban
Ghana(78) to 95·5 % amongst adolescent girls in rural
South Africa(60). A study comparing body satisfaction among
mothers and daughters who had a BMI< 18·5 kg/m2
showed that daughters were more satisfied with their body
size (45·9 %) in comparison with mothers (22·2 %), meaning that younger generations might have a preference
for slimmer bodies(97). Six studies reported information
on the proportion of participants with a BMI< 18·5 kg/m2
willing to lose weight(8,9,40,78,80,97). We found that the
preva-lence of women who were underweight and wanted to be
slimmer ranged from none in Morocco(8,9) to 33·3 % in
Mauritius(80).
Factors influencing body size preferences: quantitative and qualitative evidence
Twenty-nine quantitative studies and twenty-three qualita-tive studies (including eight mixed-methods studies) reported factors associated with body size preferences (see online Supplemental Material 5). For both types of studies, factors were grouped into four overarching
themes (socio-demographic, health-related,
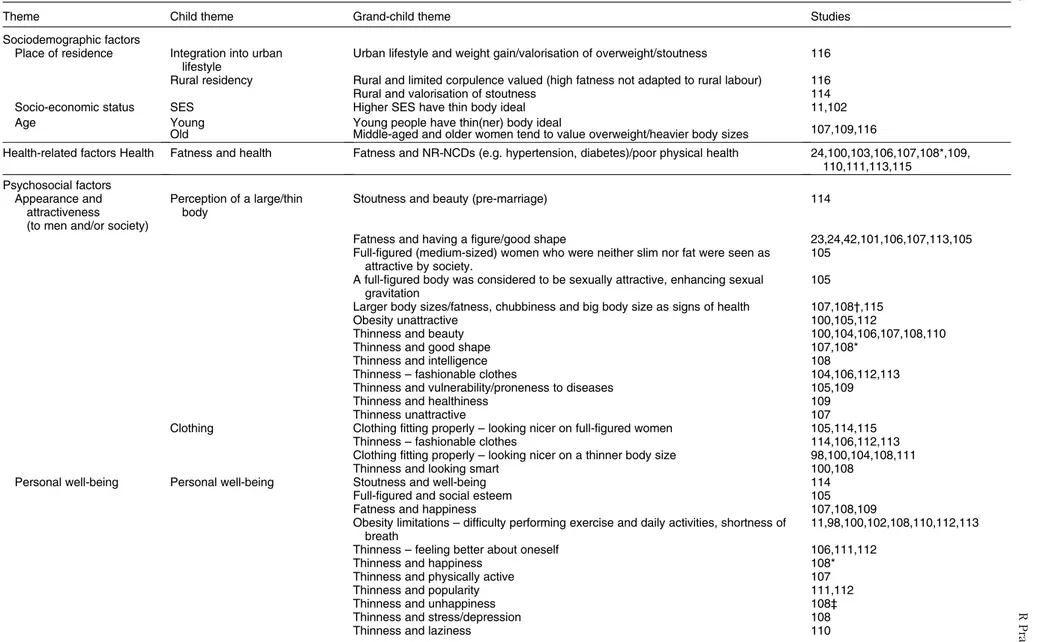
psycho-social and socio-cultural), and their influence on preferred body size (i.e. preference for a slim(mer) or a large(r) body size) indicated (Tables 3 and 4). Eleven analytical themes emerged from qualitative studies (Table 5). The integrated results are discussed below and summarised in Fig. 5.
Socio-demographic factors
The quantitative evidence showed that increased
SES(40,48,92), non-manual occupations(92)and living in urban
areas(27,63,69) were associated with slimmer body size
preferences. Rural residency was associated with a greater
preference for a larger body size,(27,63,69,116)whilst marriage
was associated with a lower preference for a larger body size(8,78). Younger participants had a greater preference
for slimmer body sizes in Senegal(40), Ghana(67,78),
Gambia(68), South Africa(27) and the Seychelles(92), but a
greater preference for a larger body size in three studies
conducted in Morocco(8,72,81). Increased years of formal
education was associated with a greater preference for both
slimmer body size ideals in Ghana(48), Cameroon(41) and
Seychelles(92)and larger body size ideals in Morocco(8,81).
However, one study(78) in Ghana found that increased
years of formal education was associated with a lower pref-erence for larger body size but this was NS.
The qualitative evidence revealed that higher SES(11,102)
and younger participants(107,109,116)had slimmer body size
preferences. Valorisation of stoutness was found in both
urban Senegal(116) and rural Cameroon(114), especially in
middle-aged and older women. However, high fatness was not valued by younger and also older women in rural Senegal, as it was deemed ill-adapted to rural labour and
hence, not valued(116).
‘If you are too rey [stout] in the village, you will not be
able to work or cultivate: : : ’ (middle-aged woman,
urban, Senegal)(116)
10 R Pradeilles et al.
Table 4 Factors associated with a preference for a large(r) body size among African women and adolescent girls from the quantitative evidence synthesis Study ID Jacks on et al (6 3 ) F reder ic k et al (7 1 ) Ho ld swo rt h e t a l (4 0 ) Fa b er & K ru g er (6 5 ) Rg u ib i & B el ah se n (8 ) S zabo & A ll w ood (6 9 ) L ahmam et al (7 2 ) S w ami et al (2 7 ) Al wa n e t a l (75 ) B enkes er et al (78 ) Co h en e t a l (4 2 ) Ja fri e t a l (8 1 ) O kor o et al (86 ) A m enyah & M ic hel s (8 8 ) Pe d ro e t a l (9 1 ) P ri o re sc hi et al (95) Cro ffu t e t a l (1 1 5 ) C o hen et al (1 1 6 ) Socio-demographic factors Age Education Urban residence Rural residence Marital status (married) Health -related factors Individual’s BMI category (normal) Individual’s BMI category (OW/OB) Individual’s BMI category (UW) Individual’s BMI
Pubertal status (mid to post pubertal girls) Perceived health status/healthiness Psycho -social factors Weight perception (UW) - women Avoidance of HIV stigma
EAT- 26 score >20 *
Socio-cultural factors
Spouse (men’s or partner’s) opinion §
positive relationship & significant association; negative relationship & significant association; positive relationship & no significant association; negative relationship & no significant association; positive relationship but no test of association performed; negative relationship but no test of association performed; § This finding relates to girl’s perspective about what males prefer for females (only significant for overweight girls); *This relationship was found for rural residents only
Table 3 Factors associated with a preference for a slim(mer) body size among African women and adolescent girls from the quantitative evidence synthesis
positive relationship & significant association; negative relationship & significant association; positive relationship & no significant association; negative relationship & no significant association; positive relationship but no test of association performed; negative relationship but no test of association performed; *This relationship was found for urban residents only
Study ID Ja cks on et al (6 3 ) H o ld sw o rth e t a l (4 0 ) F aber & K ruger (6 5 ) D u da et al (6 7 ) R gui bi & B el ahs en (8) S ier vo et al (6 8 ) S za b o & A llw o o d (6 9 ) D u da et al (4 8 ) Ju mah & D u da (7 0 ) S w ami et al (2 7 ) Al wa n e t a l (7 5 ) B enkes er et al (7 8 ) M ar u f et al (7 9 ) B hur tu n &J ee w o n (80 ) C ohen et al (4 2 ) Gi ta u e t a l (8 5 ) Mu sa ig er & Ma n n ai (28 ) G radi d ge et al (87) Pe d ro e t a l (91) Y epes et al (9 2 ) Pr io re sc h i e t a l (9 5) C ohen et al (9 7) Socio-demographic factors Women’s age Men’s age Socio-economic status Education Urban residence Rural residence Occupation (non-manual) Health -related factors Individual’s BMI (OW/OB) (women) Individual’s BMI (UW/NW) (women) Individual’s BMI (women) Individual’s BMI (men)
Concern about NR-NCDs (diabetes, hypertension, stroke) Concern about overall health
Waist and hip circumference Central & peripheral adiposity Total fat and fat free soft tissue mass Nulliparous (vs. parous) Psycho -social factors Appearance/desire to look better
EAT-26 score >20 (i.e. high level of concern about dieting/body weight)
* Clothing (i.e. clothes too tight)
Weight perception (OW/OB or overestimation) Socio-cultural factors
Spouse (men’s or partner’s) opinion Men’s exposure to ‘western’ media
Women’s exposure to western/mass media, magazines and fashion TV Mother’s willingness to be slimmer
Concern about being competitive on the job market
Body size preferences for African females 11
Table 5 Factors influencing body size preferences for African women and adolescent girls from the qualitative evidence synthesis
Theme Child theme Grand-child theme Studies
Sociodemographic factors
Place of residence Integration into urban
lifestyle
Urban lifestyle and weight gain/valorisation of overweight/stoutness 116
Rural residency Rural and limited corpulence valued (high fatness not adapted to rural labour) 116
Rural and valorisation of stoutness 114
Socio-economic status SES Higher SES have thin body ideal 11,102
Age Young Young people have thin(ner) body ideal
107,109,116
Old Middle-aged and older women tend to value overweight/heavier body sizes
Health-related factors Health Fatness and health Fatness and NR-NCDs (e.g. hypertension, diabetes)/poor physical health 24,100,103,106,107,108*,109,
110,111,113,115 Psychosocial factors
Appearance and attractiveness (to men and/or society)
Perception of a large/thin body
Stoutness and beauty (pre-marriage) 114
Fatness and having a figure/good shape 23,24,42,101,106,107,113,105
Full-figured (medium-sized) women who were neither slim nor fat were seen as attractive by society.
105 A full-figured body was considered to be sexually attractive, enhancing sexual
gravitation
105
Larger body sizes/fatness, chubbiness and big body size as signs of health 107,108†,115
Obesity unattractive 100,105,112
Thinness and beauty 100,104,106,107,108,110
Thinness and good shape 107,108*
Thinness and intelligence 108
Thinness– fashionable clothes 104,106,112,113
Thinness and vulnerability/proneness to diseases 105,109
Thinness and healthiness 109
Thinness unattractive 107
Clothing Clothing fitting properly– looking nicer on full-figured women 105,114,115
Thinness– fashionable clothes 114,106,112,113
Clothing fitting properly– looking nicer on a thinner body size 98,100,104,108,111
Thinness and looking smart 100,108
Personal well-being Personal well-being Stoutness and well-being 114
Full-figured and social esteem 105
Fatness and happiness 107,108,109
Obesity limitations– difficulty performing exercise and daily activities, shortness of breath
11,98,100,102,108,110,112,113
Thinness– feeling better about oneself 106,111,112
Thinness and happiness 108*
Thinness and physically active 107
Thinness and popularity 111,112
Thinness and unhappiness 108‡
Thinness and stress/depression 108
Thinness and laziness 110
12 R Pradeilles et al. Downloaded from https://www.cambridge.org/core . 27 May 2021 at 14:17:25
Table 5 Continued
Theme Child theme Grand-child theme Studies
Fatalistic attitudes toward body size
Aetiology of thinness/fatness
Body size is God given 11,100,102
Body size is driven by genetic 100,108,113
Fatness caused by pregnancy 11,102,110
Fatness caused by medication (e.g. ART treatment) 98,110
Overweight caused by inability to afford good quality meat 111
Obesity attributed to laziness, sluggishness, stigma and tiredness 108
Fatness and unhealthy eating (both in quality and quantity) 98,99,106,108, 111,113
Weight gain from stress 98,99,111
Thinness and eating too little or not healthily 107,108
Weight loss from stressful times (e.g. stress, financial problems, social problems, physical abuse, drug abuse)
98,104,108 Socio-cultural factors
Negative treatment by the community
Thinness and misfortune Thinness and poverty/failure in life 42,100,106
Thinness and perception that family cannot afford food 105
Stigma Thinness/weight loss associated with sickness, e.g. HIV/AIDS, TB, cancer, anorexia 23,24,100,103,104,106,107,
108,110,111,113
Social discrimination against overweight 98,103,104,112,113
Acculturative stress Media Thinness and modelling 101,104,113
Media promotion of thin and thinness 104,112,116
Ethnicity Pressure from other ethnic groups to be thin 98,104
Happy to accept African heritage
Cultural norms/identify Fatness as norm/African heritage - Full figured preservation of identity 42,104,105,106,107,108,110,112
Thinness classed as‘un-African’ 107
Social Standing Respectability in community Fatness and doing well in life 23,24,42,99,100,103,111,113,114
Fatness and increased chances of getting married 109
Body size after marriage/fatness or weight gain after marriage symbol of the capacity of the husband to look after his family
99,100,111,114
Stoutness/fatness and fertility 107,114
Fatness and ability to take good care of family 24,99,110,114
Fatness and dignity/respect for a woman and her family 107,108
Fatness as a symbol of wealth and prosperity/full figured and economic standing 105,108,110,114,116
Fatness and capability/strength 23,24,42,101, 107,111,113
Thinness and strength 107
Thinness and affluence 11,102
*Found for normal weight women only. †Found in overweight/obese women. ‡Found in obese women.
Body size preferences for African females 13 Downloaded from https://www.cambridge.org/core . 27 May 2021 at 14:17:25
Health-related factors BMI
Individual BMI was associated with body size preference, although mixed results were found.
Overall, increased BMI in women was positively
associ-ated with a greater preference for slimmer body sizes(69,78),
with the exception of one study(91), and negatively
associ-ated with a preference for a large(r) body size(8,69). One
study also found a negative association between men’s
individual BMI and a preference for slimmer female body
sizes(27).
Women who were overweight or obese had a predominantly greater preference for a slimmer body size(8,40,67,79,87,95,97). Similarly, a greater waist and hip
cir-cumference, central and peripheral adiposity and total fat and fat free soft tissue mass were positively associated with slimmer body size preferences or participants desire for
weight loss(87). Being overweight or obese was also
signifi-cantly associated with a lower preference for a larger body size(72,95), with the exception of one study in South Africa,
for which the association was positive(91).
Women who were underweight or normal weight had either a greater preference for a slimmer body size/lower
preference for a larger body size(80,81,88)or a greater
prefer-ence for a large(r) body size(40,95).
Concern about health
Two quantitative studies found that participants
who reported being concerned about their overall health status or the possibility of developing nutrition-related noncommunicable diseases had a greater preference
for a slimmer body size(67,70). The relationship between
overweight/fatness and nutrition-related noncommuni-cable diseases was reported in eleven qualitative
studies(24,100,103,106–111,113,115). As a result, some participants
wanted to lose weight for health reasons.
‘I heard that when a person is fat there are a lot of fats and oils in the body, which may result in
some diseases, like hypertension and diabetes’ : : :
’I would like to have medium [overweight] body, because sometimes when you are too fat, it
becomes difficult to walk’ (adult women, urban/rural,
Malawi)(115)
Fig. 5 (colour online) Integrated map of the factors influencing body size preferences for African women and adolescent girls
14 R Pradeilles et al.
Biological factors
Being nulliparous(48)was associated with a greater
prefer-ence for a slimmer body size whilst pubertal status (i.e. mid
to post-pubertal girls)(91)was associated with a preference
for a larger body size.
Psycho-social factors Appearance and attractiveness
Quantitative studies reported a positive association between appearance or a desire to look better and a
pref-erence for a slimmer body size(80,82). Likewise, clothing
(i.e. clothes too tight) was positively associated with a
desire for a slimmer body size(69,83).
Appearance and attractiveness to men and/or society was a theme that emerged in most of the qualitative studies. An important aspect of appearance was the way clothing fell on different body sizes. Participants were motivated to lose weight to fit into their old clothes, to look smart or because they felt that clothes on thinner body sizes
looked nicer(98,100,104,108,111).
‘Being overweight does not look nice, people often
think that you are pregnant’ : : : ‘Bigger clothes are
more expensive and less pretty’ (adult/middle-aged
women, urban, South Africa)(111)
Four studies reported that fashionable clothes only came in smaller sizes and would therefore only fit slim
people(104,106,112,113). However, the importance of filling
out clothes to showcase one’s figure was also reported in
three studies(105,114,115).
Body size was associated with physical attractiveness,
which in turn equated to a better chance of‘getting a
boy-friend or husband’. In six studies, thinness was associated
with beauty and good shape(100,104,106–108,111), and three
studies reported ‘fatness’ as unattractive and diminishing
one’s chances of securing a boyfriend/husband(100,105,112).
On the other hand, one study associated stoutness with
beauty in women pre-marriage(114) and seven studies
associated‘being fat’, particularly having large hips, with
‘having a figure’ or a ‘good shape’(23,24,41,101,106,107,113).
‘Our culture says that we are supposed to be fat. You must have structure, you must be beautiful. In other words, our culture does not allow women to be thin.
They say that someone who is fat is sexier’. (adult/
middle-aged woman, urban, South Africa)(106)
To have a good figure, it was seen as important that women
gained weight proportionally and did not get too fat(42).
It was seen as particularly important that women were not physically restricted by their body size, otherwise their fatness shifted into the realm of being perceived as a result of greed or laziness. In another study, full-figured women
(defined as women of a ‘medium size’, neither slim nor
fat by investigators) were seen as attractive by society and
were considered to be sexually attractive, enhancing sexual
gravitation(105). Body size was also associated with
intelli-gence (thin women were perceived as smart)(108)and health,
but the evidence was mixed for the latter. In two studies, we
found that thinness was associated with good health(105,109)
whilst in three other studies, we found that being overweight
was a sign of perceived good health(107,108,115).
Body size perception
An overestimation of body size or perception of self as overweight/obese was significantly associated with a
pref-erence for a slimmer body size(75,80), whereas women who
perceived themselves as underweight had a greater
prefer-ence for a larger body size(75). In one study(95), an EAT-26
score>20, which indicates a high level of concern about
diet-ing, body weight or problematic eating behaviours, was associated with either a greater preference for a slimmer body size (urban residents) or larger body size (rural residents).
Avoidance of HIV stigma
One quantitative study found a positive association between avoiding HIV stigma and a preference for a
large(r) body size(115).
Personal well-being
Perceptions attached to body size and personal well-being were discussed by participants in most of the qualitative studies. In five studies, fatness or a full-figured body size
was associated with well-being(114), social esteem(105)and
happiness(107–111).
‘If a person is fat [overweight], we usually assume she
is happy and has a lot of money. It’s evident that
he/she eats nicely’ (middle-aged woman, urban,
South Africa)(108)
However, the difficulties associated with obesity (i.e. diffi-culty performing exercise and daily activities and shortness
of breath) were also highlighted(11,98,100,102,108,111–113).
‘I think there is nothing good about being fat because you are constantly sick, and you constantly have
pains’ (adolescent girl, urban, South Africa)(113)
The results on thinness were mixed with studies high-lighting an association between thinness and markers
of personal well-being, such as self-esteem(106,111,112),
hap-piness(108), being physically active(107)and popularity(111,112)
and other studies providing evidence of an association
between thinness and unhappiness(108), stress/
depression(108)and laziness(110).
Fatalistic attitudes towards body size
Various reasons were proposed as‘causing’ obesity, many
of which are founded in scientific evidence, ranging
from unhealthy eating in terms of quantity and
quality(98,99,106,108,111,113), stress(98,99,111), medication (e.g.
Body size preferences for African females 15
anti-retroviral treatment)(98,110), genetics(100,108,113),
pregnancy(11,102,111)and laziness(108).
‘There are people who are born fat even though
they try to lose weight’ (adolescent girl, urban,
South Africa)(113)
However, the belief that obesity was ‘God-given’ also
emerged(11,100,102):
‘I used to be thin before I had children. Then slowly after each child I became bigger. This is what Allah
intends for a mother to look like’ (woman, urban,
Morocco)(11)
This fatalistic belief can lead to participants accepting their
body size and being less motivated to lose weight(11,100).
Factors influencing thinness included stress(98,104,108) and
eating too little(107,108).
Socio-cultural factors Family influence
From the quantitative evidence, males’ or husbands’
opinions(42,65,67,71,86,88,116) and mothers’ opinions(97)
influ-enced women’s body size preferences. This was a positive
influence for a preference for a slimmer body and mixed for a preference for a large(r) body size.
Negative treatment by the community
Thinness and/or weight loss were associated with misfortune in four studies. A person who was thin was seen as being too poor to afford food, or having failed in life(42,100,105,106).
‘My parents also put pressure on me, always commenting on my weight and why I look so thin. They think that being thin is a stigma as people might
think that the family cannot afford to buy food’
(adolescent girl, urban, Sudan)(105)
Activities associated with trying to lose weight, such as
walking, were also associated with poverty(100,106).
Being thin or losing weight was also strongly associated with illness, particularly with HIV and/or TB(23,24,100,103,104,106–108,110,111,113). Participants preferred
not to embody these factors– poverty, HIV and TB – as they
are associated with being gossiped about and shunned. Even participants who were aware of the health risks of being overweight and acknowledged that it was impossible to tell if someone has HIV just from their body size still preferred to gain weight or remain overweight to avoid
being ostracised(106).
‘She would not be happy [to lose weight] because in our community it would be perceived that there is something wrong with her. She would think that the community is looking at her, so she would feel insecure. They would judge her because they say the person is sick and now wants to cover it up by
dieting and exercise’ (adult/middle-aged woman,
urban, South Africa)(106)
However, five studies, mainly involving secondary school pupils, reported bullying and exclusion of individuals who
were overweight(98,103,104,112,113).
Cultural norms, identity and acculturative stress
Two quantitative studies provided evidence for a positive association between exposure to media and
a preference for a slimmer body size(27,28). One Egyptian
study(28)found that the risk that pictures in female
maga-zines would influence girls’ ideas of a perfect body shape
was almost three times higher among female students who were exposed to magazines v. not or less frequently exposed. An association between television exposure
and female students’ ideas of a perfect body shape was
also observed.
If having a large body size was seen as a traditional
African ideal or heritage(42,104,105–108,110,112), the media’s
promotion of thinness was viewed as the antithesis to this
tradition(104,112,116). Participants reported feeling pressure
and disappointment from the media’s constant promotion
of the thin ideal(104,112).
‘I hate the media’s emphasis on weight loss because we cannot all be the same. Some people are born thin and others fat. This emphasis makes people think that
fat is unacceptable and ugly’ (adolescent girl, urban,
South Africa)(112)
Some participants wanted to be thin like models because they aspired to a modelling career, or because it was
fashionable(101,104,113). Only secondary school pupils
reported these views. Black South African participants also reported negative comments from White and Mixed-Ancestry friends/colleagues as influencing their percep-tions of body size ideals and causing insecurity in their
African heritage beliefs(98,104).
Social standing
Body size was viewed as an embodiment of community respectability. Fatness in women pre-marriage was
impor-tant as it increased their chances of marriage(109). A woman
who gained weight soon after marriage was viewed with pride by her in-laws and respected by the community, as her weight gain symbolised being well cared for by her husband and more capable of being fertile and caring for
her family(24,99,100,107,108,110,111,114).
‘For a woman, being overweight suggests that her husband takes good care of her, that he is comfortable,
he has money’ (adult woman, urban, Cameroon)(114)
A large body size was also associated with general
capability, strength, doing well in life(23,24,42,99–101,103,107,111,113)
and also represented a symbol of wealth and
prosperity(105,108,110,113,116). On the other hand, three studies
reported that thinness was associated with affluence(11,102)
and strength(107).
16 R Pradeilles et al.