Publisher’s version / Version de l'éditeur:
Journal of Thermal Insulation and Building Envelopes, 17, 2, pp. 78-88,
1993-10-01
READ THESE TERMS AND CONDITIONS CAREFULLY BEFORE USING THIS WEBSITE.
https://nrc-publications.canada.ca/eng/copyright
Vous avez des questions? Nous pouvons vous aider. Pour communiquer directement avec un auteur, consultez la première page de la revue dans laquelle son article a été publié afin de trouver ses coordonnées. Si vous n’arrivez pas à les repérer, communiquez avec nous à [email protected].
Questions? Contact the NRC Publications Archive team at
[email protected]. If you wish to email the authors directly, please see the first page of the publication for their contact information.
NRC Publications Archive
Archives des publications du CNRC
This publication could be one of several versions: author’s original, accepted manuscript or the publisher’s version. / La version de cette publication peut être l’une des suivantes : la version prépublication de l’auteur, la version acceptée du manuscrit ou la version de l’éditeur.
For the publisher’s version, please access the DOI link below./ Pour consulter la version de l’éditeur, utilisez le lien DOI ci-dessous.
https://doi.org/10.1177/109719639301700207
Access and use of this website and the material on it are subject to the Terms and Conditions set forth at
Predicting field thermal performance of a modified resol foam from
laboratory data
Bomberg, M. T.
https://publications-cnrc.canada.ca/fra/droits
L’accès à ce site Web et l’utilisation de son contenu sont assujettis aux conditions présentées dans le site
LISEZ CES CONDITIONS ATTENTIVEMENT AVANT D’UTILISER CE SITE WEB.
NRC Publications Record / Notice d'Archives des publications de CNRC:
https://nrc-publications.canada.ca/eng/view/object/?id=83c48d18-0478-4175-8384-eeb0ab14a136 https://publications-cnrc.canada.ca/fra/voir/objet/?id=83c48d18-0478-4175-8384-eeb0ab14a13678
Predicting
of
aModified Resol
Foam
from
Laboratory
Data
MARK BOMBERG
Institute for
Research in Construction The National Research Councilof
CanadaMontreal
Road,
Building
M24Ottawa, ON,
Canada K1A 0R6ABSTRACT: With
safety
testing of newblowing
agentsbeing
nearcompletion
and new types of thermal
insulating
foams entering the market,predicting
thelong-term thermal
performance
of these foams becomes important. In this respect, theex-perience
gained
under a 1987-1988 project on CFC blown, modified resol foams may prove invaluable aspredictions
derived four years ago can now becompared
with data obtained on material
exposed
onexperimental
roofsThis comparison indicates that the
prediction
oflong-term
thermalperformance
based on the initial thermal resistance determined on full thickness specimenscom-bined with the effect of aging determined on thin layers
agreed
with results obtained on the foamaged
under field conditionsINTRODUCTION
THE
MANUFACTURER’S OBJECTIVE to warrantlong-term
thermalper-formance of a modified resol foam insulation led to a
joint project
withNRC on
methodology
forpredicting
thermalperformance
under fieldcon-ditions. In the course of the
investigation,
it became apparent that themethods used in
existing
Canadian and American standards were notuniversally correlating laboratory
and fieldperformance [1,2].
Thisproject
aimed,
therefore, atdeveloping
an accelerated testprocedure, predicting
long-term
thermalperformance
of this foamproduct
and comparing it with the field measurements. The thinlayers (slicing) approach developed during
this
project,
cf.Bomberg [3],
was laterapplied
by
Kumaran andBomberg
J. THERMAL INSUL. AND BLDG. ENVS. Volititic
17-jiily
19931065-2744/93/O1 0078-11 $0600/0 © 1993 Tcchnomic Pubhshmg Co, Inc
[4]
to research onsprayed polyurethane
[5].
The NRCmethodology
in-cludes the
slicing technique originally
introducedby Isberg
[6],
but is much broader in manyregards.
To
predict
long-term
thermalperformance
under field conditions, the NRCmethodology
involves determination of threeperformance
aspects:1. The initial thermal
performance
of the foamproduct
2. Effect of time on thermalperformance
of the foam(aging)
3. Effect of environmental factors on the rate of the
aging
processThe imtial thermal
performance
of the foamproduct
is definedby
themean value and standard deviation of thermal
resistivity (inverse
of thermalconductivity)
measured on many full thickness boards. These boards aresampled
from at least three differentproduction
batches. The effect of timeon thermal
performance
is determined on thinlayers
andpresented
asde-pendence
of a dimensionless thermalresistivity
on theaging
period.
Thede-pendence
is called a normalizedaging
curve.In addition to agmg curves determined on thin
layers
stored in thelabora-tory, the
aging
curves are also determined on thinspecimens
exposed
tothermal and
humidity
gradients.
As work wasperformed
before thedevel-opment of the current
methodology,
the effects of environmental conditionswere not measured on slices but on full thickness boards.
MATERIALS AND METHODS
Three batches of modified resol
foams,
sampled
over aperiod
of twomonths and called
product
1, were coded as IC 791, IC 792, IC 793 andcompared
with an 18-month-old batch of the sameproduct
(IC
788batch).
To
quantify
effects of environmentalfactors,
thermal resistance tests wereperformed
onspecimens
exposed
to thefollowing
conditions:1. Isothermal aging in the
laboratory
(referred
to as 20°C or&dquo;laboratory&dquo;)
2. Effect
of temperature gradient
alone.Exposure
to 80°C on the warm sideand room conditions
(20°C,
45 ± 5%RH)
on the other side of theboard resulted in a thermal
gradient
ofapproximately
1500 K/m. The same absolutehumidity
was maintained on both sides. Fourspecimens
were
simultaneously
placed
in a cube and served as dividers between theenvironment maintained inside the cube and an air-conditioned room
(referred
to as&dquo;dry cube&dquo;).
3. Effect of moisture in the presence of temperature
gradient.
This exposurecomprised
ahigh
relativehumidity
and ahigh
temperature on the warmconditions on the other
side,
creating
a thermalgradient
ofapprox-imately
1250 K/m(referred
to as &dquo;humidcube&dquo;).
4. Effect of actual climatic conditions
(materials
installed in anexperimental
roof).
Evaluation of
long-term
thermalperformance
involvedcutting
thin materiallayers
(slices). They
wereprepared
in two stages. First, a thin sheetabout 2 mm thicker than the
required
thickness was cutusing
a horizontalband-saw. This sheet was then mounted on a vacuum table and smoothed
with a vertical
spindle
surfacegrinder
equipped
with a Carborundum disc.Suction of air
kept
thespecimen
inplace
while thegrinder
moved across thesurface of the
stationary specimen.
The
grinding
process maydestroy
some of the cell membranes andin-crease the fraction of open cells in the
layer
adjacent
to the surface. A conceptof &dquo;thickness of the
destroyed
surfacelayer&dquo;
(TDSL)
was thereforeintro-duced to
quantify
the effect of surfacepreparation.
For a known surface area, TDSL is defined as a difference between thegeometrical
and closed-cell(ef-fective)
specimen
volumes dividedby
the surface area[7,8].
The effective volume of the specimen is measured with a gas
displacement
method, and may therefore
depend
on both the cellopenings
and the cellsize. It
implies
that achange
in TDSL may be caused eitherby
achange
inthe number of broken cell membranes or
by
achange
in cellmorphology.
The latter was observed for
product
1, where the cellmorphology
variedbe-tween the surface and core
layers. Accordingly,
TDSL varied from 0.16 to0.20 mm for surface
layers
and 0.23 to 0.26 for corelayers.
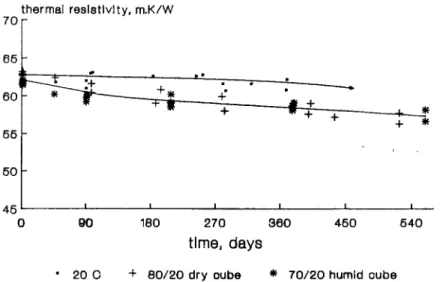
TEST RESULTS -
Aging
Full Boards under EnvironmentalExposures
Figure
1 showsaging
of full boards ofproduct
1exposed
to the abovedis-cussed environmental conditions. While
aging
is somewhat faster under thehighest
thermalgradient (dry cube)
than under humidcube,
the difference isnot
sigmficant.
The difference between the isothermal and thermalgradient
conditions is,however,
substantial.Figure
1 shows that when one side of the foam isexposed
to elevatedtem-perature
(dry
and wet cubeexposures),
the foam ages much faster. This effect lasts for aperiod
of 6-8 monthsonly.
After thisperiod,
the rate ofchange
in all the curves shown in
Figure
1 appears to be identical.Laboratory
Aging
of CoreLayers
in Product 1Characteristics for core slices cut from batches 788, 791, 792 and 793 are
FIGURE 1. Thermal resistivity measured on specimens exposed to three different
en-vironmental conditions.
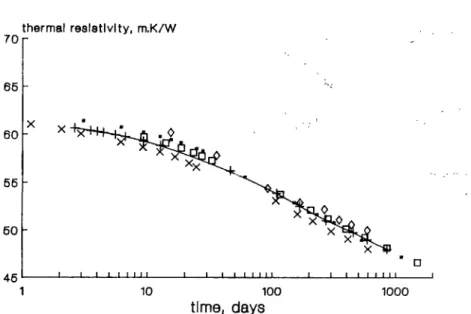
Assuming
that the thin foamlayer
ishomogenous,
theaging
curveestab-lished on a thin
specimen
can be transformed into thatcorresponding
toanother thickness of the foam
by
means ofscaling technique
[3].
Forin-stance, the thickness of tested core slices varied between 2.3 and 11.1 mm
(Table
1),
while results shown inFigure
2correspond
to the referencethick-ness of 10 mm. As
Figure
2 shows nosystematic
differences amongst therecalculated
aging
curves, one may conclude thatscaling
may beapplied
for the cores of this foamproduct.
If the differences between
aging
curves aresmall,
it is easy to select therepresentative aging
curve[4].
Forinstance,
as shown inFigure
2, theFIGURE 2. The extreme and average agmg curves (i.e, thermal resistivity versus time)
measured on slices cut from the foam core
age curve for batch 792
(continuous
line)
falls in the middle of all test resultsand may be used to represent
aging
of the corelayers.
Laboratory
Aging
of SurfaceLayers
of Product 1Characteristics of tested surface
layers
are shown in Table 2. Since for thesurface
layers
an average thickness of thedestroyed
surfacelayers
was 0.2mm, the effective thickness of the surface
layers
was 0.4 mm less than thegeometrical
one.Figure
3 shows results of thermalresistivity
measurementson six surface
specimens, prepared
from batches791,
792 and 793 andrecalculated to the reference thickness of 10 mm.
The differences in both the thermal
resistivity
values and the rate ofaging
displayed
by
various specimens, e.g., batch 791, make directcomparisons
difficult. For ease ofcomparison,
theseaging
curves will be normalized.To normalize the
results,
each value of thermalresistivity
is dividedby
its initial thermalresistivity.
Since the thermalresistivity
measured on thinlayers
maychange
rapidly,
the initial values used for normalization ofaging
curves are often determined on thick
specimens prior
toslicing
into thinlayers.
The initial thermalresistivity.,
used m these normalized curves, wasdetermined on full board thickness
using
a 600 X 600 mm Heat FlowMeter
(HFM)
apparatus. Then thespecimen
was cut into four smaller squares, and from one of them four slices were cut: two from the core and oneadjacent
to each surface. These slices were testedsimultaneously
in afour-station 300 X 300 mm HFM apparatus to
give
the results shown inFigures
2 and 3.PREDICTING LONG-TERM THERMAL RESISTANCE WITH
THE SCALING TECHNIQUE
Figure
4 shows five normalizedaging
curves for surfacelayers (points)
andtwo
normalized,
representative aging
curves, one for core and one forsur-FIGURE 3. The extreme and average aging curves measured on shces cut from the foam
FIGURE 4. Normalized aging curves measured on slices cut from either cores or surfaces of
the foam
face
layers (dotted lines).
There is a difference between therepresentative
ag-ing
curves for core and surfacelayers.
Since thescaling approach
canonly
beused for
homogenous
materials, one must decide whether this difference is consideredsignificant
or not. We have chosen to consider this material assufficiently homogenous
to use thescaling approach.
The average of surfaceand core
representative aging
curves, shown as a thick, continuous line inFigure
4,
is used for further calculations.The actual thermal
resistivity
forproduct
1 is obtained as aproduct
of theaging
factor determined from thenormalized,
representative
aging curveand the mean initial thermal
resistivity.
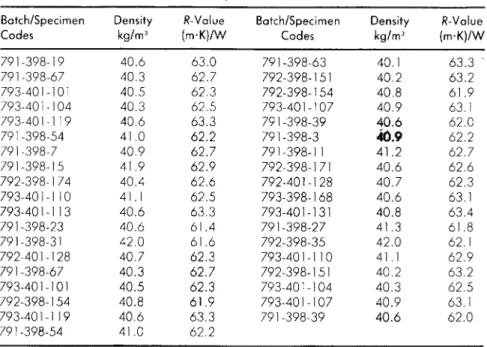
The initialresistivity
values forproduct
1 are listed in Table 3.Using
thenormalized,
representative
aging
curve and the mean value ofinitial thermal
resistivity,
theprediction
ofaging
can be obtained for theac-tual
product.
The actual board thickness varied from 40 to 42 mm and themean thickness was
approximated
as 41.4 mm.To compare
aging
of 10 mm(reference thickness)
and 41.4 mm thicklayers,
thescaling
factor of(41.4/10)2
= 17.1 is used. For aspecified period,
e.g., four years
(1600
days)
of full thickness boardaging,
thescaling
factor of 17.1 will transform it into theperiod
of 1600/17.1 = 94days aging
of thereference thickness. The
aging
factor,
found from therepresentative
aging
curve at the 94
day period,
is 0.89. Thepredicted
four year value of thermalTable 3. Initial thermal resistivity of batches IC 791, IC 792, IC 793.
COMPARISON OF PREDICTED AND MEASURED
FULL BOARD THERMAL RESISTANCE
Thcrmal
resistivity
measurementsperformed
aftcr onc and thrcc ycars inthc
laboratory
and after four years in thecxpcrimcntal
roof exposure arclisted in Tables 4, 5 and 6.
Table 4. Thermal
resistivity
ofproduct
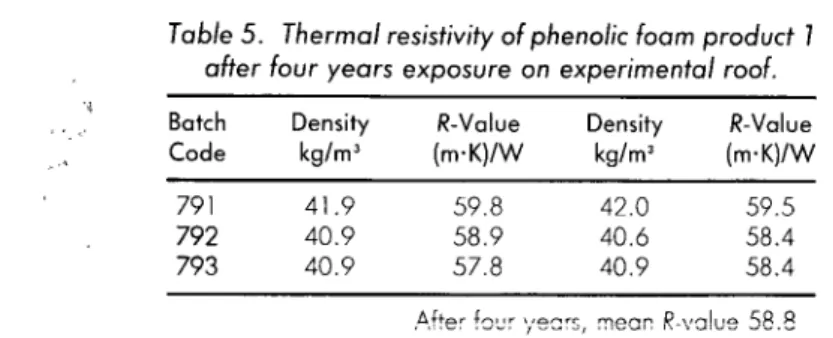
7 after one year exposure on theTable 5. Thermal
resistivity
ofphenolic
foamproduct
7 after four years exposure onexperimental
roof.Thermal resistivity measurcd attcr onc and four years of field exposure
and
prolonged
laboratory
storage can becompared
with that measuredm-tially.
The aging ofproduct
1 is veryslow;
the mean thermal resistivitychanges
from thc initial value of 62.6(m’K)/W
to 61.4(m’K)/W
after onc ycar of storagc and to 58.8 ± 0.1(m’K)/W
after four years(cf.
Tables 4, 5,6).
Thcsc rcsults arc vcry consistent and indicate that thcrc is nosignificant
difference between the
laboratory
and field aging.The
prediction
oflong-term
thermalperformance
based on the mtialthermal resistance determined on full thickness specimens and aging of thin
layers
was 55.5(IIlK)/W.
Thisprediction
can becompared
with themeasured results that were 58.8
(m.K)/W
forproduct
1sampled
from thefield exposure and 58.9
(m~K)/W
for thclaboratory samples.
Eventhough
theprediction
wasunderestimating
the effect of densified skinlayer
(which
initially
controls thc agingprocess),
the difference between thcpredicted
andmeasured values is less than 6 pcrccnt.
CONCLUDING REMARKS
Thc
proposed approach
bascd on thermal testing full boards and thinlaycrs
appears to give theright magnitude
of the estimatedlong-term
thcr-Table 6. Thermalresistivity
ofproduct
7 after fourmal
performance.
Themethodology proposed
four years ago[3,4]
has been under constant verification in a number of researchprojects [8-11].
Findings
of this
project
helped
todevelop
aproposal
for an ASTM standard testmethod. While
aging
as a function of time appears now to be wellunderstood,
the effect of environmental factors onaging
rate[12-14]
ap-pears to reqmre much more effort.
ACKNOWLEDGEMENT
M
ACKNOWLEDGEMENT
Deep gratitude
isexpressed
towards Dr. M. K. Kumaran,IRC/NRC,
forconstructive critique
during
this project and to OwensCorning
Canada(formerly
Fiberglas
CanadaInc.)
for sponsoring a researchproject
with theInstitute for Research in Construction of the National Research Council of Canada which led to the
development
ofshcing
andscaling methodology.
Special
thanks are also extended to Mr.John
Lackey,
IRC/NRC,
forper-formmg
measurementsreported
here.REFERENCES
1
Kabayama,
M. A. 1987. "Long-Term Thermal Resistance Values of Cellular Plastic Insulations," Jof Thermal Insulation, 10(April):286-300.
2.
Bomberg,
M. and D. A. Brandreth 1990. "Evaluation of Long-Term Thermal Resistance of Gas-Filled Foams: State-of-the-Art," Insulation Materials, Testing andApplications,
ASTM STP 1030, pp. 156-173.3.
Bomberg,
M. T. 1990."Scaling
Factors in Aging of Gas-Filled Cellular Plastics,"J
of
Thermal Insulation, 13(Jan) 149-159.4. Kumaran, M. K, and M. T.
Bomberg
1990. "Thermal Performance ofSprayed
Polyurethane
Foam with AlternativeBlowing Agents,"
J
.
of
Thermal Insulation,14(July):43-58.
5.
Bomberg,
M. T. and M. K. Kumaran. 1989. "Report onSprayed Polyurethane
Foam with Alternative
Blowing
Agents," CFCs and thePolyurethane Industry
Volume 2, aCompilation
of Technical Publications, SPI, pp. 112-1286.
Isberg, J
1988 The ThermalConductivity
of Polyurethane
Foam.Gothernburg,
Sweden: Chalmers University of
Technology.
7
Edgecombe,
F H et al. 1989. "Progress inEvaluating
Long-Term ThermalRe-sistance of Cellular Plastics,"
Polyurethanes
89, SPIConference,
pp 676-683.8. Schwartz, N. V, M. T
Bomberg
and M. K Kumaran. 1989. "Measurement of the Rate of Gas Transferthrough
CellularPlastics,"
J.
of
Thermal Insulation,13:48-61
9. Moore, S E 1992. "Effect
of Polymer
Structure on Long-Term Aging ofRigid
Polyurethane
Foam," Journalof
Thermal Insulation,15(April):279-293.
10
Christian, J
E., G. E. Courville, R. S. Graves, R. L. Linkous, D. LMcElroy,
F J Weaver and D. W.
Yarbrough.
1991 "Thermal Measurement of in-situ and Thin Specimen Aging ofExperimental Polyisocyanurate
Roof Insulation Foamed with AlternativeBlowing
Agents," ASTM STP 1116, pp. 142-166.11. Booth,
J.
R. and T S. Holstein. 1993. "Determination of Effective Diffusion Coefficients ofNitrogen
in ExtrudedPolystyrene
Foamby
GravimetricSorp-tion,"
J.
of
Thermal Insulation andBuilding Envelopes.
12. Kumaran, M. K., M. T
Bomberg,
R. G.Marchland, J.
A. Creazzo and M. R.Ascough.
1989. "A Method forEvaluating
the Effect ofBlowing Agent
Con-densation onSprayed Polyurethane
Foams," J.of
Thermal Insulation,13(Octo-ber):123-137.
13.
Bomberg,
M. T, M. K. Kumaran, M. R.Ascough
and R. G.Sylvester.
1990."Effect of Time and Temperature on R-Value of
Rigid Polyurethane
FoamIn-sulation Manufactured with Alternative
Blowing
Agents,"Polyurethane
90, pp. 420-431.14.