HAL Id: inserm-00663560
https://www.hal.inserm.fr/inserm-00663560
Submitted on 27 Jan 2012
HAL is a multi-disciplinary open access
archive for the deposit and dissemination of
sci-entific research documents, whether they are
pub-lished or not. The documents may come from
teaching and research institutions in France or
abroad, or from public or private research centers.
L’archive ouverte pluridisciplinaire HAL, est
destinée au dépôt et à la diffusion de documents
scientifiques de niveau recherche, publiés ou non,
émanant des établissements d’enseignement et de
recherche français ou étrangers, des laboratoires
publics ou privés.
approaches using species tree aware methods.
Valentín Ruano-Rubio, Olivier Poch, Julie Thompson
To cite this version:
Valentín Ruano-Rubio, Olivier Poch, Julie Thompson. Comparison of eukaryotic phylogenetic profiling
approaches using species tree aware methods.. BMC Bioinformatics, BioMed Central, 2009, 10 (1),
pp.383. �10.1186/1471-2105-10-383�. �inserm-00663560�
Open Access
Research article
Comparison of eukaryotic phylogenetic profiling approaches using
species tree aware methods
Valentín Ruano-Rubio, Olivier Poch and Julie D Thompson*
Address: Laboratoire de Biologie et Génomique Intégrative, Département de Biologie et Génomique Structurales, Institut de Génétique et de Biologie Moléculaire et Cellulaire, CNRS/INSERM/UDS, Illkirch, France
Email: Valentín Ruano-Rubio - [email protected]; Olivier Poch - [email protected]; Julie D Thompson* - [email protected] * Corresponding author
Abstract
Background: Phylogenetic profiling encompasses an important set of methodologies for in silico
high throughput inference of functional relationships between genes. The simplest profiles represent the distribution of gene presence-absence in a set of species as a sequence of 0's and 1's, and it is assumed that functionally related genes will have more similar profiles. The methodology has been successfully used in numerous studies of prokaryotic genomes, although its application in eukaryotes appears problematic, with reported low accuracy due to the complex genomic organization within this domain of life. Recently some groups have proposed an alternative approach based on the correlation of homologous gene group sizes, taking into account all potentially informative genetic events leading to a change in group size, regardless of whether they result in a de novo group gain or total gene group loss.
Results: We have compared the performance of classical presence-absence and group size based
approaches using a large, diverse set of eukaryotic species. In contrast to most previous comparisons in Eukarya, we take into account the species phylogeny. We also compare the approaches using two different group categories, based on orthology and on domain-sharing. Our results confirm a limited overall performance of phylogenetic profiling in eukaryotes. Although group size based approaches initially showed an increase in performance for the domain-sharing based groups, this seems to be an overestimation due to a simplistic negative control dataset and the choice of null hypothesis rejection criteria.
Conclusion: Presence-absence profiling represents a more accurate classifier of related versus
non-related profile pairs, when the profiles under consideration have enough information content. Group size based approaches provide a complementary means of detecting domain or family level co-evolution between groups that may be elusive to presence-absence profiling. Moreover positive correlation between co-evolution scores and functional links imply that these methods could be used to estimate functional distances between gene groups and to cluster them based on their functional relatedness. This study should have important implications for the future development and application of phylogenetic profiling methods, not only in eukaryotic, but also in prokaryotic datasets.
Published: 24 November 2009
BMC Bioinformatics 2009, 10:383 doi:10.1186/1471-2105-10-383
Received: 28 July 2009 Accepted: 24 November 2009 This article is available from: http://www.biomedcentral.com/1471-2105/10/383
© 2009 Ruano-Rubio et al; licensee BioMed Central Ltd.
This is an Open Access article distributed under the terms of the Creative Commons Attribution License (http://creativecommons.org/licenses/by/2.0), which permits unrestricted use, distribution, and reproduction in any medium, provided the original work is properly cited.
Background
A decade has passed since the introduction of phyloge-netic profiles to elucidate functional relationships between gene products. The basic assumption in the phy-logenetic profiling approach is that convergent evolution of traits, e.g. gene co-presence and co-absence patterns across genomes are due to inter-dependence between those traits [1]. For example, if the activity of a gene A is dependent on the existence of another gene B, a fixed deletion of B renders A redundant and consequently A will be eventually lost due to genetic drift as it is no longer subject to selective constraints. Phylogenetic profiles of gene presence-absence are typically encoded as a binary sequence of 1's (presence) and 0's (absence) where each position in the profile corresponds to a particular species under study (Figure 1). Functional dependencies between genes should then result in a smaller number of differ-ences in the corresponding profiles than expected by chance.
Since their introduction, phylogenetic profiling approaches have evolved and a number of novel methods have been developed to quantify the similarity between
two profiles or to statistically evaluate the reliability of the predicted functional relationships. These methods can be coarsely divided into two categories depending on whether they take into account the underlying species phylogeny: non-phylogenetic approaches that include pairwise distance comparisons [1], mutual information [2] or Pearson correlation [3] and phylogeny-aware approaches that rely on parsimony [4], maximum-likeli-hood [5] or kernel-methods [6] based scoring. In theory, phylogeny-aware approaches are preferable due to the sta-tistical bias introduced by gene content inter-dependence between closely related species, and it has been shown that such methods can improve the prediction of func-tional links in eukaryotic genomes [5]. Nevertheless, these methods remain computationally complex. As a conse-quence, some groups have proposed phylogeny-based heuristic corrections with the goal of reducing the inher-ent biases in a computationally efficiinher-ent manner (e.g. [7]). Despite the successful application of phylogenetic profiles in a number of studies involving prokaryotic genomes (reviewed in [8]), profiling in eukaryotes has received lit-tle attention. Moreover, based on combined prokaryotic and eukaryotic studies, some groups have concluded that the statistical signal is severely disrupted by inclusion of eukaryotic genomes [9,10]. To measure the extent to which these methods can be applied in studies of eukary-otes, Singh and Wall [11] constructed phylogenetic pro-files consisting exclusively of eukaryotic genomes and detected some correlation for proteins within the same functional module determined using the Gene Ontology [12]. This finding indicates the presence of at least some statistical signal in eukaryotes.
As an alternative to these co-evolution studies based on individual genes, a number of recent studies have inde-pendently proposed a different approach based on the correlation of homologous gene group sizes across genomes. Ranea and colleagues [13] grouped protein encoding genes hierarchically in families based on their 3D structure (CATH structural domains) and sequence similarities. They then measured the evolutionary conver-gence between them through copy number, referred to here as group size, correlation analyses based on a euclidean dis-tance statistic to quantify profile pair relatedness. Cordero and coworkers [14] studied the co-evolution between pathway co-occurring gene families from the COG data-base [15]. They introduced a more sophisticated phylog-eny-aware approach based on the reconstruction of the histories of gene content across phylogenetic lineages. Thus, gene families (or groups) that showed concerted changes in size at the same branches along the species tree are predicted to have co-evolved. Despite their methodo-logical differences, both studies reached the conclusion that considering gene group size instead of total presence
Schema of a simple phylogenetic profiling pipeline Figure 1
Schema of a simple phylogenetic profiling pipeline. A)
genes (dots) are grouped using a biologically relevant crite-rion (e.g. orthology) in a diverse set of genomes (rectangles). B) a matrix is constructed with rows corresponding to groups and columns corresponding to genomes. Each cell in the matrix is assigned a value of 1 (presence) or 0 (absence) of the group in the genome. C) this matrix is used as input to a phylogenetic profiling method that results in a list of poten-tially related gene groups. D) the output can then be used to build a functional network that may well lead to or give sup-port to further biological findings.
or absence of a particular gene can lead to a considerable improvement in predictive performance, at least in their respective datasets. In addition, very recently Tuller and colleagues [16] applied non-parametric correlation analy-sis of gene group size changes along branches of the spe-cies tree to elucidate functional relationships between GO terms. They used this approach in conjunction with corre-lation of evolutionary rates to reconstruct a global gene co-evolution network in yeast species.
Although all these approaches have been used successfully in a certain number of studies, no objective comparison has been performed to evaluate their relative perform-ance, particularly in the more complex situation of eukaryotic genome studies. Here, we have constructed a benchmark containing both positive examples of func-tionally related gene pairs and negative examples of unre-lated pairs, based on the functional relationships defined in the STRING database [17]. The benchmark contains examples of two different types of relationships: physical protein-protein interactions (PPI) and co-occurrence in the same cellular pathway (CoPW). We have used this benchmark to perform a comprehensive study of "classi-cal" gene presence-absence phylogenetic profiles, as well as gene group size based analyses taking into account the species phylogeny, in order to measure the ability of each technique to predict these functional relationships in the eukaryotic life domain.
Methods
Gene group test sets in eukaryotes based on orthology and shared domains
The first step in any phylogenetic profiling analysis is the definition of homologous gene groups in the set of species under study. Here, we have used a large test set of eukary-otic orthologous gene groups extracted from the OrthoMCL database version 2 [18]. This orthology predic-tion database offers a broad eukaryote species sampling and has performed well in gene function based bench-marks [19]. Each orthologous group may contain an arbi-trary number of paralogs within each species as determined by the OrthoMCL multi-species algorithm [20], typically resulting from post-speciation gene dupli-cations. Therefore OrthoMCL groups are appropriate for the evaluation of both presence-absence and gene group size based approaches as functional link predictors in eukaryotes at the domain level. The resulting test set includes a total of 53 eukaryotic species (Figure 2) and 54228 orthologous gene groups present in at least two of these species.
Since the OrthoMCL group granularity may be too fine for group size based analyses to be effective, we also gener-ated a coarser gene grouping based on InterPro database [21] domain and family level matches across all
eukaryo-tic proteins in OrthoMCL (using the precomputed matches available on the OrthoMCL database website). This second approach frequently leads to genes being clas-sified in more than one group due to the presence of multi-domain or fusion proteins. Despite the fact that such co-occurrence may in fact be a good indication of functional relationship between groups (the rosetta-stone method [22]), it obscures the evaluation of the real merit attributable to the phylogenetic profiling approach itself. Therefore, we excluded from our analyses, profile compar-isons between gene groups where the size of their intersec-tion was greater than 1% of the size of the smaller group. Any effects due to group overlap were considered negligi-ble below this threshold. The resulting set includes 4378 groups present in at least two eukaryotic species. Table 1 shows some general statistics relevant to this study con-cerning the groups generated using OrthoMCL and Inter-Pro based approaches.
Eukaryotic phylogeny and selection of conserved gene groups
In order to apply more accurate genome phylogeny based profiling methods, we needed to specify a fully resolved species phylogeny for the 53 species under analysis. We
Species tree of the 53 eukaryotic species used in the study Figure 2
Species tree of the 53 eukaryotic species used in the study. Although the real position of the last common
ances-tor (LCA) of all eukaryotes remains unclear, we chose a plau-sible location at the root of Unikonta (here represented by animals, fungi and amoebae for analyses that required a rooted tree. The figure was built using FigTree v1.2.2 http:// tree.bio.ed.ac.uk/.
used a curated phylogeny (Figure. 2) taking into account the current understanding of deep evolutionary relation-ships between eukaryotic taxon groups [23-27]. The root of the tree was placed at a plausible location correspond-ing to the last common ancestor of all eukaryotes: the split between unikonts (amoebozoa, fungi and metazoa) and bikonts (platae and the rest of protists) [28]. In order to focus on functional relationships that may be relevant to most of the eukaryotic species examined, we considered
only those gene groups that expand across these two major taxon groups. The final dataset consisted of 8999 OrthoMCL and 2716 InterPro groups.
Gene presence-absence profiling
For each of the groups in the 2 datasets described above, a presence-absence profile was constructed, with each posi-tion corresponding to the 53 species under study. The position in the profile was set to 1 if the species was present in the orthologous group, regardless of the number of genes, and was set to 0 if the species was absent. The similarity of each pair of profiles was then measured using two different approaches: (i) co-occur-rence of group loss as inferred using Dollo parsimony and (ii) weighted-hypergeometric and runs-corrected scores. These two approaches are described in more detail below and in Figure 3.
Presence-absence profiling based on Dollo parsimony inferred gene losses
Dollo parsimony was initially conceived as a tool to infer phylogenies [29], but recently some studies have applied this approach to the analysis of the evolution of gene con-tent in genomes and functional linkage between proteins
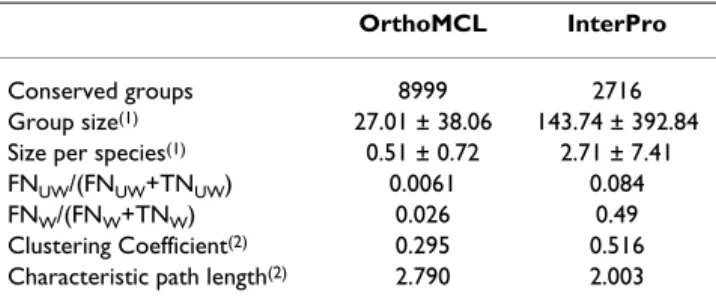
Table 1: General properties of homologous gene groups.
OrthoMCL InterPro
Conserved groups 8999 2716
Group size(1) 27.01 ± 38.06 143.74 ± 392.84
Size per species(1) 0.51 ± 0.72 2.71 ± 7.41
FNUW/(FNUW+TNUW) 0.0061 0.084
FNW/(FNW+TNW) 0.026 0.49
Clustering Coefficient(2) 0.295 0.516
Characteristic path length(2) 2.790 2.003 (1)Cells show mean and standard deviation.
(2)Calculated on the functional link network between groups present
in STRING database.
FN = False Negative, TN = True Negative
Graphical summary of species tree aware approaches evaluated in this manuscript Figure 3
Graphical summary of species tree aware approaches evaluated in this manuscript. On the left hand side, classical
presence-absence profiling. First, for each profile pair (Gi and Gj), gene group counts are converted to a binary representation. The significance of co-occurrences is then evaluated using 2 different methodologies (DPCP and WRUNS). The gray branches in the DPCP tree indicate compressed subtrees (see main text for details). On the right hand side, gene group size based meth-ods. First, ancestral group sizes are reconstructed, and the group size change at each branch is calculated (see main text for details). Then, profile pairs are tested for evidence of co-evolution (GSCOR and GSHGT).
in eukaryotes [30-32]. Dollo-parsimony assumes that of two possible state transitions, in our case, presence to absence and vice versa, one is more probable than the other. In the current context, we assume that gene gains can only occur once, but that genes can be lost independ-ently in many lineages. Thus we assumed that recurrent gain of the genes in different eukaryotic lineages via lateral gene transfer (LGT) is relatively small in comparison to the number of genes inherited vertically.
In order to measure the statistical significance of the sim-ilarities observed between two profiles, we applied the hypergeometric test based on the four possible result classes (i.e. combinations of presence and absence) at each position on the profile. We also implemented the phylogenetic correction used in the STRING database by compressing subtrees with all extant taxa in the same result class into a single observation (described in [8]). Additionally we bound trees at branches where a gene group loss occurs in either of the two orthologous groups. We considered that two gene groups cannot influence each other's evolution long after one of them has been lost (i.e. after the next speciation event in the species tree under study). In the rest of the article we refer to this method as DPCP (Dollo-parsimony compressed profiles).
Presence-absence profiling using ordered profiles and runs-based scoring
This is the approach proposed by Cokus and coworkers [7]. In summary, their approach scores the number of coincidental co-presences (1 and 1) in a pair of group pro-files, taking into account the proportion of gene groups present in each genome (weights) and the species phylog-eny. The scoring procedure does not consider the tree topology per se, but it does so indirectly by ordering the species in the profiles according to their evolutionary rela-tionships and then counting the number of runs (i.e. max-imal consecutive co-presence positions) between two profiles (Figure 3). Although not equivalent, the number of runs is positively correlated with the combined number of gene group gains and losses in both profiles and thus the information content present in the profile pair. For example, multiple co-presences found within a small number of runs may indicate gene conservation in line-ages rather than co-evolution, whereas the same number of co-occurrences in a larger number of runs is a more convincing indicator of true co-evolution.
The number of observed runs and the resulting score depends on how we graphically sort descendant subtrees at each ancestral node in the species tree. We chose a sin-gle order for all comparisons following the approach indi-cated in the original paper [7], which involves minimizing the genome content dissimilarities between adjacent
genomes in the profile. From this point on we refer to this method as WRUNS.
Gene group size profiling
In gene group size based profile approaches, instead of coding gene groups according to presence and absence, the exact number of gene group members at each genome is preserved at each position. Therefore there is no loss of information at this point. Methods that do not take into account the phylogeny (e.g. [13]) could compare the pro-files with no further changes. However, phylogeny aware methods include an additional step where profiles "unfold", by incorporating an additional position for each ancestral taxon or internal node in the species tree that contains an estimated ancestral group size. Then, the group sizes in the profile are transformed into the final signed size change along the branch that lead to them (Figure 3 right). This is calculated as the group size at that node minus the group size at the direct ancestor on the tree. As a result, each position in the final profile, repre-senting a branch in the species phylogeny rather than an extant species, includes a neutral sign or 0 if there was no size change, a negative number if the gene group decreased in size, contraction, or a positive number if its size increased, expansion.
Reconstruction of ancestral gene group sizes
A key element in these approaches is to infer ancestral gene group sizes. Here we used two different approaches: a parsimony based reconstruction method and a new approach based on gene trees.
For the parsimony based reconstruction, we implemented the algorithm described in Cordero et al 2008, who mini-mized a cost function on the minimum number of genetic events (individual gene losses, duplications or gains) nec-essary to explain the observed pattern of group sizes in extant species. Here, we used the cost function F (Eq. 1); in this function we do not consider de novo gene gains, that would result from LGT, thus increases in gene group size can only be due to existing gene duplications. We adjusted the gene duplication, d, to loss, l, cost ratio parameter, μ, using observed relative frequencies using the gene tree based reconstruction approach (μ = 2.5).
The novel gene tree based approach involves the recon-struction of the genealogy for each gene group and the mapping of gene gains and losses onto the species tree. To do this, we used the MAFFT software [33] to construct multiple sequence alignments for each gene group. Then we used the TreeBest package [34], first to build the corre-sponding trees using the neighbour joining (NJ)
rithm on multiple substitution corrected amino acid distances, and second to map genetic events onto branches on the species tree.
Often protein domain rearrangements and fast sequence evolution hampers sequence alignment and in turn gene tree reconstruction. Consequently, we needed to split each gene group into subgroups more amenable to align-ment and tree inference. In order to do this, we performed a greedy decomposition in maximum cliques using Cliquer [35]. Here we define a clique as a subset of genes whose sequences are aligned with any other member of the clique over at least 50% of the length of the shortest sequence in the pair. This threshold was determined in tests on a subset of groups and permits reconstruction of subgenealogies without over-fragmentation of the sub-families. At each decomposition step, the maximum clique is subtracted from the remaining set of genes until only one or zero remains. Since calculating maximum cliques is a computationally demanding problem (NP-hard in complexity theory terms), we used Nmclique [36], an approximate heuristic solver, as long as the remaining group size was greater than 300 genes. Finally, once a gene group was fully decomposed, TreeBest was run on each subgroup and inferred genetic events were merged by add-ing them up on the correspondadd-ing branches of the species tree.
Group size based profiling significance testing
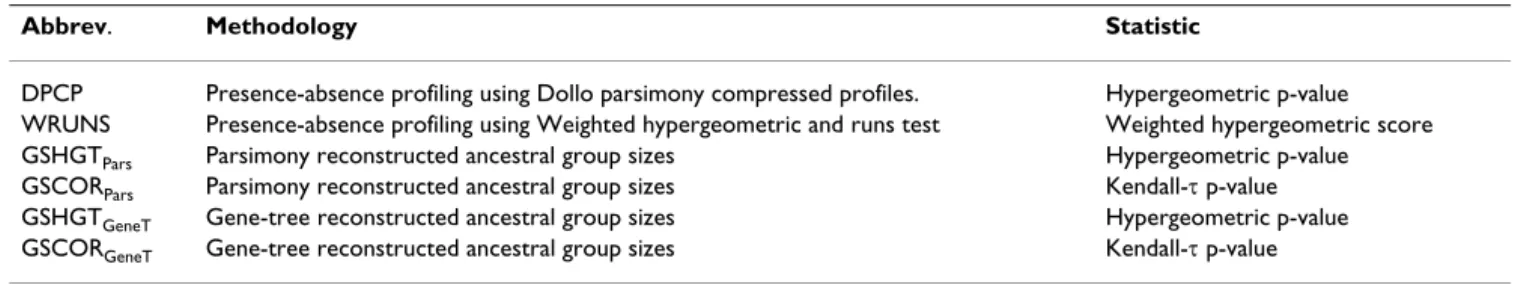
We applied two methods to identify gene group size change profile pairs that show a significant level of coevo-lution: first using a correlation test on unmodified size change values and second using a hypergeometric test on the distribution of the sign of the change (expansions and contractions) across branches. We refer to these as GSCOR (correlation test of group size change) and GSHGT (hypergeometric test of group size change) in the text from now on. Subscripts (Pars) and (GeneT) indicate that ancestral group size were reconstructed using parsimony or gene trees respectively (Table 2).
For GSCOR we implemented an approach similar to the one proposed by Cordero and colleagues [14] but opted for a non-parametric method, Kendall-t ranks correlation coefficient and p-values as changes are not necessarily
normally distributed. We also tested a partial correlation correction to take into account the bias effects of heterog-enous genome sizes. However this did not result in an improvement in predictive performance (data not shown) thus we opted for the uncorrected version, relying on empirical thresholds and the p-value fitted distribution to eliminate this and other biases as described in Results and Discussion.
In both approaches we did not take into consideration
ambiguous branches that exhibit no group size change.
This allows a binary encoding of expansions and contrac-tions in GSHGT and avoids numerous ties of 0 in GSCOR.
Measure of profile pair information content
For the GSCOR method, we used the number of branches considered in the test, i.e. those with expansions and tractions in both profiles, to quantify information con-tent. In contrast, for DPCP, WRUNS and GSHGT, we used the geometric average of the profile entropies multiplied by the length, lij, of the profile pair under consideration:
The individual profile entropy H is calculated using the fraction of positions for each possible symbol (DPCP {0,1} and GSHGT {-,+}):
Calculation of information content adjusted profile pair scores
We used two approaches that take into account IC, in order to classify profile pairs as putatively co-evolving or not. First, we used a single cut-off threshold based on a negative control set built as described below. Second, we fitted a bivariate distribution of scores versus information content for each method using the kernel approach imple-mented in the MASS R package (function kde2d).
Positive and negative test sets
We used the STRING database version 7 [37] as a unified source of both experimentally verified and
computation-ICij=lij H Hi j (2)
Hi = − −pi( / ) log0 2pi( / )− 0 −pi( / ) log ( / )+ 1 2 + 1
(3)
Table 2: Summary of methods and abbreviations.
Abbrev. Methodology Statistic
DPCP Presence-absence profiling using Dollo parsimony compressed profiles. Hypergeometric p-value WRUNS Presence-absence profiling using Weighted hypergeometric and runs test Weighted hypergeometric score GSHGTPars Parsimony reconstructed ancestral group sizes Hypergeometric p-value GSCORPars Parsimony reconstructed ancestral group sizes Kendall-τ p-value
GSHGTGeneT Gene-tree reconstructed ancestral group sizes Hypergeometric p-value GSCORGeneT Gene-tree reconstructed ancestral group sizes Kendall-τ p-value
ally inferred protein-protein functional relationships. We built two different categories of true positive (TP) datasets. The first set, TPCoPW, contained gene pairs that
partici-pated in the same KEGG cellular pathway [38] as stored in STRING. The second set, TPPPI, included interacting
pro-tein pairs from interactome databases present in STRING (see [37] for details). We propagated the relationships defined for individual genes to gene groups, if there were at least two disjoint pairs of genes in each group that were functionally related to each other. In the case of TPCoPW, at
least one pair must belong to a unikont species and the other to a bikont. This way we intrinsically give more weight to functional links that are more likely to exist in most eukaryotes. Due to limited species sampling of pro-tein-protein interactions, in the TPPPI we included all
group relationships that had evidence in both vertebrates and non-vertebrates.
In order to construct the negative control dataset, we wanted to explicitly exclude potential functionally linked gene pairs and their corresponding gene groups. We there-fore built a "false negative" (FN) set of related gene pairs based on the absence of any kind of evidence in STRING, except functional links only supported by the phyloge-netic profiling method implemented therein; if included, these would result in an overestimation of the perform-ance of the phylogenetic profiling methods under evalua-tion, due to similarities between the criteria used to build the negative control set and to compare their profiles later. Finally, we propagated all gene level relationships to their respective OrthoMCL and InterPro groups with no addi-tional restrictions.
In each analysis we generated a putative true negative set TN (200,000 pairs). To do so, we constructed random gene group pairs and discarded those present in the FN set until we reached the targeted size. Note that all TP pairs are included in the FN set, therefore TP pairs are also auto-matically excluded from the negative control.
We used two approaches for generating random pair sam-ples: based on a weighted and unweighted group random pair generator. In the unweighted approach, resulting in the pair set TNUW, each group has the same probability of
being picked, whereas the weighted approach gives a weight to each group proportional to the number of gene members, resulting in the pair set TNW. The motivation
behind using a parallel weighted approach is the noticea-ble bias in the orthologous and domain level group sizes found in the TP sets in comparison with unweighted TNUW sets. In order to generate positive predictive value (PPV) plots, we estimated the real proportion of TP group pairs using the number of unweighted random pairs rejected because they were found in the FN set.
Results and Discussion
A total of six phylogenetic profiling approaches described in Methods were tested based on the positive and negative datasets of functionally linked genes or gene groups. These included two methods based on the traditional presence-absence profiles of individual genes: a full spe-cies phylogeny based method (DPCP) and a computa-tionally efficient heuristic method (WRUNS). In addition, four different gene group size approaches were tested resulting from the combination of two methods to infer ancestral gene group sizes (parsimony and gene tree) and two methods to evaluate the significance of the co-evolu-tionary signal (GSCOR and GSHGT). A summary of the methods and abbreviations used is shown in Table 2.
Sensitivity of presence-absence profiling at the orthologous group level
We first applied the traditional presence-absence profiling methods, here represented by DPCP and WRUNS, to the test set of OrthoMCL orthologous groups. The goal was then to correctly predict known relationships extracted from the STRING database, namely co-presence in path-ways (TPCoPW) or protein-protein interactions (TPPPI). To
measure the overall sensitivity of the methods, we initially defined a single global p-value or score threshold for each method using the distribution of values observed in the negative control sets at the typical standard type-I error level of 5% (i.e. 95% specificity).
The first two columns in Table 3 show the resulting sensi-tivities. DPCP is more sensitive with a maximum of 20.7% true positives versus 14.9% for WRUNS on the TPCoPW test
set, using TNUW as a negative control. Similar results are obtained for TPPPI with sensitivities of 17.5% and 13.7%
respectively. Using the weighted negative control, TNW, the two approaches achieve more similar but slightly lower sensitivities (Table 3). Thus, in this case, we con-clude that the negative test set sampling approach has lit-tle effect on the sensitivity estimates.
The corresponding ROC curves (Figure 4 pink and yel-low), which plot sensitivity versus specificity, show that these methods are better than random classifiers espe-cially in the region of high scoring cases (inset diagrams). Nevertheless, both presence-absence profiling approaches sometimes fall just above or below the diagonal, generally showing a poorer performance on the PPI positive set compared to the CoPW set. This is due to a considerable percentage of profile pairs that do not exhibit enough var-iability or number of genetic events (information con-tent), resulting in an elevated number of degenerated maximum and non-significant p-values (= 1) that affect CoPW and PPI (especially the latter).
Table 3: Sensitivity of co-evolution detection methods on OrthoMCL profile pairs.
Positive pair set Presence/absence profiling Group size profiling
DPCP WRUNS GSHGTPars GSCORPars GSHGTGeneT GSCORGeneT
Unweighted negative control (TNUW)
TPCoPW 20.7% 14.9% 6.4% 12.2% 17.3% 18.6%
TPPPI 17.5% 13.7% 17.2% 25.9% 33.7% 37.9%
Weighted negative control (TNW)
TPCoPW 16.3% 14.3% 6.4% 12.5% 13.8% 10.5%
TPPPI 15.1% 13.3% 17.2% 25.9% 29.0% 27.2%
ROC curves of different methods applied to OrthoMCL based gene groups Figure 4
ROC curves of different methods applied to OrthoMCL based gene groups. The sensitivity (x-axis) is evaluated using
TPCoPW (top: A, C and E) and TPPPI (bottom: B, D and F) whereas specificity (x-axis) is evaluated using TN
UW (left: A and B),
TNW (centre: C and D) and information content adjusted p-values (right: E and F). Inset graphs give a zoomed in view of the high specificity - low sensitivity regions (top scoring cases).
Sensitivity of group size based profiling approaches at the orthologous group level
Since the OrthoMCL orthologous groups may contain a variable number of paralogs for each species, group size based approaches are also applicable in this scenario. Accordingly, we also evaluated their sensitivity using the same procedure as for the presence-absence profiling methods (Table 3). In order to calculate empirical thresh-olds, we only considered group pairs with a minimum number of 10 common branches that have undergone a group size expansion or contraction, since lack of either group size variability across species or phylogenetic spread renders a considerable number of profile pairs unsuitable for this purpose.
The ancestral gene group size reconstruction using Parsi-mony also yielded results better than a random classifier based on the ROC curves (Figure 4, light blue and dark blue). They were roughly equal to or inferior to presence-absence methods in the high selectivity region close to the origin of the axes with the exception of the TPPPI using
unweighted negative test set sampling (zoomed in insets in Figure 4). Using GSCORPars, the observed sensitivities
are higher than with GSHGTPars (Table 3).
In contrast, the gene tree based reconstructions achieved in general a better sensitivity, closer to that achieved by DPCP on the TPCoPW test set and with a noticeable
improvement on the TPPPI set using both GSHGT and
GSCOR. GSCORGeneT achieves an more than 2 fold increase using the unweighted negative set sampling (37.9% versus 17.5%). Also the corresponding ROC curves (Figure 4, light green and dark green) are the ones closest to the ideal classifier, indicating that these meth-ods seem to perform better overall (Figure 4A-D).
Sensitivity at the domain sharing and gene family level
In a second experiment, we applied the same analyses to coarser groups of genes from the InterPro dataset (see Methods). These groups are clearly more extensive in comparison with OrthoMCL groups, with a 5 fold larger mean group size (Table 1). A larger number of members
allows a greater group size variability across extant and ancestral gene groups, and thus a larger number of informative tree branches that have undergone group size expansions or contractions.
It is worth noting that the weighted negative pair sam-pling generates a staggering 49% pairs present in the FN profile pair set (see Methods). In other words, if two genes are chosen at random, there is nearly a 50% chance that they contain some functionally related protein domains (i.e. at least one functionally linked protein pair contains these domains). This is not surprising if one considers that even assuming an unrealistic random intergenic func-tional network, larger gene groups would have an increas-ing chance to exhibit some direct or indirect functional link through some of its members.
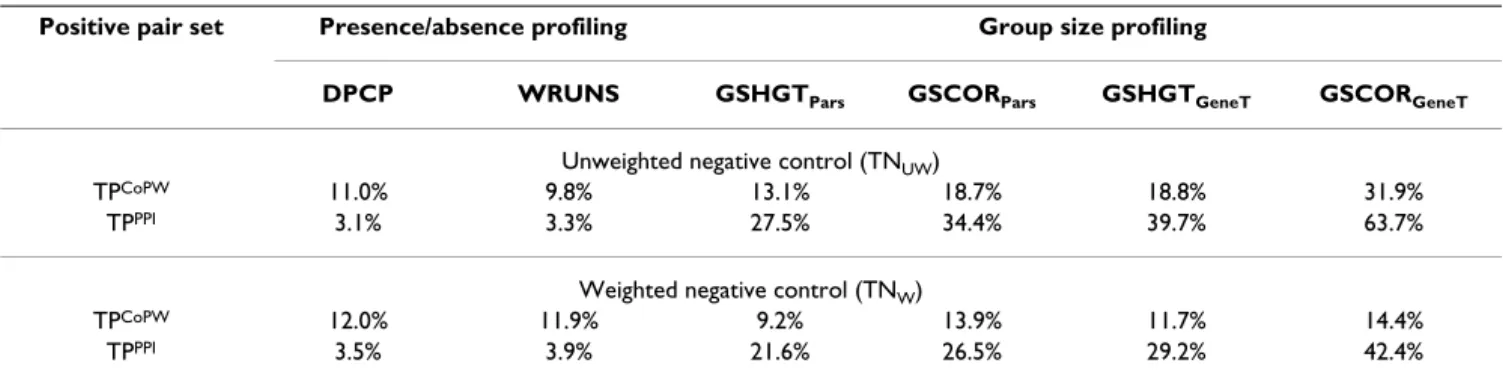
Although presence-absence profiling is not appropriate for coarse gene clusters (since most positions are 1), we applied DPCP and WRUNS to these two datasets in order to compare their performance with gene group size based approaches. Presence-absence profiling clearly loses over-all sensitivity when applied to coarse gene groups (Table 4). Moreover, their sensitivity does not even reach the designed type-I error for the prediction of PPI relation-ships using the InterPro groups. This confirms that pres-ence-absence profiling is less useful at this group granularity level, although it still does better than a ran-dom classifier on the CoPW positive profile pair set. In contrast, using the group size based approaches, the sensitivity remains equal or increased with coarser clusters of genes. The only exception is the gene tree reconstruc-tion with the hypergeometric test (GSHGTGeneT) for the prediction of CoPW relationships, where sensitivity slightly decreased (approx. 2% less). The maximum sensi-tivity achieved is as high as 63.7% for the prediction of PPI using the InterPro groups and the unweighted negative control sampling to calculate thresholds.
The corresponding ROC curves are consistent with these results (Figure 5A-D). These show an appreciable decrease
Table 4: Sensitivity of co-evolution detection methods on InterPro profile pairs
Positive pair set Presence/absence profiling Group size profiling
DPCP WRUNS GSHGTPars GSCORPars GSHGTGeneT GSCORGeneT
Unweighted negative control (TNUW)
TPCoPW 11.0% 9.8% 13.1% 18.7% 18.8% 31.9%
TPPPI 3.1% 3.3% 27.5% 34.4% 39.7% 63.7%
Weighted negative control (TNW)
TPCoPW 12.0% 11.9% 9.2% 13.9% 11.7% 14.4%
in performance of the presence-absence profiling meth-ods compared to the results obtained with the OrthoMCL groups (see Figure 4), especially for the prediction of PPI positive pairs. The group size based approaches using par-simony reconstruction (light blue and dark blue curves) improve considerably in most cases (except for CoPW pre-dictions using weighted negative sampling), in contrast to the gene tree based reconstruction (light green and dark green curves) that only results in a noticeable improve-ment for the PPI predictions.
Effect of information content on sensitivity and false positive rates
To evaluate to what extent information content (IC)may have an impact on the performance of the different
meth-ods, we plotted sensitivity, or true positive rate (TPR), and false positive rates (FPR) at a standard type-I error level of 5% against a measure of profile pair IC (described in Methods) (Figure 6). All approaches show better perform-ance for the prediction of PPI compared to CoPW rela-tionships. Moreover, the sensitivity is in most cases higher than the FPR, although the ratio between the two quanti-ties is lower using the group size methods.
For the gene presence-absence methods applied to OrthoMCL groups (Figure 6A), the sensitivity increases steadily with increasing IC clearly above the FPR. Both DPCP and WRUNS achieved similar performances at the same IC levels. The sensitivity is clearly higher for the pre-diction of PPI compared to the CoPW dataset. At the 5%
ROC curves of different methods applied to InterPro based gene groups Figure 5
ROC curves of different methods applied to InterPro based gene groups. The sensitivity (x-axis) is evaluated using
TPCoPW (top: A, C and E) and TPPPI (bottom: B, D and F) whereas specificity (x-axis) is evaluated using TN
UW (left: A and B),
TNW (centre: C and D) and information content adjusted p-values (right: E and F). Inset graphs give a zoomed in view of the high specificity - low sensitivity regions (top scoring cases).
Sensitivity (TPR) and false positive rate (FPR) plots versus profile pair information content (IC) Figure 6
Sensitivity (TPR) and false positive rate (FPR) plots versus profile pair information content (IC). Here we use a
single type-I error threshold value of 5% and TNW as a reference. Left column (A-C) corresponds to OrthoMCL groups and the right column (D-F) corresponds to InterPro groups. The top row (A and D) shows results using presence-absence profiling approaches, the middle row (B and E) represents group size approaches using the hypergeometric test (GSHGT), and the bot-tom row (C and F) corresponds group size approaches using the Kendall-t correlation index (GSCOR). Results for WRUNS on TNW and TNUW are omitted since they are extremely similar to DPCP's. Violin plots under each diagram indicate the fre-quency distribution of profile pairs across information content (wider plots indicate higher frequencies). Each colour repre-sents a different positive, TPPPI (blue) and TPCoPW (green), or negative, TN
UW (magenta) and TNW (orange), profile pair dataset.
Thus the first two represent sensitivity or true positive rate (TPR) whereas the second two indicate FPR using alternative neg-ative control sampling approaches. Sensitivity, FPR and IC frequency distributions are smoothed by considering neighbouring data points along the y-axis (radius 2) with equal weights. Data points with less than 10 observations are not shown.
type I error level, sensitivity exceeds 50% in the highest informativeness regions. In contrast, the FPR barely reaches 10% under the same conditions, thus resulting in an approximate 5 fold ratio between sensitivity and FPR. For the group size based approaches (Figure 6B and 6C), the parsimony ancestral size reconstruction apparently results in lower IC (measured by the number of branches that exhibit expansion or contraction in both profiles simultaneously). Nevertheless this observation is not by itself a clear indicator of the overall performance superior-ity of the gene tree based reconstruction. At best, for the parsimony reconstruction with the hypergeometric test (GSHGTpars), FPR reaches values as high as 30% with a contrasting sensitivity that only occasionally surpassed the 40% mark (Figure 6B). Using gene tree based recon-struction, these figures reached 35-40% and 65-70% respectively. In general, sensitivity vs FPR in group size based approaches does not go far beyond the 2 fold mark. In contrast, the correlation based approach (GSCOR) using either parsimony or gene tree based ancestral group size reconstruction does not show such a clear distinction graphically between CoPW positive and negative control sets specially using gene tree reconstruction (Figure 6C). The performance is slightly better for PPI positives. The sensitivity and FPR of the methods applied to InterPro groups (Figure 6D-F) are very similar to the plots obtained using OrthoMCL groups from a qualitative point of view. Nevertheless there is a clear loss of sensitivity in presence-absence methods at this group level (Figure 6A and 6D). The differences between the group size based approach curves (Figure 6B vs E and C vs F) are mainly due to differ-ences in the IC ranges and thresholds used.
Effect of information content heterogeneity
In order to investigate the IC ranges for the profile pairs in each of the test sets, we plotted the relative profile pair IC frequency distribution along the x-axis (violin plots under each diagram in Figure 6). In all approaches and gene group granularities, the regions with high frequency in the positive profile pair test set do not match the maximum sensitivity (always associated with high IC). This seems to be the main factor that limits profiling performance. Additionally, the profile pair distribution across IC levels is clearly different between the positive and negative data-sets in each possible combination of profiling methodol-ogy and gene group granularity. Using presence-absence profiling, the positive set frequencies are shifted towards low IC in contrast to the negative control set frequencies, whereas this trend is reversed using group size approaches. This may explain the contrasting perform-ance of presence-absence profiling and group size based profiling within and across different gene group clustering granularities.
In the case of presence-absence profiling, most PPI links are found in the region with less informative profile pairs especially in the InterPro gene group positive test set (Fig-ure 6D). Thus, despite the fact that sensitivity is generally higher when compared to CoPW positive pairs and that PPI functional links should exhibit a stronger interde-pendence, this type of profiling performs worse in practice (Tables 3 and 4).
These results suggest that we could aim to improve func-tional link prediction accuracy by using alternative group-ing criteria that maximize IC. For example, previous studies in prokaryotes and eukaryotes indicate a gain in performance when considering several similarity thresh-olds [13,39] as opposed to a single gene clustering crite-rion. However altering granularity in order to increase the chance of detection by optimising IC may render the results less amenable to interpretation, as cluster bounda-ries may not correlate with clear biologically interpretable gene groups (e.g. orthologous groups, gene families, shared domains, gene ontology clusters and so forth). Alternatively, profile pairs could be sorted based on IC for further investigation using potentially more accurate but computationally demanding approaches, such as maxi-mum-likelihood based methods [5]. This would avoid running computationally demanding analyses on profile pairs with low IC that a priori are much less likely to show any evidence of coevolution.
Score adjustment based on information content
In view of the differences in information content (IC) dis-tributions for the positive and negative test sets, even when using weighted negative sampling, we reassessed the performance of the different approaches after correct-ing for IC heterogeneity on a case by case basis. Takcorrect-ing TNW as a control and using a kernel fit, we estimated the conditional probability distribution of the scores given the IC under the null hypothesis that gene groups are not functionally related: Pr(score|ICij). Then, the scores were
converted to adjusted p-values equal to the probability of obtaining a score equal to or greater than the observed score given the IC found in the pair. The resulting profile pair p-values should more accurately reflect our confi-dence in the prediction of co-evolution of the correspond-ing gene groups. The plots on the right-hand size in Figures 4 and 5 show the adjusted ROC curves next to their non-adjusted counterparts using unweighed and weighted negative sampling (left and middle plots respec-tively) and Table 5 shows the sensitivity estimates at the type-I error level of 5% (p-value <= 0.05) for the IC-adjusted p-values.
Our results indicate a decrease in the performance of the gene group size based approaches using IC corrected
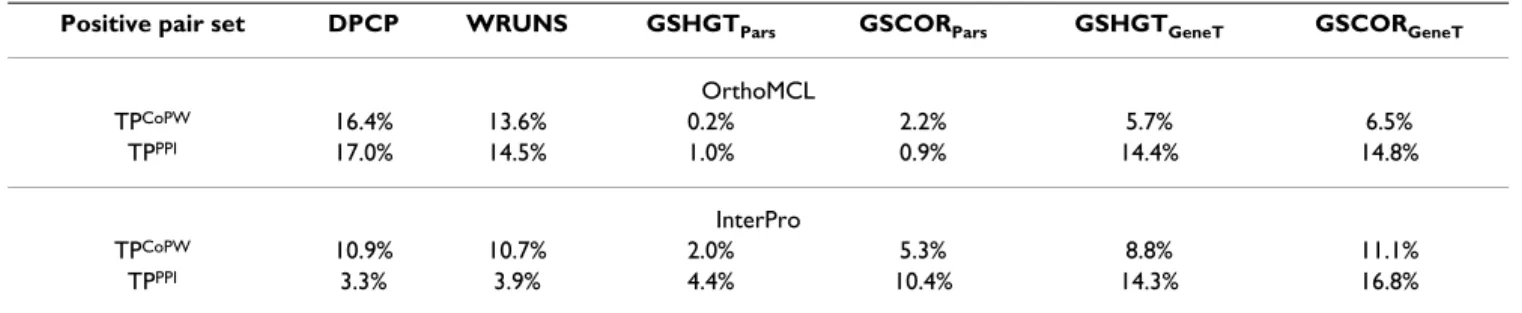
p-values, while the performance estimate of the presence-absence approaches remains relatively unchanged com-pared to the single empirical threshold approach. The par-simony reconstruction based analyses are the most affected by the adjustment, particularly when applied to the InterPro datasets, where sensitivities that were previ-ously estimated to be as high as 34% percent (Table 4) decrease to around 10% or lower (Table 5). All in all, the group size based approaches seem to lose most of the advantage they had with respect to presence-absence pro-filing when the co-evolutionary signal is measured objec-tively based on the IC of the profile pair. In other words, we overestimate the performance of gene group based approaches unless, either the profile pair scores are adjusted for IC, or the statistical differences between the positive and the negative control test sets accurately reflect the properties of the real world data.
Thus, the typical approach of generating unweighted ran-dom pairs to build a negative dataset and a single cut-off value results in a very clear overestimation of the accuracy of gene group size approaches. Performance improve-ment using this strategy does not seem to be founded on a real gain of co-evolutionary signal as much as statistical biases due to heterogeneous distribution of informative-ness between positive and negative control groups. Jothi and colleagues [10] made an important remark on the importance of a careful selection of the null hypothesis in order to avoid spurious results due to profile heterogene-ity. They focused their discussion on the effect introduced by combined analyses of profiles with different phyloge-netic spread. The adoption of species tree aware approaches, such as the ones used in this study, together with the restriction of considering only groups that are present on both sides of the root of the tree, should reduce these biases. Nevertheless, differences may still remain and can result in artefactual detection of functional rela-tionships between gene groups.
It should be noted however that the inability to distin-guish between putative functionally linked and unrelated pairs may result in part from the difficulties in obtaining a pure negative control dataset totally devoid of
function-ally linked groups. For instance, weighted negative sam-pling generates a high proportion of false negatives: 49%. Moreover, the functional network resulting from the clus-tering of genes into coarse groups is inevitably very con-densed, with most genes connected by one or only a few direct functional links (Table 1). Arguably, we should expect to see at least some weak co-evolution between groups that are found close together in the network (i.e. most random pairs).
Other sources of bias in phylogenetic profiling analyses
For all the methods tested here, the FPR increases for high information content levels. This trend is more pro-nounced in the group size based approaches and espe-cially when using non-partial correlation corrected coefficients (GSCOR). Previous studies using permutation and simulations have already shown that heterogeneous genome size can affect the outcome of co-evolution tests [13,14]. For example, lineages leading to larger genomes should have a natural tendency to expansions and vice versa. Moreover, genomic scale events, such as whole genome duplications and major genome rearrangements, may introduce additional background co-evolution-like patterns for the affected gene groups that are not a conse-quence of true functional relationships.
In addition to genome size effects, we also found evidence for local correlation of group size evolution mostly between neighbouring branches of the species tree (Figure 7). Either positive or negative correlation of group size change between phylogenetic tree branches should result in a number of coincidental expansions and contractions greater than that expected under the null hypothesis, due to the fact that we conveniently (but erroneously) con-sider observations at different branches or profile posi-tions as independent data points. An evolutionary explanation for this phenomenon might be that closely related phylogenetic lineages tend to follow a similar evo-lutionary pattern, resulting in positive correlation, and that gene losses are typically preceded by gene gains, resulting in negative correlation between ancestral and successor branches on the tree. Branch evolutionary corre-lation heatmaps such as the one shown in Figure 7 could
Table 5: Sensitivity of Information Content adjusted p-values at 5% type I error using kernel fit.
Positive pair set DPCP WRUNS GSHGTPars GSCORPars GSHGTGeneT GSCORGeneT
OrthoMCL TPCoPW 16.4% 13.6% 0.2% 2.2% 5.7% 6.5% TPPPI 17.0% 14.5% 1.0% 0.9% 14.4% 14.8% InterPro TPCoPW 10.9% 10.7% 2.0% 5.3% 8.8% 11.1% TPPPI 3.3% 3.9% 4.4% 10.4% 14.3% 16.8%
be used to attain an optimal choice of species for phyloge-netic profiling by selecting lineages resulting in a minimi-zation of autocorrelation effects.
Phylogenetic profiling as a functional link predictor in large-scale analyses
The positive predictive value (PPV) is a statistic of special interest for high-throughput functional studies as it quan-tifies the probability that a positive test outcome is in fact a true prediction. Figure 8 shows PPV plots against sensi-tivity for analyses using the OrthoMCL and InterPro groups based on IC corrected p-values. Reasonable PPV values (50% or greater) are only obtained at very low sen-sitivity, especially for the OrthoMCL gene groups (Figure 8A and 8B). This is for the most part due to the low esti-mated proportion of TP pairs amongst all possible pairs (Table 1) and the fact that only a fraction of these have a high enough IC to be tested.
Consequently, although phylogenetic profiling may be used to unveil some functional relationships with a strong co-evolutionary signal, it is on its own not suitable for large-scale screening of these relationships in eukaryotes. The PPV improves when considering coarser gene clusters (Figure 8C and 8D), but this will lead to subsequent prob-lems in distinguishing true functionally related gene pairs, since the number of possible pairings grows quadratically with the number of members of each group.
Reassessing the contribution of gene group size based approaches
Gene group size based approaches offer an opportunity to overcome some of the limitations of presence-absence based methods [13,14], for example the analysis of essen-tial gene group profiles (present in all or most species). Nevertheless, even though these methods take in consid-eration a greater number of genetic events, thus increasing information content, they are still outperformed by pres-ence-absence in certain cases, particularly when applied to the fine-grained OrthoMCL groups (Table 3 and 5 and Figure 4). The most plausible explanation for this is that a total loss of a gene group, without any homologous genes left to perform at least part of its biological role, has a much greater impact than losing or gaining some gene "copies". Thus, common gene group pair co-expansions or co-contractions that do not result in a total gain or loss of the homologous groups under consideration provide less compelling evidence of co-evolution and may intro-duce noise.
Despite this lack of resolution, the fact that the sensitivity values are typically above the FPR curves (Figure 6) is a clear indicator that these scores are positively correlated with true functional relatedness. Consequently, although group size based approaches may not perform that well in
classifying pairs as related or unrelated, they may still be appropriate for defining functional distances between groups and also perhaps for clustering them in functional modules. In any case, high scoring pairs are likely to be true functionally linked groups [13,14]. However, it is preferable to use adjusted scores determined, for example, by the kernel approach described in Methods in order to avoid an over-representation of cases with high IC due to their inherently higher non-adjusted scores.
Gene trees improve the performance of gene group size change approaches
In an attempt to improve the performance of gene group size based methods, we used gene trees to reconstruct ancestral gene group sizes. This resulted in a clear improvement compared to parsimony reconstruction. Gene trees can map more precisely gene duplications and losses to branches of the species tree using the evolution-ary information present in the gene sequences. The total
Heatmap representing partial correlation of reconstructed group size changes between branches on the species tree Figure 7
Heatmap representing partial correlation of recon-structed group size changes between branches on the species tree. Below the diagonal, each row and column
corresponds to a branch in the tree that is schematically depicted above the diagonal. Cell are colour coded according to the partial correlation between branches represented by that row and column (light yellow indicates positive tion (towards 1), orange tones indicate weak or no correla-tion (towards 0), whereas red indicates negative correlacorrela-tion (< 0). Partial correlation coefficients were calculated using the TPPPI dataset and the Kendall-t rank index. Above the
diagonal, the labelled branches show a contrasting trend in comparison with neighbouring lineages on the species tree.
number of genetic events inferred is approximately 9 fold the number recovered using parsimony. Moreover, multi-ple losses and gains can be simultaneously detected on the same branch, whereas parsimony can only infer an opti-mal number of gene losses or duplications depending on the sign of the size change on that branch. Consequently, the number of branches with expansions and contractions in the average profile pair is much greater using the gene tree based reconstruction (Figure 6). Moreover, after cor-recting for heterogeneous IC content, the sensitivity of gene tree based approaches is clearly greater than those using parsimony (Table 5).
Conclusion
To summarize, our results confirm that the performance of phylogenetic profiling methods is limited in eukaryotic studies, an observation already made in previous studies of presence-absence profiling [9,10]. However, several methodological aspects beyond the scope of this article may influence the outcome: for example different meth-ods for orthologous group prediction, large group decom-position and alternative gene tree building methods, different methods for species sampling or the use of other criteria to define bona fide functionally linked group pairs
or alternative genetic event types that may also co-occur between co-evolving groups of genes.
In addition to presence-absence profiling, recent work in the field has proposed group size based approaches as an alternative methodology that may improve performance. Our analyses indicate that the relative performance of both approaches is for the most part dependent on the gene clustering granularity. While presence-absence pro-filing is more appropriate for fine-grained gene clusters such as the OrthoMCL orthologous groups, we show that the sensitivity of the group size based approaches can be increased by using coarser clusters of genes (based on the presence of a shared InterPro domain). In our experi-ments, the type of functional link affects both approaches in the same way, since direct protein-protein interactions (PPI) represent stronger interdependences and are gener-ally better predicted than participation in the same KEGG pathway, which include a wider variety of relations. We also show that heterogeneous information content between positive and negative control datasets influences performance assessment. Moreover, a combination of two frequently adopted evaluation strategies resulted in a clear overestimation of the performance gained using group size approaches (i) generating a negative control set that involves random or exhaustive unweighted group pair generation and (ii) using a single null hypothesis rejection threshold. Here, we have proposed an alternative based on adjusting the profile pair scores based on their infor-mation content. In this context, weighted sampling of a negative set helps in obtaining enough cases across the information content range to accurately approximate this distribution with a smaller sampling.
In contrast with gene group size approaches, presence-absence profiling always shows a better positive versus negative classification accuracy in the face of the heteroge-neous nature of the information content across profile pair sets. This property is true for both gene clustering granularities tested despite our efforts to improve gene group size based approaches using gene trees to infer ancestral group sizes. Therefore, we conclude that pres-ence-absence profiling methods are more suitable for the analysis of datasets where the profiles have sufficient information content.
Nevertheless group size approaches are still useful and provide a complementary means of detecting domain or family level co-evolution between groups that may be elu-sive to presence-absence profiling approaches. Moreover positive correlation between co-evolution scores and functional links imply that these methods could be used to estimate functional distances between gene groups and to cluster them based on their functional relatedness.
PPV versus sensitivity plots based on adjusted scores Figure 8
PPV versus sensitivity plots based on adjusted scores.
Top row shows results using TPCoPW to evaluate sensitivity,
whereas the bottom row is based on TPPPI. Left and right
col-umns show relative performances for OrthoMCL and Inter-Pro gene groups.
Finally, despite the fact that this study focuses on eukary-otic genomes, we believe these observations should also be considered in future bacterial and archeobacterial phy-logenetic profiling analyses.
Authors' contributions
VRR performed all the required programming, data collec-tion, analyses and drafted a first version of the manu-script. VRR and JDT jointly interpreted the results, modified and improved the manuscript. JDT and OP par-ticipated in the study design and management, and the revision of the manuscript. All authors read and approved the final manuscript.
Acknowledgements
This work was developed within the framework of the Decrypthon pro-gram, co-funded by Association Française contre les Myopathies (AFM), IBM and Centre National de la Recherche Scientifique (CNRS). The work was also supported by institute funds from the INSERM, the CNRS, and the Univer-sité de Strasbourg. We thank Shaw Cokus and Matteo Pellegrini for helping us to understand some details of the WRUNS method and for advice on how to make our implementation more accurate and efficient. Also we would to thank Heng Li for comments on the use of the TreeBest program. Finally we would like to express our gratitude to the anonymous reviewers whose valuable comments have helped us to improve the manuscript.
References
1. Pellegrini M, Marcotte EM, Thompson MJ, Eisenberg D, Yeates TO:
Assigning protein functions by comparative genome analy-sis: protein phylogenetic profiles. Proc Natl Acad Sci USA 1999, 96:4285-4288.
2. Huynen M, Snel B, Lathe W, Bork P: Predicting protein function
by genomic context: quantitative evaluation and qualitative inferences. Genome Res 10:1204-1210.
3. Glazko GV, Mushegian AR: Detection of evolutionarily stable
fragments of cellular pathways by hierarchical clustering of phyletic patterns. Genome Biol 2004, 5:R32.
4. Liberles D, Thoren A, von Heijne G, Elofsson A: The use of
phylo-genetic profiles for gene predictions. Current Genomics 2002, 3:131-137.
5. Barker D, Pagel M: Predicting functional gene links from
phyl-ogenetic-statistical analyses of whole genomes. PLoS Comput
Biol 2005, 1:e3.
6. Vert J: A tree kernel to analyse phylogenetic profiles.
Bioinfor-matics 2002, 18(Suppl 1):S276-S284.
7. Cokus S, Mizutani S, Pellegrini M: An improved method for
iden-tifying functionally linked proteins using phylogenetic pro-files. BMC Bioinformatics 2002, 8(Suppl 4):S7.
8. Kensche PR, van Noort V, Dutilh BE, Huynen MA: Practical and
theoretical advances in predicting the function of a protein by its phylogenetic distribution. J R Soc Interface 2008, 5:151-170.
9. Snitkin ES, Gustafson AM, Mellor J, Wu J, DeLisi C: Comparative
assessment of performance and genome dependence among phylogenetic profiling methods. BMC Bioinformatics 2006, 7:420.
10. Jothi R, Przytycka TM, Aravind L: Discovering functional linkages
and uncharacterized cellular pathways using phylogenetic profile comparisons: a comprehensive assessment. BMC
Bio-informatics 2007, 8:173.
11. Singh S, Wall DP: Testing the accuracy of eukaryotic
phyloge-netic profiles for prediction of biological function. Evol Bioinf
2008, 4:217-223.
12. The Gene Ontology Consortium: The Gene Ontology project in
2008. Nucleic Acids Res 2008, 36:D440-444.
13. Ranea JAG, Yeats C, Grant A, Orengo CA: Predicting protein
function with hierarchical phylogenetic profiles: the Gene3D Phylo-Tuner method applied to eukaryotic genomes. PLoS
Comput Biol 2008, 3:e237.
14. Cordero OX, Snel B, Hogeweg P: Coevolution of gene families in
prokaryotes. Genome Res 2008, 18:462-468.
15. Tatusov RL, Fedorova ND, Jackson JD, Jacobs AR, Kiryutin B, Koonin EV, Krylov DM, Mazumder R, Mekhedov SL, Nikolskaya AN, Rao BS, Smirnov S, Sverdlov AV, Vasudevan S, Wolf YI, Yin JJ, Natale DA: The
COG database: an updated version includes eukaryotes.
BMC Bioinformatics 2008, 4:41.
16. Tuller T, Kupiec M, Ruppin E: Co-evolutionary networks of
genes and cellular processes across fungal species. Genome
Biol 2009, 10:R4.
17. von Mering C, Huynen M, Jaeggi D, Schmidt S, Bork P, Snel B:
STRING: a database of predicted functional associations between proteins. Nucleic Acids Res 2003, 31:258-261.
18. Chen F, Mackey AJ, Stoeckert CJ, Roos DS: OrthoMCL-DB:
que-rying a comprehensive multi-species collection of ortholog groups. Nucleic Acids Res 2006, 34:D363-D368.
19. Altenhoff AM, Dessimoz C: Phylogenetic and functional
assess-ment of orthologs inference projects and methods. PloS
Com-put Biol 2009, 5:e1000262.
20. Li L, Stoeckert CJ, Roos DS: OrthoMCL: identification of
ortholog groups for eukaryotic genomes. Genome Res 2003, 13:2178-2189.
21. Hunter S, Apweiler R, Attwood TK, Bairoch A, Bateman A, Binns D, Bork P, Das U, Daugherty L, Duquenne L, Finn RD, Gough J, Haft D, Hulo N, Kahn D, Kelly E, Laugraud A, Letunic I, Lonsdale D, Lopez R, Madera M, Maslen J, McAnulla C, McDowall J, Mistry J, Mitchell A, Mulder N, Natale D, Orengo C, Quinn AF, Selengut JD, Sigrist CJA, Thimma M, Thomas PD, Valentin F, Wilson D, Wu CH, Yeats C:
InterPro: the integrative protein signature database. Nucleic
Acids Res 2009, 37:D211-D215.
22. Suhre K: Inference of gene function based on gene fusion
events: the rosetta-stone method. Methods Mol Biol 2007, 396:31-41.
23. Baldauf SL, Roger AJ, Wenk-Siefert I, Doolittle WF: A
kingdom-level phylogeny of eukaryotes based on combined protein data. Science 2000, 290:972-977.
24. Bapteste E, Brinkmann H, Lee JA, Moore DV, Sensen CW, Gordon P, Duruflé L, Gaasterland T, Lopez P, Müller M, Philippe H: The
analy-sis of 100 genes supports the grouping of three highly diver-gent amoebae: Dictyostelium, Entamoeba, and Mastigamoeba. Proc Natl Acad Sci USA 2002, 99:1414-1419.
25. Philippe H, Lartillot N, Brinkmann H: Multigene analyses of
bilat-erian animals corroborate the monophyly of Ecdysozoa, Lophotrochozoa, and Protostomia. Mol Biol Evol 2005, 22:1246-1253.
26. Rodríguez-Ezpeleta N, Brinkmann H, Burey SC, Roure B, Burger G, Löffelhardt W, Bohnert HJ, Philippe H, Lang BF: Monophyly of
pri-mary photosynthetic eukaryotes: green plants, red algae, and glaucophytes. Curr Biol 2005, 15:1325-1330.
27. Moreira D, Heyden S von der, Bass D, López-García P, Chao E, Cav-alier-Smith T: Global eukaryote phylogeny: Combined
small-and large-subunit ribosomal DNA trees support monophyly of Rhizaria, Retaria and Excavata. Mol Phylogenet Evol 2007, 44:255-266.
28. Stechmann A, Cavalier-Smith T: The root of the eukaryote tree
pinpointed. Curr Biol 2003, 13:R665-R666.
29. Farris J: Phylogenetic analysis under Dollo's Law. Syst Zoology 1977, 26:77-88.
30. Koonin EV, Fedorova ND, Jackson JD, Jacobs AR, Krylov DM, Makarova KS, Mazumder R, Mekhedov SL, Nikolskaya AN, Rao BS, Rogozin IB, Smirnov S, Sorokin AV, Sverdlov AV, Vasudevan S, Wolf YI, Yin JJ, Natale DA: A comprehensive evolutionary
classifica-tion of proteins encoded in complete eukaryotic genomes.
Genome Biol 2004, 5:R7.
31. Barker D, Meade A, Pagel M: Constrained models of evolution
lead to improved prediction of functional linkage from cor-related gain and loss of genes. Bioinformatics 2007, 23:14-20.
32. Martens C, Vandepoele K, de Peer YV: Whole-genome analysis
reveals molecular innovations and evolutionary transitions in chromalveolate species. Proc Natl Acad Sci USA 2008, 105:3427-3432.
33. Katoh K, Kuma K, Toh H, Miyata T: MAFFT version 5:
improve-ment in accuracy of multiple sequence alignimprove-ment. Nucleic
Acids Res 2005, 33:511-518.
34. Li H: TreeBest. [http://treesoft.sourceforge.net/treebest.shtml]. 35. Östergård PRJ: Cliquer. [http://users.tkk.fi/pat/cliquer.html].
Publish with BioMed Central and every scientist can read your work free of charge
"BioMed Central will be the most significant development for disseminating the results of biomedical researc h in our lifetime."
Sir Paul Nurse, Cancer Research UK Your research papers will be:
available free of charge to the entire biomedical community peer reviewed and published immediately upon acceptance cited in PubMed and archived on PubMed Central yours — you keep the copyright
Submit your manuscript here:
http://www.biomedcentral.com/info/publishing_adv.asp
BioMedcentral 36. Nmclique [http://www.cs.sunysb.edu/~algorith/implement/dimacs/
distrib/color/graph]
37. von Mering C, Jensen LJ, Kuhn M, Chaffron S, Doerks T, Krüger B, Snel B, Bork P: STRING 7--recent developments in the
inte-gration and prediction of protein interactions. Nucleic Acids
Res 2007, 35:D358-D362.
38. Aoki-Kinoshita KF, Kanehisa M: Gene annotation and pathway
mapping in KEGG. Methods Mol Biol 2007, 396:71-91.
39. Date SV, Marcotte EM: Discovery of uncharacterized cellular
systems by genome-wide analysis of functional linkages.