HAL Id: hal-01765180
https://hal.laas.fr/hal-01765180
Submitted on 27 Nov 2020
HAL is a multi-disciplinary open access archive for the deposit and dissemination of sci-entific research documents, whether they are pub-lished or not. The documents may come from teaching and research institutions in France or abroad, or from public or private research centers.
L’archive ouverte pluridisciplinaire HAL, est destinée au dépôt et à la diffusion de documents scientifiques de niveau recherche, publiés ou non, émanant des établissements d’enseignement et de recherche français ou étrangers, des laboratoires publics ou privés.
Multi-MHz micro-electro-mechanical sensors for atomic
force microscopy
Bernard Legrand, Jean-Paul Salvetat, Benjamin Walter, Marc Faucher, Didier
Theron, Jean-Pierre Aimé
To cite this version:
Bernard Legrand, Jean-Paul Salvetat, Benjamin Walter, Marc Faucher, Didier Theron, et al.. Multi-MHz micro-electro-mechanical sensors for atomic force microscopy. Ultramicroscopy, Elsevier, 2017, 175, pp.46 - 57. �10.1016/j.ultramic.2017.01.005�. �hal-01765180�
Multi-MHz micro-electro-mechanical sensors for atomic force microscopy
Author names and affiliations:
Bernard Legranda, Jean-Paul Salvetatb, Benjamin Walterc,1, Marc Faucherc, Didier
Théronc, Jean-Pierre Aiméd a LAAS-CNRS, Université de Toulouse, CNRS, 7 avenue du colonel Roche, F-31400 Toulouse, FRANCE b CRPP, 115 avenue Schweitzer, F-33600 Pessac, FRANCE c IEMN, avenue Henri Poincaré, F-59652 Villeneuve d’Ascq, FRANCE d CBMN, allée Geoffroy Saint Hilaire, Bât. B14, F-33600 Pessac, FRANCE Corresponding author: Bernard Legrand, e-mail: [email protected] Abstract: Silicon ring-shaped micro-electro-mechanical resonators have been fabricated and used as probes for dynamic atomic force microscopy (AFM) experiments. They offer resonance frequency above 10 MHz, which is notably greater than that of usual cantilevers and quartz-based AFM probes. On-chip electrical actuation and readout of the tip oscillation are obtained by means of built-in capacitive transducers. Displacement and force resolutions have been determined from noise analysis at 1.5 fm/√Hz and 0.4 pN/√Hz, respectively. Despite the high effective stiffness of the probes, the tip-surface interaction force is kept below 1 nN by using vibration amplitude significantly below 100 pm and setpoint close to the free vibration conditions. Imaging capabilities in amplitude- and frequency-modulation AFM modes have been demonstrated on block copolymer surfaces. Z-spectroscopy experiments revealed that the tip is vibrating in permanent contact with the viscoelastic material, with a pinned contact line. Results are compared to those obtained with commercial AFM cantilevers driven at large amplitudes (>10 nm). Keywords: § Atomic force microscopy (AFM) § Micro electromechanical systems (MEMS) § Micro electromechanical resonators § High frequency AFM probe § Block copolymers Highlights: § Silicon MEMS resonators are used as AFM probes above 10 MHz § Integrated capacitive transducers drive and sense sub-nanometer tip oscillation § Force resolution is below 1 pN/√Hz § Block copolymer surface is imaged using AM and FM AFM modes § Probes are operated at small vibration amplitude in permanent viscoelastic contact 1 Present address: Vmicro SAS, IEMN-Avenue Henri Poincaré, F-59652 Villeneuve d’Ascq, FRANCE
1. Introduction
Scanning probe microscopy (SPM) has been one of the most important instrumental discoveries during the last quarter of the last century [1]. In particular, atomic force microscopy (AFM) is a cross-disciplinary technique able to provide sample morphology down to the atomic scale [2]. This has been at the origin of, and constantly supports the development of nano-sciences, information technologies, micro-nanotechnologies and nano-biology. Dynamic mode AFM has a unique capability of characterizing soft and biological materials like molecular structures in native-like and functional conditions [3, 4, 5, 6]. Interaction forces between the AFM oscillating tip and the sample surface can be kept in the 10 pN range, ensuring non-damaging observations. Beyond providing topography images by scanning XY axes, AFM through Z spectroscopy gives access to advanced analysis of tip-sample interactions and to rheological information like material elasticity and mechanical dissipation [7, 8, 9]. Increasing the AFM probe resonance frequency is desirable for such applications. First, it contributes to increase the measurement bandwidth of the AFM, one of the key parameters for time-resolved experiments and high-speed imaging, which remains a huge expectation in the field. Second, it allows the investigation of the dynamic behavior of material viscoelasticity over an extended frequency range. The mainstream option to achieve this goal consists in miniaturizing the conventional AFM probe based on the flexural mode cantilever to raise the resonance frequency. Downscaled cantilevers are now commercially available resonating in the range 1-5 MHz [10]. During the last decade, they have been employed successfully in high-speed AFM instruments [11], leading to impressive video rate images and to direct observations of the dynamic behavior of nano-biological systems [4, 5]. The cantilever technology faces however difficulties to push further the frequency: the beam size of the laser used for the detection as well as the fabrication of the tip out of the plane of the cantilever limit its lateral dimensions to a few micrometers. For these practical considerations, the resonance frequency of AFM cantilevers is hard to exceed 5 MHz in air. Alternative strategies have been deployed since the 1990’s to circumvent these limitations. In particular, numerous studies have been devoted to the integration of self-sensing and self-driving methods thanks to the progress in micro/nano fabrication and electromechanical transduction schemes. Integrated detection methods such as capacitive [ 12 ], piezoresistive [ 13 ] and piezoelectric [13, 14] sensing schemes have been developed in purpose of overcoming the constraints of optical detecting method. Despite outstanding results in terms of resonance frequency up to 100 MHz [15], moderate success among AFM users is obtained because of the difficulty and the cost of fabrication of such small probes.
Leaving the cantilever concept aside, another paradigm appeared 15 years ago taking advantage of quartz resonators. AFM probes based on quartz tuning forks [16] and length-extension resonators [17] with self-driving and self-sensing capabilities have been developed successfully. Considering that the force resolution that is essential for the AFM sensitivity does not depend on the stiffness only but also on the resonance frequency, the quality factor and the resonator stability, it is possible to relax the constraint on the probe stiffness and thus on the resonator size when increasing the resonance frequency. Such AFM probes can achieve atomic resolution images and can be operated at sub-nanometer vibration amplitudes thanks to their high stiffness preventing the tip from snapping into the surface [17, 18]. A drawback of the current AFM probe quartz technologies lies in the millimetric dimension of the resonators that limits the resonance frequency to 1 MHz [19].
In this paper, AFM probes are implemented using micro-electromechanical systems (MEMS) resonators, which allows raising the probe resonance frequency above 10 MHz. In-plane vibrating silicon micro-resonators that were primarily developed for electronic filters or time reference applications [20] are indeed promising candidates for AFM applications. Integrated capacitive electromechanical transducers bring self-driving and self-sensing capabilities; resonance frequencies can exceed 100 MHz, enabling large measurement bandwidth and time-resolved experiments at the microsecond scale or below; in-plane vibration modes suffer less from damping and energy losses than flexural modes, and quality factors can exceed 1,000 in air. In the light of the application of MEMS resonators in the field of surface imaging, the authors previously presented in 2007 the concept of AFM probes taking advantages of the elliptic vibration of a ring-shaped micromechanical resonator [21, 22]. Further works demonstrated that such probes are sensitive to mechanical interactions with surface forces [23] and can be successfully used for AFM imaging [24]. Recent advances in signal processing gave access to the detection the thermomechanical displacement noise of the probes, paving the way for exquisite sensitivity and force resolution [25, 26]. In the present study, AFM results obtained with 13.6 MHz MEMS AFM probes are presented. Firstly, the probes and the experimental set-up are described. Probes are characterized in terms of short- and long-term noise, resolution and stability. The results are discussed and operating conditions for AFM imaging are deduced for these high frequency probes. In a second part, the probes are used for amplitude-modulation (AM) and frequency-modulation (FM) AFM imaging modes. Topographic images and force spectroscopy results obtained with block copolymers surfaces are shown and compared to measurements done with a commercial equipment and cantilever probes.
2. Material and methods
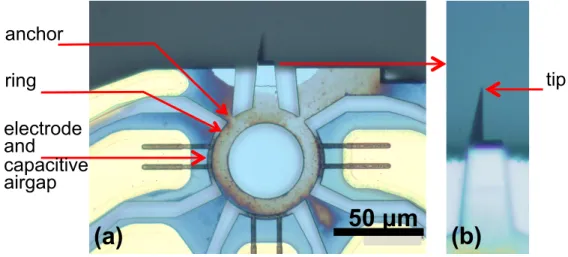
2.1. Probe descriptionThe MEMS AFM probes exploit the elliptical mode of a single-crystal silicon ring as shown in Figure 1. The tip is located at one of the maxima of displacement of the ring, the in-plane vibration of the ring inducing the radial oscillation of the tip [22, 24]. Electrodes are located at the other maxima of displacement, separated from the ring by an air gap. They act as capacitive electromechanical transducers able to drive and sense the ring vibration. Consequently, no external actuator nor optical detection unit are required to use the probe. Four beams anchor the resonator to the substrate. The batch fabrication of the probes starts from a silicon-on-insulator (SOI) wafer with a 5-μm thick (100) silicon top layer, a 2-μm thick buried oxide layer and a 380-μm thick silicon handle layer. The probe body is first etched using a combination of photolithography and deep reactive ion etching (DRIE). The capacitive transduction air gap is defined by a thermally-grown sacrificial oxide layer. Polycrystalline silicon deposition and patterning are then performed to define the electrodes. Afterwards, the probe in-plane tip is fabricated using a process similar to the one developed by Ried et al. [27] that can yield curvature radius at the tip apex lower than 10 nm. Back-end steps consist of metallization for electrical contacts and backside etching (DRIE) of the probe holder to leave the tip apex prominent from its support. Finally, the devices are released using vapor hydrogen fluoride (HF) sacrificial etching of oxide. More details of the fabrication process can be found elsewhere [28].
The resonance frequency f0 and stiffness Keff of the MEMS AFM probe depend on the
material properties and ring dimensions. Previous studies made use of 500-μm outer diameter rings that yielded resonance frequencies close to 1 MHz [24]. In the present work, a 60-μm outer diameter ring allows to reach resonance frequencies greater than 10 MHz. Table 1 summarizes the parameters and dimensions that are used in this study. Whereas analytical approaches can be used to predict the mode shape and eigenfrequencies of the in-plane elliptical vibration of a free ring [24, 29, 30], finite element modeling (FEM) is required here to take into account the effect of the mass and stiffness added by the tip and the anchors, and to obtain an accurate description of the MEMS AFM probe vibration. Figure 2 shows FEM modal analysis of the MEMS AFM probe displacement. It clearly shows the radial displacement of the probe tip. As a consequence, the probe chip will be mounted vertically in the AFM setup. For the parameters of Table 1, the resonance frequency f0 = 13.893 MHz and the effective
stiffness at the tip location is Keff = 198 kN/m. One can note that the amplitudes of the 4
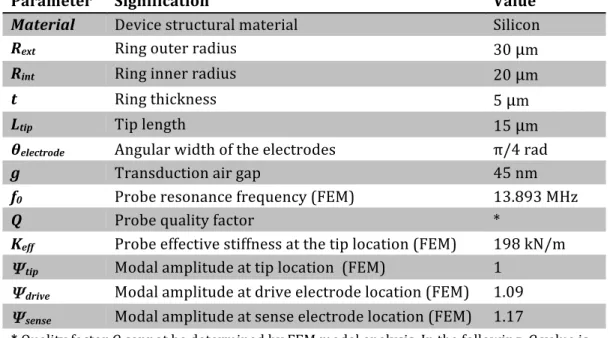
maxima of vibration of the ring are unbalanced, which is explained by the presence of the tip that breaks the symmetry of the ring resonator. Table 1: MEMS AFM probe parameters and dimensions
Parameter Signification Value
Material Device structural material Silicon
Rext Ring outer radius 30 μm
Rint Ring inner radius 20 μm
t Ring thickness 5 μm
Ltip Tip length 15 μm
θelectrode Angular width of the electrodes π/4 rad
g Transduction air gap 45 nm f0 Probe resonance frequency (FEM) 13.893 MHz Q Probe quality factor * Keff Probe effective stiffness at the tip location (FEM) 198 kN/m Ψtip Modal amplitude at tip location (FEM) 1 Ψdrive Modal amplitude at drive electrode location (FEM) 1.09 Ψsense Modal amplitude at sense electrode location (FEM) 1.17 * Quality factor Q cannot be determined by FEM modal analysis. In the following, Q value is obtained from the experimental measurement of the probe resonance frequency response.
Figure 1: (a) Optical microscopy image of a MEMS AFM probe. (b) Close view of the tip apex. Color variations of the surface of the device come from the fabrication process and do not affect the probe operation.
Figure 2: Finite element modeling of the MEMS AFM probe showing the elliptical mode shape under consideration. Resonance frequency is 13.893 MHz. Calculations take into account the anisotropy of the mechanical properties of silicon. 2.2. Actuation and detection methods In the following, a lumped description is considered to establish the electromechanical behavior of the MEMS AFM probe, its tip being chosen as the lumped element. Capacitive transducers are used to drive and sense the vibration of the MEMS AFM probe. Actuation is obtained thanks to the electrostatic force induced by a DC + AC voltage
applied to one of the electrodes of the probe. Assuming elliptical ring displacement, small vibration amplitudes and negligible capacitive fringe effects, the effective driving force amplitude Fdrive acting on the resonator can be written as:
50 µm
(a)
(b)
anchor ring electrode and capacitive airgap tip𝐹!"#$% =𝜀!𝑡𝑅!"#sin 𝜃!"#$% 𝑔! 𝜓!"#$% 𝜓!"# 𝑉!"𝑉!" (Equation 1) where 𝜃!"#$% = 𝜃!"!#$%&'! is the angular width of the drive electrode, 𝜓!"#$% is the modal displacement of the ring resonator at the drive electrode location, 𝜓!"# is the modal
displacement at the tip location, Vdc and Vac are the DC voltage and the time varying
voltage applied to the drive electrode, respectively. 𝜓!"#$% and 𝜓!"# are given in Table 1 and are obtained from the FEM modal analysis presented in Figure 2. They are introduced in Eq.1 to take into account the displacement asymmetry of the maxima of vibration of the ring as described in the previous section. For the dimensions given in Table 1, the effective driving force is typically in the range of 500 nN for Vdc = Vac = 1 V.
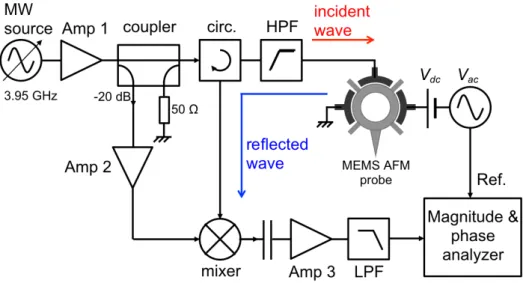
The mechanical vibration is sensed through another electrode of the probe. A common detection setup for capacitive MEMS devices consists in detecting the current flowing from the time varying capacitance of the transducer when a voltage is applied to the electrode. This method has two drawbacks that are detrimental to signal-to-noise ratio (SNR) and measurement resolution, especially for high frequency devices. First, capacitive transducers present very high impedances that significantly exceed the 50-ohm standard [31], leading to poor transduction efficiency and low sensitivity. Second, input-output capacitive feedthrough generates a parasitic signal floor that may mask the electromechanical signal. In order to circumvent this issue and to recover optimal measurement sensitivity, dynamic and SNR, the authors developed a detection method based on microwave (MW) reflectometry. The setup is schematically shown in Figure 3 and was studied in details elsewhere [25]. Operation principle is based on the reflection of a GHz incident wave by the probe electromechanical transducer. The reflection coefficient is modulated in phase by the time varying capacitance ruled by the probe vibration. The reflected wave is directed through the circulator to the frequency mixer. Homodyne detection is then performed in quadrature with respect to the reference wave, which yields the down-converted electromechanical signal. Assuming small vibration amplitudes, the detection setup generates an output voltage Vsense proportional
to the probe vibration amplitude A given by: 𝑉!"#!" = 𝐺 𝑃!"𝑍! 2𝑍!𝜔!" 1 + 𝑍!𝐶!𝜔!" ! 𝜀!𝑡𝑅!"#sin 𝜃!"#!"𝜓!"#!" 𝑔!𝜓 !"# 𝐴 (Equation 2)
where 𝜃!"#!" = 𝜃!"!#$%&'! is the angular width of the drive electrode, 𝜓!"#!" is the modal
displacement of the ring resonator at the sense electrode location, PMW and 𝜔!" are the
microwave incident power and angular frequency, respectively, G is the gain of the microwave readout circuit, including circulator losses, cable losses, mixer conversion losses, low noise amplifier gain, C0 is the overall capacitance of the transducer port
including parasitic capacitors in parallel, and Z0 = 50 Ω is the characteristic impedance.
The use of a microwave intermediate frequency allows on the one hand to reject any direct capacitive crosstalk of the driving signal, and on the other hand to enhance the sensitivity. Indeed, Eq.2 shows that the microwave frequency can be chosen equal to 𝜔!" = 𝑍!𝐶! !! to maximize the electromechanical efficiency between A and Vsense. The
detection circuit is implemented using parts indicated in Figure 2. Measurement resolution depends in a first approach on the noise of the microwave source that is
reflected by the probe transducer and superimposes to the detection signal. Therefore, microwave parts of the circuit have to be selected for very low-noise and low-loss operation. A displacement resolution of 1 fm/√Hz was achieved with such a detection method [26]. Finally, using Eq.1, Eq.2 and the AFM resonator mechanical equation, the electrical transfer function H(f) of the MEMS AFM probe can be written in harmonic regime as: 𝐻 𝑓 =𝑉!"#!" 𝑓 𝑉!" 𝑓 = 𝐺 2𝑍!𝜔!" 1 + 𝑍!𝐶!𝜔!" ! 𝑃!"𝑍!𝑉!" 𝜀!𝑡𝑅!"# !sin 𝜃 !"#$%sin 𝜃!"#!" 𝑔! 𝜓!"#$%𝜓!"#!" 𝜓!"#! × 𝑄 𝐾!"" 1 𝑄 1 −𝑓𝑓! !! + 𝑗 𝑓 𝑓! (Equation 3) Consequently, any mechanical interaction sensed by the probe tip inducing a change in the probe vibration is translated in a change in the magnitude and phase of the output signal Vsense as for any other AFM system. For the detection setup presented in Figure 3,
PMW = 12.5 dBm, 𝜔!" = 3.95 GHz , G was estimated to 15.5 dB, and the overall
capacitance of the transducer port was determined to C0 = 0.3 pF.
Figure 3: Schematic of the microwave detection circuit of the MEMS AFM probe vibration. MW source: Mini-Circuits ZX95-3997. Amp 1 and Amp 2: amplifiers Mini-Circuits ZX60-4016E. Amp 3: amplifier Mini-Circuits ZFL-1000LN. Mixer: Mini-Circuits ZMX-7GLHR. Circ.: circulator MTC G151. Coupler: directional coupler Omni-Spectra 20 dB 2-18 GHz, HPF: Mini-Circuits high-pass filter SHP-400, LPF: Mini-Circuits low-pass filter SLP-100. Magnitude and phase analyzer: lock-in amplifier Zurich Instruments HF2LI. The MW source frequency is tuned to optimize the phase delay and signal demodulation by the mixer.
2.3. AFM setup
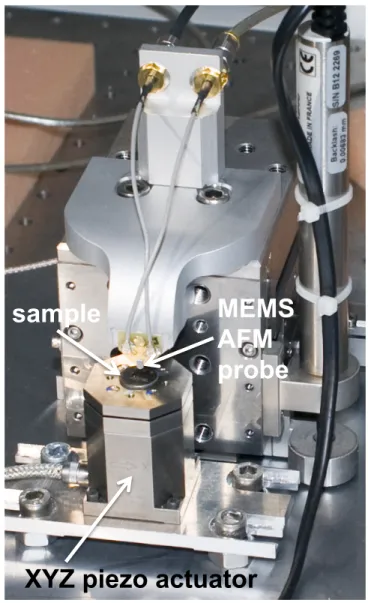
The MEMS device was integrated as an AFM head in a specifically designed homemade AFM microscope shown in Figure 4. The silicon chip supporting the microfabricated probe was glued on the tip of a V-shaped mini printed circuit board (PCB) with conductive silver epoxy (CW2400, ITW Chemtronics), and connected by 20 µm diameter gold wires to gold high frequency compatible transmission lines. The PCB was equipped with two high frequency connectors for MEMS AFM probe excitation and microwave detection. The probe holder was screwed to a L-shaped aluminum block that was fixed to a XYZ precision stage (562-XYZ, Newport). The Z-axis displacement was controlled by a stepper motor actuator (TRA12PPD, Newport) dedicated to surface approach. Excitation of the MEMS AFM probe and signal acquisition from the microwave detection circuit were performed by a lock-in amplifier (HF2LI-PLL, Zurich Instruments). The AFM scanner was a 5 µm × 5 µm × 5 µm PicocubeTM piezo scanner (P-363, PI) driven by the E-536 controller. A commercial AFM controller (RC4, SPECS Nanonis) was used for driving the instrument, with a Labview-based modular software that allows automatic surface approach, feedback loop control and image acquisition. Figure 4: Image of the AFM setup. It enables to mount the MEMS probe vertically with respect to the sample surface.
XYZ piezo actuator
MEMS
AFM
probe
sample
3. MEMS AFM probe characterization
3.1. Frequency response
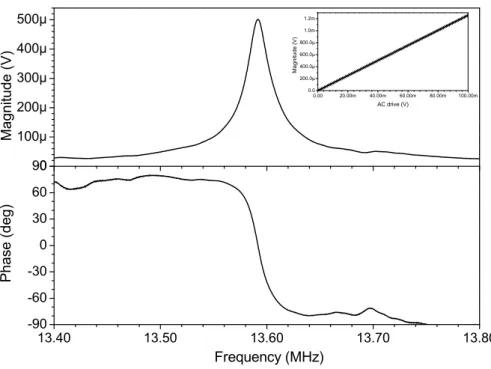
Figure 5 shows the frequency response of the MEMS AFM probe for Vdc = 2 V and Vac =
40 mVpeak, measured in air and at room temperature using the setup of Figure 3. The
resonance frequency and quality factor are f0 = 13.592 MHz and Q = 760, respectively.
The lorentzian shape of the resonance peak and the phase rotation close to 180 degrees confirm that no significant input/output crosstalk is superimposed to the measurement signal. The slight discrepancy of the resonance frequency in comparison with the FEM results of Table 1 is attributed to alterations of the probe dimensions during the fabrication process steps, mainly lithography and etching, and to approximate modeling of the tip geometry. Some signal variations are noticeable out of the resonance peak. They are attributed to unexpected out-of-plane displacements of the probe. Magnitude signal at resonance is Vsense = 500 μVrms, which is consistent with the value that can be
calculated from Eq.3. The linear dependence between Vac and Vsense was verified for Vac
ranging from 0 to 100 mVpeak as shown in the inset of Figure 5.
Figure 5: Frequency response in magnitude and phase of the MEMS AFM probe measured in air and at room temperature. Actuation voltages are Vdc = 2V and Vac = 40 mVpeak. Resonance frequency is
13.592 MHz and quality factor is 760. Inset: Magnitude at the resonance frequency for Vdc = 2 V as a function of the driving voltage Vac. ! "!!# $!!# %!!# &!!# '!!# "%(&! "%('! "%()! "%(*! "%(+! ,-! ,)! ,%! ! %! )! -! M ag ni tu de ( V ) Frequency (MHz) P ha se ( de g) !"!! #!"!!$ %!"!!$ &!"!!$ '!"!!$ (!!"!!$ !"! #!!"!) %!!"!) &!!"!) '!!"!) ("!$ ("#$ M ag ni tu de ( V ) AC drive (V)
3.2. Noise considerations and probe calibration
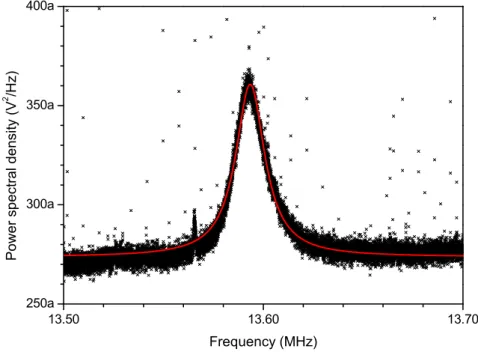
The spectral response of the MEMS AFM probe is obtained at room temperature T = 295 K for Vdc = Vac = 0 V thanks to the fast Fourier transform (FFT) function of the
lock-in amplifier of the measurement setup. The result is displayed in Figure 6. The resonance of the probe driven by the thermomechanical noise force is clearly visible. A lorentzian fit allows to extract the resonance frequency f0 = 13.593 MHz and the quality
factor Q = 768, which is in good agreement with the values obtained in forced regime in Figure 5. The 1-kHz shift of the resonance towards the low frequencies observed for forced oscillations is explained by the spring softening effect caused by the DC voltage Vdc that applies an attractive electrostatic force gradient to the probe resonator.
Figure 6: Vibrational noise spectrum of the MEMS AFM probe at room temperature without any driving signal. Data were averaged over 10 000 spectra, resolution bandwidth was set to 14 Hz. The red solid line corresponds to a lorentzian fit of the data. Resonance frequency is 13.593 MHz and quality factor is 768 ± 9. The sharp peak at 13.565 MHz comes from external parasitic signal and does not correspond to mechanical information.
The spectrum in Figure 6 consists of the superimposition of the electrical noise floor of the detection setup and of the thermomechanical displacement noise of the probe. It comes from the lorentzian fit parameters that the noise floor power spectral density (PSD) is 𝑒!"#$%_!"##$! = 274 ± 2 aV!/Hz and the thermomechanical displacement noise
PSD at resonance corresponds to 𝑒!"#$%_!"#$%! = 87 ± 2 aV!/Hz. Besides, Eq. 4 gives the
thermomechanical displacement noise PSD at resonance of a resonator [32]: 𝑎!"#$%_!"#$%! =𝜋𝑓2𝑘!𝑇𝑄 !𝐾!!! (Equation 4) where kB the Boltzmann constant and T the temperature.
Eq. 4 yields 𝑎!"#$%_!"#$%! = 740 ± 150 ×10!!! m!/Hz for the probe parameters under
consideration taking into account a 20 % uncertainty for the resonator stiffness Keff.
Indeed, the true value of Keff may differ from the one predicted by FEM calculations (see
13.50 13.60 13.70 250a 300a 350a 400a P o w e r sp e ct ra l d e n si ty ( V 2 /H z) Frequency (MHz)
Table 1) due to the fabrication process steps that may slightly alter the probe in-plane dimensions and to the uncertainty concerning the thickness of the device material. The calibration factor C between Vsense and the probe displacement A is then obtained from
Eq. 4 and the results of Figure 6: 𝐶 = 𝐴 𝑉!"#!" = 𝑎!"#$%_!"#$%! 𝑒!"#$%_!"#$%! = 92 ± 10 nm/V (Equation 5) Finally, considering that the electrical noise floor of the detection setup determines the measurement resolution, the limit of detection (LOD) in displacement and force are deduced to be equal to 1.5 fm/√Hz and 0.4 pN/√Hz, respectively. Table 2 summarizes the main figures related to noise and resolution of the detection setup and of the MEMS AFM probe.
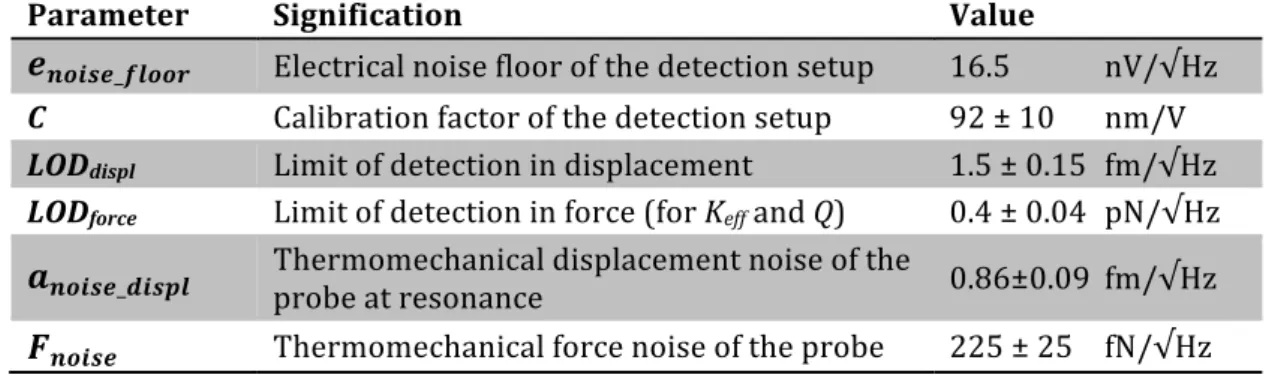
Table 2: Noise and measurement resolution of the detection set-up and of the MEMS AFM probe
Parameter Signification Value
𝒆𝒏𝒐𝒊𝒔𝒆_𝒇𝒍𝒐𝒐𝒓 Electrical noise floor of the detection setup 16.5 nV/√Hz
C Calibration factor of the detection setup 92 ± 10 nm/V
LODdispl Limit of detection in displacement 1.5 ± 0.15 fm/√Hz LODforce Limit of detection in force (for Keff and Q) 0.4 ± 0.04 pN/√Hz
𝒂𝒏𝒐𝒊𝒔𝒆_𝒅𝒊𝒔𝒑𝒍 Thermomechanical displacement noise of the probe at resonance 0.86±0.09 fm/√Hz 𝑭𝒏𝒐𝒊𝒔𝒆 Thermomechanical force noise of the probe 225 ± 25 fN/√Hz Additionally, some guidelines can be assessed concerning the operating conditions for AFM experiments. A bandwidth of 1 kHz and a 60-dB SNR are usually desirable values for the measurement of the probe vibration amplitude. It is calculated from the data of Table 2 that they are theoretically obtained at the resonance frequency for a vibration amplitude 𝐴!"# = 𝐿𝑂𝐷!"#$%! + 𝑎 !"#$%_!"#$% ! × 2× 𝐵𝑊×10!"#!" = 77 pm peak, where BW
is the measurement bandwidth and SNR the signal-to-noise ratio. Such a value is 2 orders of magnitude lower than the amplitude typically used for a standard cantilever, which is due to a lower thermomechanical displacement noise coming from the much higher stiffness of the MEMS AFM probe. It is worthwhile to note that quartz crystal AFM probes are employed in experiments with similar vibration amplitudes [18], leading to high-quality and high-resolution topographic images.
In the experimental conditions of Figure 5 where Vdc = 2 V and Vac = 40 mVpeak , the
output signal Vsense = 500 μVrms at resonance corresponds to a vibration amplitude of the
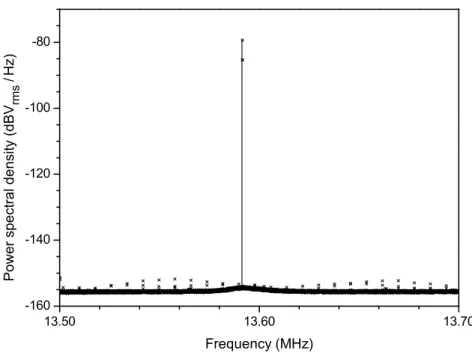
MEMS AFM probe tip of Ares = 65 pmpeak. Figure 7 shows the PSD of the MEMS AFM
probe output signal using these driving conditions. The peak of the forced oscillation is visible above the vibration noise spectrum of the probe. In particular, no extra noise is added by the driving signal close to the carrier, which foreshadows an optimal SNR for the following AFM experiments.
Figure 7: Vibrational noise spectrum of the MEMS AFM probe driven at the resonance frequency of 13.592 MHz with Vdc = 2 V and Vac = 40 mVpeak. Data were averaged over 1 000 spectra, resolution
bandwidth was set to 14 Hz.
3.3. Stability study
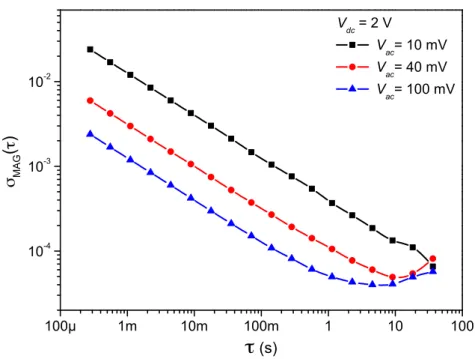
Besides noise analysis that governs the measurement resolution as discussed in the previous section, the long-term stability of the probe free vibration signal is essential for AFM close-loop operation. Indeed, vibration amplitude or natural frequency is used as the feedback signal in comparison with a setpoint value. Any change of these free vibration characteristics during close-loop operation leads to a change of the intensity of the tip-to-surface mechanical interaction as a response of the feedback control. This is all the more important as the effective stiffness of the MEMS AFM probe is very high: the ratio between the setpoint and the free vibration value needs to be accurately controlled to a value slightly less than 1 so as to guarantee gentle mechanical interaction between the tip and the surface. In such an operating condition, tiny variations of the free vibration characteristics during imaging can cause an increase in the tip-to-surface interaction leading to damages to the probe tip apex and sample surface. Sources of long-term fluctuations of the vibration signal are multiple. A main contribution comes from the fluctuation of the ambient temperature. Indeed, silicon elastic modulus decreases with temperature, which is responsible for a temperature coefficient of frequency (TCF) of the MEMS AFM probe of about –20 to –30 ppm/K typically. Furthermore, drifts within electronic circuits, including power supplies, signal synthesizers and amplifiers, also cause fluctuations of the output signal of the MEMS AFM probe. In order to investigate in details the stability, Allan deviation [33] was calculated for the magnitude and the natural frequency of the probe vibration when driven in open-loop condition. Figure 8 shows the results for the magnitude obtained at the probe resonance frequency with Vdc = 2 V and for 3 values of driving voltage Vac. For
integration time values τ < 500 ms, the Allan deviation follows a slope equal to −0.5, meaning that the fluctuations are ruled by the short-term noise described previously. In this regime, the relative deviation is inversely proportional to Vac, i.e. to the vibration
13.50 13.60 13.70 -160 -140 -120 -100 -80 P o w e r sp e ct ra l d e n si ty ( d B V rm s / H z) Frequency (MHz)
amplitude. For longer integration time values τ, the relative deviation reaches a minimum and starts to increase, evidencing effects of long-term fluctuations that degrade the signal stability. The results show that the magnitude, i.e. the free vibration amplitude, does not fluctuate statistically by more than 10-4 over time periods of a few
tens of seconds, which corresponds to the typical acquisition time of a AFM image. Long-term fluctuations are not expected to change the tip-to-surface mechanical interaction intensity during an experiment if the reduction of the vibration amplitude imposed by the setpoint value is significantly greater than the fluctuations. In practice, a setpoint value chosen at 99 % of the free vibration amplitude meets the criterion and demonstrated its ability to yield stable imaging conditions in amplitude-modulation mode (AM AFM) as shown in the next section.
Allan deviation was calculated as well for the natural frequency of the MEMS AFM probe for the same driving conditions as in Figure 8. Similar comments as for the vibration amplitude can be made for the natural frequency fluctuations. Over a time period of a few tens of seconds, the natural frequency does not fluctuate by more than 10-7.
Consequently, long-term fluctuations are not expected to change the tip-to-surface mechanical interaction intensity during FM AFM close-loop operation if the frequency shift imposed by the setpoint value is significantly greater than the fluctuations. In practice, a frequency shift chosen at about 10-5 of the probe resonance frequency meets the criterion, which corresponds to a typical value of 100 Hz, the resonance frequency of the MEMS probe being 13.593 MHz.
Figure 8: Allan deviation (relative sigma values) calculated for the magnitude of the MEMS AFM probe vibration. Data were acquired at a rate of 3 600 Sa/s during 300 s with a signal bandwidth set at 10 kHz. The vibration amplitude is 16, 65, and 162 pmpeak for Vac = 10, 40, and 100 mVpeak,
respectively. !""# !$ !"$ !""$ ! !" !"" !"%& !"%' !"%( Vdc = 2 V Vac= 10 mV Vac= 40 mV Vac= 100 mV σ M A G ( τ )
τ
(s)4. Imaging performances and discussion
Block copolymers with glassy and liquid blocks at room temperature are often used as benchmark surfaces to go beyond imaging morphology with the AFM [34]. It has been shown that topography artifacts easily arise in intermittent-contact mode due to the variation of mechanical properties at the nanometer scale in these viscoelastic materials [35]. At sufficiently large vibration amplitude (typically > 10 nm), usually with cantilevers resonating at frequencies of the order of 100 kHz, the deformation induced by the oscillating tip on the polymer was found to determine the topography. A lamellar structure is then observed, i.e. an alternation of hills and valleys, corresponding respectively to hard and soft self-structured domains [34]. Energy dissipation is modulated as well since the dynamic viscosity varies between the soft and hard polymer phases. Vibration amplitudes given in the following sections are peak values unless otherwise stated.
4.1. Imaging in amplitude-modulation mode (AM AFM)
A commercial AFM (FastScan, Bruker) was used as a benchmark system to image the copolymer surface in amplitude-modulation (AM) mode, also named intermittent-contact mode or "Tapping" mode. The block copolymer sample under study, poly-(methyl methacrylate-(n-butyl acrylate)), was identical to the one used in the previous work by Leclère et al. [34]. As shown below, similar images in height and phase were obtained with a contrast reflecting the alternation of hard and soft domains. The numerical images were processed using the free software Gwyddion [36]. Flattening was performed using "correct line by matching height median", and "remove polynomial background" in the independent degree mode with the maximum degree (= 11). The image contrast was optimized using the "Limit range" tool.
Two types of commercial cantilevers (PPP-NCLR, f0 = 150 kHz, and USC-f2-k3, f0 = 2 MHz,
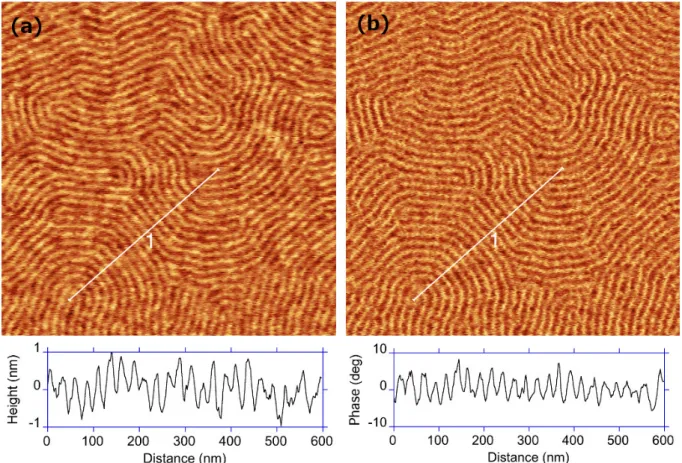
from Nanoworld AG) were used which tip radius was small enough (guaranteed < 10 nm by the manufacturer) to clearly identify the hard domains, appearing as hills in the height image, and the soft ones. Periodicity of approximately 25 nm can be observed in Figure 9. The lamellar structure was observed also on the phase. Lowest values of phase (dark lamellae) in Figure 9 refer to soft domains. High frequency cantilevers USC-f2-k3 gave similar contrast as PPP-NCLR. A similar lamellar periodic structure was observed using the MEMS AFM probe in AM mode as shown in Figure 10, both on height and phase. The setpoint was fixed as near to the free vibration amplitude as possible to avoid applying strong forces on the surface that could damage the sample topography. This was confirmed by scanning the same area several times without any noticeable changes in the resulting images.
In AM AFM the contrast is expected to depend on the average tip-sample interaction force defined approximately by the formula: 𝐹!" =!!""!!!! 1 − !!!"
!
!
, with Keff the
resonator stiffness, Q the quality factor, A0 the free vibration amplitude, and Asp the
setpoint amplitude [37]. Forces are typically below 1 nN during imaging as calculated in Table 3. Note that despite the high stiffness of the MEMS probes, the sub-nm free vibration amplitude A0 combined with the capability to image with a setpoint
Table 3: Typical average tip-sample interaction force in AM AFM for MEMS AFM probes and two commercial cantilevers. Probe type Keff (N/m) Q A0 (nm) Asp/A0 <Fts> (nN) MEMS AFM 198×103 760 0.014 0.98 0.36 PPP-NCLR 20 600 20 0.5 0.29 USC-f2-k3 3 250 30 0.5 0.16 Since the average interaction force remains higher with the MEMS AFM probe than with cantilevers, one would expect to observe a higher lamellar peak-to-peak height, provided the tip radii were similar. Alternatively, increasing the excitation frequency may lower the mechanical contrast between hard and soft blocks [38]. Indeed, the peak-to-peak height was lower when imaged with the MEMS AFM probe than with the cantilever for a similar interaction force as shown in Figure 10 compared to Figure 9. It can however be observed that the lateral extension of the white lamellae seems larger when imaged with MEMS AFM probe (Figure 10 versus Figure 9), which would suggest that its tip radius is larger than that of cantilevers. Actually this is not the case due to the specific operation of the MEMS AFM probe that differs from intermittent contact or “Tapping” mode. This will be detailed in the section 4.3. Figure 9: (a) Height and (b) phase recorded in air with the FastScan Bruker and NCLR cantilevers. Scan area = 1 µm × 1 µm. Scan resolution = 512 × 512 pixels. Scan rate = 4 Hz. Asp = 10 nm (= A0 / 2). Fts = 0.29 nN.
Figure 10: Height and phase recorded in air with the MEMS AFM probe. Scan area = 1 µm × 1 µm. Scan resolution = 512 × 512 pixels. Scan rate = 2 Hz. Asp = 13.7 pm (= 0.98 × A0). Fts = 0.36 nN. 4.2. Imaging in frequency-modulation mode (FM AFM) FM AFM allows separating straightforwardly conservative forces from dissipative forces. The Z-feedback is operated on the frequency shift δf, measured by the phase-locked loop (PLL), and thus on the force gradient [39]. All images presented in this article were acquired with a positive frequency shift setpoint, which corresponds to the repulsive regime. The Bruker Fastscan AFM was interfaced with SPECS Nanonis OC4 PLL system via the signal access module to operate in FM mode. A typical image is shown below in Figure 11 using a PPP-NCLR cantilever.
Similar images (aesthetically speaking) were recorded with the MEMS AFM probe as illustrated below in Figure 12, although the operating mode is fundamentally different, as it will be demonstrated by Z-spectroscopy experiments in the next section. According to the law of mechanics, the frequency shift experienced by the resonator is given by 𝛿𝑓 = !!
!!!"" 𝑘!" , where 𝑘!" is the average of the tip-sample force gradient over the
vibration amplitude [40]. Since the vibration amplitude is small for the MEMS AFM probe, one can assume that 𝑘!" = 𝑘!"(𝑧). This approximation is not valid for large
amplitudes [41]. The dynamic tip-sample force is then simply expressed as:
Fts(z) = kts(z) × A0. Taking δf = +200 Hz and A0 = 65 pm, it comes that Fts = 0.38 nN, which
is similar to that of AM AFM.
Figure 11: Height (nm) and variation of drive amplitude (V) recorded in air with NCLR cantilevers using FM-AFM mode. Scan area = 1 µm × 1 µm. Scan resolution = 512 × 512 pixels. Scan rate = 2 Hz. Setpoint δf = +100 Hz. A0 = 120 nm.
Figure 12: Height and drive amplitude recorded in air with the MEMS AFM probe using the FM-AFM mode. Scan area = 1 µm × 1 µm. Scan resolution = 512 × 512 pixels. Scan rate = 1 Hz. Setpoint δf = +200 Hz. A0 = 65 pm.
4.3. Z-spectroscopy in FM-AFM mode
Z-spectroscopy allows going beyond imaging and further in the analysis of the tip-sample interaction by recording the frequency shift δf and the relative damping coefficient (D(Z)/D0 − 1), D(Z) being the probe driving voltage, versus Z displacement.
The behavior is strikingly different for the MEMS AFM probe shown in Figure 13 and NCLR cantilevers shown in Figure 14: while cantilevers exhibit a smooth transition between an attractive (δf < 0) and a repulsive regime (δf > 0), the MEMS AFM probe experiences an abrupt positive force gradient and dissipation when approaching the copolymer surface, then a hysteresis during retraction. This is due to the sudden formation of a polymer meniscus linking the tip to the surface owing to van der Waals attractive forces. As a consequence, the Z-feedback during imaging with the MEMS AFM probe at small frequency shift (δf < +500 Hz typically) is operated in contact with a stretched meniscus, corresponding to the backward branch in Figure 13. This was confirmed clearly by visualizing the scanner Z displacement during surface approach and stabilization of the feedback loop. Due to the small amplitude of vibration and to the pinning of the polymer surface at the tip, the frequency shift is directly proportional to the contact stiffness and not to the van der Waals force gradient. In contrast to what occurs with cantilevers operated at large vibration amplitude allowing the tip going in and out a polymer meniscus when approaching the surface, the attractive regime characterized by δf < 0 cannot be measured with the MEMS AFM probe at small amplitude: the soft viscoelastic surface jumps abruptly into contact with the MEMS AFM
probe tip and forms a permanent adhesive contact exhibiting a positive stiffness (see Figure 13). Note that a transient attractive regime should exist during the meniscus formation but the timescale is too short for it to be detected by our experimental set-up.
The shape of δf vs Z in Figure 13 is indeed very similar to the contact stiffness S measured by nano-indentation on viscoelastic samples [42]. Following the analysis of Greenwood and Johnson on viscoelastic adhesive contact [43], the rigid flat punch formula for the frequency dependent stiffness S(f) described by Eq. 6 can be used to extract the reduced modulus E*(f): 𝑆 𝑓 = 2𝑎𝐸∗ 𝑓 with 𝐸∗= 1 1 − 𝜐!! 𝐸! +1 − 𝜐! ! 𝐸! ≈ 𝐸! 1 − 𝜐!! (Equation 6)
where a is the contact radius, Ei the Young modulus and νi the Poisson ratio of the silicon
tip and the copolymer. S corresponds to 𝑘!" and is calculated from the experimental frequency shift using 𝛿𝑓 = !!
!!!"" 𝑘!" . Taking Keff = 198 kN/m, an approximate contact
radius a = 25 nm, estimated from scanning electron microscopy (SEM) observation of the MEMS AFM probe tip, and an experimental stiffness S(f) equal to 90 N/m at its maximum corresponding to a shift frequency of about 2 850 Hz (see Figure 13), Eq. 6 allows estimating that E* = 2 GPa. Such a high value compared to the copolymer static
elastic modulus (≈15 MPa) is at first sight in agreement with the fact that elastic modulus of rubber-like viscoelastic polymers is expected to increase with frequency [38]. Note that the contact radius a differs from the tip apex radius as it depends on the meniscus height that is related to the hysteresis in Z between its formation and its rupture. The meniscus can extend over the apex where the tip radius is larger. Additionally, only the product of the reduced modulus E* and the contact radius a is
actually extracted from Eq. 6. We consider that a value of contact radius a = 25 nm leading to E* = 2 GPa is consistent with the extension of the hysteresis observed in Figure 13 and with the SEM observation of the tip shape. We could have accepted another set of values but a contact radius value a equal to or greater than 50 nm, i.e. leading to E* ≤ 1 GPa, seemed unrealistic. For large vibration amplitudes A0, such as those commonly used with NCLR cantilevers, when A0 >> d, d being the indentation depth, the frequency shift can be calculated with the following formula [44]: 𝛿𝑓 𝑑 = 𝑓! 𝐾!""𝐴!! ! 1 2 2𝐸 ∗ 𝑅 !"#𝑑! (Equation 7)
where E* is the reduced modulus as previously defined, and Rtip the tip radius. Another
underlying assumption is that the cantilever tip can be approximated by a paraboloid so that the indentation model developed by Sneddon can be applied [45].
The experimental δf versus Z displacement curve in Figure 14 obtained using NCLR cantilevers is fitted using Eq. 7, which exhibits indeed a parabolic dependence versus Z at
least when Z << A0. An approximate value of the reduced modulus E* = 20 MPa is
extracted assuming a cantilever tip radius Rtip = 5 nm. This value is not much larger than
the static modulus, which is rather surprising and somehow in contradiction with the result obtained at high frequency with the MEMS. Even more surprising is that we have obtained a similar value with the USC-f2-k3 cantilever resonating at 2.3 MHz. We expected instead a progressive increase of the modulus with the excitation frequency. We have no clear answer to this observation yet, and more work is needed to extract quantitative mechanical data from dynamical indentation on soft surfaces.
Figure 13: Frequency shift and relative damping coefficient (D/D0-1) versus Z with the MEMS AFM
probe on copolymer surface. A0 = 65 pm. The initial regulation setpoint before starting the
Z-spectroscopy experiment was δf = + 200 Hz. The starting point was fixed at 15 nm above the relative Z = 0 position. The Z piezo is then expanded until δf reaches + 500 Hz, and retracted back to the initial point. Sweep time = 10 s. The maximum frequency shift, approx. 3 000 Hz, was used to calculate the contact stiffness and the reduced modulus (see text).
Figure 14: Frequency shift and relative damping coefficient (D/D0-1) versus Z with NCLR
cantilevers on copolymer surface. A0 = 30 nm. Sweep time = 10 s. Black curve is the fit using the
4.4. Discussion
The first result that has to be appreciated is that soft viscoelastic materials such as block copolymers can be easily imaged by the MEMS AFM probes in quasi-contact dynamic mode with small displacement amplitudes in both amplitude- and frequency-modulation modes. This was not taken for granted initially because of the very high stiffness of the probes in the 200 kN/m range. Due to the high sensitivity of the microwave detection set-up and the low thermomechanical displacement noise of the resonator, the MEMS AFM probe can be driven at very low vibration amplitudes (down to 10 pm typically), so that the maximum peak force exerted on the sample remains low, below 1 nN. We are not aware of any other work reporting imaging soft materials with such high-stiffness probes.
Moreover, the usual modus operandi of AFM in “Tapping” mode with cantilevers cannot be applied to MEMS AFM probes on viscoelastic materials because of the high probe stiffness, the low vibration amplitude and the attractive adhesion force. Cantilevers in air are usually driven in the repulsive regime at large amplitude (> 10 nm) to provide a clear contrast of mechanical properties on such heterogeneous samples as block copolymers. The contrast vanishes in the attractive regime. With MEMS AFM probes, the high stiffness induces a mechanical instability of the polymer surface towards the tip, leading to the formation of a stretched meniscus (see sketch of Figure 13) stabilized by the adhesion force. The low vibration amplitude allows the contact line to remain pinned by tip defects and the regulation operates on the contact stiffness. With the MEMS AFM probes, images are acquired in this regime without loss of contrast and with minimum (adhesive) interaction with the surface. The tip-sample interaction can be modeled by a punch-like viscoelastic oscillating contact, following the analysis of Greenwood and Johnson. The frequency shift is simply proportional to the contact stiffness given by Eq. 6. The MEMS AFM appears to be a unique tool to give access to the high frequency viscoelastic properties at nanometer scale on thin films.
5. Conclusions
In this paper, we have studied the characteristics and capabilities of ring-shaped micro-resonators for AFM applications. They are batch-fabricated using silicon MEMS technologies, and the inbuilt silicon tip presents an apex radius around 10 nm. A major feature of these probes is their resonance frequency, 13.6 MHz in the present study, which is higher than that of short cantilevers (5 MHz) and quartz-based probes (1 MHz). They integrate on-chip capacitive transducers for electrical actuation and detection of the tip oscillation. A dedicated microwave detection set-up allows measuring the thermomechanical noise displacement of the resonator with a measurement resolution of 1.5 fm/√Hz. Consequently, the signal-to-noise ratio remains high enough to make AFM images with vibration amplitudes as low as 10 pm. Thanks to this exquisite displacement sensitivity and to the stability of the probe oscillation over tens of seconds, the average tip-sample interaction force can be kept below 1 nN during AFM imaging despite the high effective stiffness of the probe resonator. Such a value is comparable to what is usually achieved with cantilevers, preventing surface and tip damage. Imaging capabilities have been demonstrated in both amplitude-modulation and frequency-modulation modes on block copolymer thin films which present an alternation of softand hard lamellar domains. The MEMS AFM probe straightforwardly resolved the 25-nm period of the lamellar structure, which demonstrates that the MEMS probe is sensitive to mechanical properties of the surface. However, Z-spectroscopy experiments reveal that the interaction regime with the surface is drastically different from that of intermittent contact or “Tapping” usually obtained with cantilevers in air. In comparison to cantilevers, the MEMS AFM probe stiffness is higher by 4 to 5 orders of magnitude and the vibration amplitude smaller by 3 orders of magnitude. This leads to a permanent adhesion between the tip and the surface due to contact line pinning, and the interaction regime can be described as a viscoelastic oscillating contact. These MEMS AFM probes pave the way not only for studies of the high frequency rheological properties of materials at the nanoscale but also for large-bandwidth and time-resolved AFM measurements.
Acknowledgments
The authors acknowledge the French technological Network RENATECH and in particular IEMN cleanroom staff. We thank the instrumentation engineers and craftsmen of CRPP for their support in building the AFM set-up. This work has been supported by the French National Research Agency through project PIA VIBBNANO ANR-10-NANO-04-01 and project VIBRATIONS ANR-12-EMMA-0039-01. It also received financial support from the European Community’s Seventh Framework Program FP7/2007-2013 under Grant 210078 and Grant 297518, and from CNRS under project MI 2016 DYNAMIC.
References
[1] Atomic Force Microscope, G. Binnig, C.F. Quate and Ch. Gerber, Physical Review Letters, 56, 9 (1986) 930-933 [2] Atomic resolution with atomic force microscope, G. Binnig, Ch. Gerber, E. Stoll, T.R. Albrecht and C.F. Quate, Surface Science, 189-190, (1987) 1-6 [3] Probing protein-protein interactions in real time, M.B. Viani, L.I. Pietrasanta, J.B. Thompson, A. Chand, I.C. Gebeshuber, J.H. Kindt, M. Richter, H.G. Hansma, and P.K. Hansma, Nature Structural Biology, 7, 8 (2000) 644-647 [4] High-speed atomic force microscopy for nano-visualization of dynamic biomolecular processes, T. Ando, T. Uchihashi and T. Fukuma, Progress in Surface Science, 83, 7-9 (2008) 337-437 [5] Video imaging of walking myosin V by high-speed atomic force microscopy, N. Kodera, D. Yamamoto, R. Ishikawa and T. Ando, Nature, 468 (2010) 72-76 [6] High-Speed Force Spectroscopy Unfolds Titin at the Velocity of Molecular Dynamics Simulations, F. Rico, L. Gonzales, I. Casuso, M. Puig-Vidal, and S. Scheuring, Science, 342 (2013) 741-743[7] Dynamic force microscopy by means of the phase-controlled oscillator method, U. Dürig, H.R. Steinauer and N. Blanc, Journal of Applied Physics, 82, 8 (1997) 3641-3651 [8] Identification of nanoscale dissipation processes by dynamic atomic force microscopy, R. Garcia, C. J. Gómez, N. F. Martinez, S. Patil, C. Dietz, and R. Magerle, Physical Review Letters, 97 (2006) 016103 [9] Quantitative measurement of the mechanical contribution to Tapping-Mode atomic force microscopy images of soft materials, S. Kopp-Marsaudon, P. Lecière, F. Dubourg, R. Lazzaroni and J.P. Aimé, Langmuir, 16, 22 (2000) 8432-8437 [10] See for example the ‘OmegaLever’ and ‘BioLever fast’ products from Olympus at http://probe.olympus-global.com (last accessed: 07/20/2016) [11] See for example the Dimension Fastscan product from Bruker at http://www.bruker.com (last accessed: 11/29/2016) or the high-speed atomic force microscope – Ando model products from RIBM at http://www.ribm.co.jp (last accessed: 11/29/2016) [12] Micromachined atomic force microprobe with integrated capacitive read-out, J. Brugger, R.A. Buser and N.F. de Rooij, Journal of Micromechanics and Microengineering, 2, 3 (1992) 218-220 [13] Parallel atomic force microscopy using cantilevers with integrated piezoresistive sensors and integrated piezoelectric actuators, S.C. Minne, S.R. Manalis and C.F. Quate, Applied Physics Letters, 67, 26, (1995) 3918-3920 [14] Feedback positioning cantilever using lead zirconate titanate thin film for force microscopy observation of micropattern, T. Fujii and, S. Watanabe, Applied Physics Letters, 68, 4 (1996) 467-468 [15] Electrothermally driven high-frequency piezoresistive SiC cantilevers for dynamic atomic force microscopy, R. Boubekri, E. Cambril, L. Couraud, L. Bernardi, A. Madouri, M. Portail, T. Chassagne, C. Moisson, M. Zielinski, S. Jiao, J.-F. Michaud, D. Alquier, J. Bouloc, L. Nony, F. Bocquet, C. Loppacher, D. Martrou and S. Gauthier, Journal of Applied Physics, 116, 5 (2014) 054304 [16] High-speed force sensor for force microscopy and profilometry utilizing a quartz tuning fork, F.J. Giessibl, Applied Physics Letters, 73, 26 (1998) 3956-3958 [17] Atomically-resolved imaging by frequency-modulation atomic force microscopy using a quartz length-extension resonator, T. An, T. Eguchi, K. Akiyama and Y. Hasegawa, Applied Physics Letters, 87, 13 (2005) 133114 [18] Optimizing atomic resolution of force microscopy in ambient conditions, D.S. Wastl, A.J. Weymouth and F.J. Giessibl, Physical Review B, 87 (2013), 245415 [19] See for example the specifications of the Kolibri sensor product from SPECS at http://www.specs.de (last accessed: 11/29/2016) [20] Microelectromechanical resonators for radio frequency communication applications, J. Basu and T.K. Bhattacharyya, Microsystem Technologies, 17, 10 (2011) 1557-1580
[21] Proposition of atomic force probes based on silicon ring-resonators, M. Faucher, B. Walter, A.S. Rollier, K. Segueni, B. Legrand, G. Couturier, J.P. Aimé, C. Bernard, R. Boisgard and L. Buchaillot, Proceedings of the 14th International Conference on Solid-State Sensors, Actuators and Microsystems TRANSDUCERS'07, Lyon, France, june 10-14, 2007, 1529-1532 [22] Design and operation of a silicon ring resonator for force sensing applications above 1 MHz, B. Walter, M. Faucher, E. Algré, B. Legrand, R. Boisgard, J.P. Aimé and L. Buchaillot, Journal of Micromechanics and Microengineering, 19, 11 (2009) 115009 [23] Tip-matter interaction measurements using MEMS ring resonators, E. Algré, B. Legrand, M. Faucher, B. Walter and L. Buchaillot, Proceedings of the 15th International Conference on Solid-State Sensors, Actuators and Microsystems TRANSDUCERS'09, Denver CO (USA), june 21-25, 2009, 1638-1641 [24] MEMS ring resonators for laserless AFM with sub-nanoNewton force resolution, E. Algré, Z. Xiong, M. Faucher, B. Walter, L. Buchaillot and B. Legrand, Journal of Microelectromechanical Systems, 21 (2012) 385-397 [25] Detecting response of microelectromechanical resonators by microwave reflectometry, B. Legrand, D. Ducatteau, D. Théron, B. Walter, and H. Tanbakuchi, Applied Physics Letters, 103, 5 (2013) 053124 [26] When capacitive transduction meets the thermomechanical limit: Towards femto-Newton force sensors at very high frequency, S. Houmadi, B. Legrand, J.P. Salvetat, B. Walter, E. Mairiaux, J.P. Aimé, D. Ducatteau, P. Merzeau, L. Buisson, J. Elezgaray, D. Théron, and M. Faucher, Proceedings of 28th IEEE Conference on Micro Electro Mechanical Systems MEMS 2015, Estoril, Portugal, january 18-22, 2015, 150-153 [27] 6-MHz 2-N/m piezoresistive atomic-force-microscope cantilevers with INCISIVE tips, R.P. Ried, H.J. Mamin, B.D. Terris, L.S. Fan and D. Rugar, Journal of Microelectromechanical Systems, 6, 4 (1997) 294-302 [28] DNA origami imaging with 10.9 MHz AFM MEMS probes, B. Walter, M. Faucher, E. Mairiaux, Z. Xiong, L. Buchaillot and B. Legrand, Proceedings of 25th IEEE Conference on Micro Electro Mechanical Systems MEMS 2012, Paris, France, january 29-february 2, 2012, 555-558 [29] The bending vibration of a circular ring, R. Hoppe, Crelle Journal of Mathematics, 73 (1871) 158–170 [30] Simple frequency expression for the in-plane vibration of thick circular rings, J. Kirkhope, Journal of the Acoustical Society of America, 59, 1 (1976) 86-89 [31] A sub-micron capacitive gap process for multiple-metal-electrode lateral micromechanical resonators, W. T. Hsu, J. R. Clark and C. T.-C. Nguyen, Proceedings of 14th IEEE Conference on Micro Electro Mechanical Systems MEMS 2001, Interlaken, Switzerland, january 22-25, 2001, 349-352 [32] A general procedure for thermomechanical calibration of nano/micro-mechanical resonators, B.D. Hauer, C. Doolin, K.S.D. Beach and J.P. Davis, Annals of Physics, 339 (2013) 181-207
[33] Time and frequency (Time-Domain) characterization, estimation, and prediction of precision clocks and oscillators, D.W. Allan, IEEE Transations on Ultrasonics, Ferroelectrics, and Frequency Control, UFFC-34, 6 (1987) 647-654 [34] Dynamic force microscopy analysis of block copolymers: beyond imaging the morphology, P. Leclère, F. Dubourg, S. Kopp-Marsaudon, J.L. Brédas, R. Lazzaroni and J.P. Aimé, Applied Surface Science, 188 (2002) 524-533 [35] Tapping-mode AFM studies using phase detection for resolution of nanophases in segmented polyurethanes and other block copolymers, R.S. McLean and B.B. Sauer, Macromolecules, 30 (1997) 8314-8317
[36] See: http://gwyddion.net (last accessed : 11/29/2016)
[37] Peak forces and lateral resolution in amplitude modulation force microscopy in liquid, H.V. Guzman and R. Garcia, Beilstein Journal of Nanotechnology, 4 (2013) 852-859 [38] Viscoelastic properties of polymers, J.D. Ferry, 2nd edition, Wiley, New York (1970) [39] Frequency modulation detection using high-Q cantilevers for enhanced force microscope, T.R. Albrecht, P. Grütter, D. Horne and D. Rugar, Journal of Applied Physics, 69 (1991) 668-673 [40] Atomic force microscope force mapping and profiling on a sub 100-a scale, Y. Martin, C.C. Williams and H.K. Wickramasinghe, Journal of Applied Physics, 61 (1987) 4723-4729 [41] Forces and frequency shifts in atomic-resolution dynamic-force microscopy, F.J. Giessibl, Physical Review B, 24 (1997) 16010-16015 [42] Oscillating adhesive contacts between micron-scale tips and compliant polymers, K.J. Wahl, S.A.S. Asif, J.A. Greenwood and K.L. Johnson, Journal of Colloid and Interface Science, 296 (2006) 178-188 [43] Oscillatory loading of a viscoelastic adhesive contact, J.A. Greenwood and K.L. Johnson, Journal of Colloid and Interface Science, 296 (2006) 284-291 [44] High-speed force sensor for force microscopy and profilometry utilizing a quartz tuning fork (erratum vol 73, 3956, 1998), F.J. Giessibl, Applied Physics Letters, 74 (1999) 4070 [45] Probing of polymer surfaces in the viscoelastic regime, M. Chyasnavichyus, S.L. Young and V. Tsukruk, Langmuir, 30 (2014) 10566