Publisher’s version / Version de l'éditeur:
Soil Science, 87, 3, pp. 166-173, 1959-05-01
READ THESE TERMS AND CONDITIONS CAREFULLY BEFORE USING THIS WEBSITE. https://nrc-publications.canada.ca/eng/copyright
Vous avez des questions? Nous pouvons vous aider. Pour communiquer directement avec un auteur, consultez la
première page de la revue dans laquelle son article a été publié afin de trouver ses coordonnées. Si vous n’arrivez pas à les repérer, communiquez avec nous à [email protected].
Questions? Contact the NRC Publications Archive team at
[email protected]. If you wish to email the authors directly, please see the first page of the publication for their contact information.
NRC Publications Archive
Archives des publications du CNRC
This publication could be one of several versions: author’s original, accepted manuscript or the publisher’s version. / La version de cette publication peut être l’une des suivantes : la version prépublication de l’auteur, la version acceptée du manuscrit ou la version de l’éditeur.
Access and use of this website and the material on it are subject to the Terms and Conditions set forth at
Heat transfer in a moist clay
Woodside, W.; De Bruyn, C. M. A.
https://publications-cnrc.canada.ca/fra/droits
L’accès à ce site Web et l’utilisation de son contenu sont assujettis aux conditions présentées dans le site LISEZ CES CONDITIONS ATTENTIVEMENT AVANT D’UTILISER CE SITE WEB.
NRC Publications Record / Notice d'Archives des publications de CNRC:
https://nrc-publications.canada.ca/eng/view/object/?id=9e4f3edd-8402-4a92-8b2a-51c1113ccb18
https://publications-cnrc.canada.ca/fra/voir/objet/?id=9e4f3edd-8402-4a92-8b2a-51c1113ccb18
Ser
TH1
N21r2
no.
79
c.
2
BLDG
NATIONAL
RESEARCH
COUNCIL
YZED
C A N A D A
DIVISION
O F
BUILDING RESEARCHHEAT TRANSFER IN A MOIST CLAY
BY
W. W O O D S I D E A N D
C. M.
A. D EB R U Y N
R E P R I N T E D F R O M S O I L S C I E N C E
VOL. 87, NO. 3. M A R C H 1959
P. 166
-
173RESEARCH PAPER NO. 79
& % & ! -
R L % ~ * E H C O U - . ! ~'4
- --- ,--
O F THE
DIVISION
O F
BUILDING RESEARCHOTTAWA MAY 1959
Reprinted from SOIL SCIENCE Vol. 87, No. 3, Mnrch, 1950
Printed i n U . S . A .
HEAT TRANSFER I N
A
MOIST CLAY
W. WOODSIDE A N D C. M. A. DIG BRUYN National Research Council, Canada1
Received for publication April 28, 1058 The importance of a knowledge of the thermal
conductivity of moist soils was discussed in another paper (20) in which experimental data were presented for Ottawa sand and Potter's flint. Results of experiments on heat transfer in remolded clay samples a t various moisture contents are now reported.
Clays differ from sands in various ways. I n general, they have much more affinity for water, higher equilibrium moisture contents, and lower hydraulic permeability. Several investigators (5, 9, 13) reported considerable moisture migration when clay samples were subjected to a tempera- ture gradient.
TEST MATERIAL
A post-glacial marine clay, which occurs in the valleys of the St. Lawrence and Ottawa rivers and now commonly known in local engineering terminology (2) as Leda clay, was chosen as a test material. The Leda clay used was obtained from a depth of about 4 to 5 feet on the Montreal Road Laboratory site of the National Research Council in Ottawa.
The high clay content of the soil accounts for its "sensitivity" as an engineering material (2). Mineralogical analysis of a similar sample, taken a t a depth of 8 feet indicated t h a t the -2p fraction, which made up 76 per cent of the total dry weight, was composed of micas, illite, verinic- ulite, and illite-vermiculite mixed layer minerals (together equaling some 60 per cent), a small amount of kaolinite (5 per cent), and feldspars and quartz. The specific surface of the soil was found (from water vapor isotherms) to be 82.4 m.2/g.
PREPARATION O F SAMPLES
Remolded samples for the various tests were prepared from a substantial amount of air-dried and pulverized material. About 130 pounds of
Division of Building Research, Ottawa. T h e
junior author is at the National Building Research Institute, Pretoria, South Africa.
this powder, which easily passed through a U.S.A. No. 50 sieve with 0.3-mm. openings, was thor- oughly mixed in a concrete mixer.
RIoisture contents of about 0, 10, and 18 per cent were chosen.
The "dry" sample was obtained by heating the air-dry material which had a moisture content of 3.2 per cent in a n oven a t 140°F. for several days. Oven-drying of samples of this material a t 220"
F.
to constant weight indicated a residual moisture content of 1.6 per cent. The bulk of this sample was not subjected to temperatures over 140"F.
because its moisture affinity might be- come affected by such treatment.The samples a t about 10 and 18 per cent moisture content were prepared by mixing the air-dry material with appropriate amounts of t a p water in a small laboratory-type flour mixer. To improve homogeneity in moisture content the samples were stored in closed metal drums for a t least a week before starting the conductiv- ity tests.
DESCRIPTION O F APPARATUS
I n the present study use was made of: (a) the 12- by 12-inch guarded hot plate apparatus; (b) the 8- by 8-inch uniilow guarded hot plate apparatus, both of which are described by Wood- side and Cliffe (20) ; (c) a 12- by 12-inch test ccll; and (d) a commercially available thermal con- ductivity probe.
The l b i n c i ~ test cell
The 12-inch test cell (fig. 1) was similar in design to the 7-inch test cell employed by Hutcheon and Paxton (8) and Solvason (15). The sample container consisted of a lucite frame, with outside dimensions of 12 by 12 by 3 inches and a 0.125-inch wall thickness, mounted horizontally between a hot and a cold plate. During the test both plates were maintained a t constant tempera- ture by a water-glycol mixture circulating from controlled-temperature reservoirs. Instantaneous heat flow rates could be measured by means of 4.5- by 4.5-inch multiple-thermocouple heat
HEAT TRANSFER IN A MOIST CLAY
167
THERMOCOUPLE L E A D S
FIG. 1. The 12-inch test cell
meters fastened to each plate in contact with the sample.
For determining the temperature distribution through the sample, six 30-gauge copper/con- stantan thermocouples were installed a t equal spacings along the vertical center line of the cell by means of two lucite spacers. These spacers were located just outside the heat-metering area to reduce the error resulting from any possible distortion of the heat flow pattern. When filling the test cell with clay, some vertical displace- ment of the thermocouple junctions occurred. Their correct positions were measured after the test when the sample was being removed. Any loss or gain of moisture by the sample during the test was prevented by sealing the edges of the lucite frame with wax.
To find the final moisture distribution in the clay, six samples for moisture content determina- tions were taken a t equally spaced levels from the center of the heat-metering area, using a 9.i6-inch inside diameter core sampler which could be introduced through holes in one side of the lucite frame. During the test these holes remained sealed with a wax coating by means of threaded lucitc stoppers. Another two specimens for final moisture content determinations were collected from the regions adjacent to the hot and the cold plates
THE THERMAL CONDUCTIVITY PROBE
The probe method for measuring thermal con- ductivity of soils and other granular materials is a transient state method based on the theory of a line heat source ( I ) .
Various probe designs were described by
Hooper and Lepper (7), D'Eustachio and
Schreiner (3), De Vries (16), and Lachenbruch (1 1).
The main components of a thermal conductiv- ity probe are a thin electrical heating element and a thermocouple or thermistor enclosed in a thin protective metal sheath. After the probe is inserted in the test material a n appropriate cur- rent is fed into the heater from a source of con- stant e m f . and the temperature of the probe is recorded during a short-time interval.
The rate of rise of the probe temperature is
governed by the ability of the sample to conduct heat away from the probe, and its thermal con- ductivity may be calculated as follows:
Q
ln(t?/tl)k
= -47r (02 - 81)
where
Q
is the power input per unit length of theprobe, and B1 and O2 are the temperatures a t times
t, and tz, respectively, after starting the heating. The instrument used in the present study is described by Woodside (19). I t is similar in design
168
WOODSIDE AND D E BRUYNto the one described by D7Eustachio and Schreiner (3), but has a still larger 1ength:diam- eter ratio to rcduce errors due to the finite diameter of the probe (probe length, 8.5 inches; diameter, 0.020 inches; and length :diameter ratio, 425).
DRY LEDA CLAY
T e s t results
Thermal conductivity tests on dry Leda clay (1.6 per cent moisture content) were carried out with the closed 12-inch guarded hot plate ap- paratus and the probe.
Conditions during the hot plate test were similar to those described by Woodside and Cliffe (20), the hot plate being kept a t 90"
F.
and the cold plate a t 60" F.For a sample with a dry density of 66.4 lb./ft.3 the thermal conductivity was found to be 1.04 13.t.u. in./hr. ft.2 OF.
Probe tests on dry Leda clay Lyverc perfornled a t different densities. The sample container used was a vertical aluminium cylinder, with a height of 15 inches, an inside diameter of 6 inches, and a volume of 0.243 cubic feet. Various sample densities could be obtaincd by compaction on a small vibrating table. After a pre-calculated density had been reached the probe was installed vertically in the soil in thc center of the con- tainer.
Thermal concluctivity values for thrce dif- ferent densities a t a mean temperature of 85" F. arc shown in figure 2. The conductivity of the soil particles is higher than that of the air in the pores and thus the soil conductivity increases as the density increases.
12" GUARDED HOT P L A T E APPARATUS o PROBE e CALCULATED T H E R M A L CONDUCTIVITIES .o
-
0 1 1 1 I 5 0 6 0 7 0 DRY D E N S I T Y LB/FT'FIG. 2. Measured and calculated thermal con-
ductivity values for dry clay.
The value from the hot plate tcst is in fair agreement with the probe results. The small difference may be explained by thc difference in the mean temperatures of the two test methods.
Calculated condzlctivity val,ibes
The thermal conductivity of dry Leda clay a t several densitics was calculated, using the equation developed by De Vries (17) with the 1.25 correction factor, thc spccific gravity of the solid clay particles being taken as 2.79. The value of k , was taken as 0.18 13.t.u. in./hr. ft.2 OF. and
k , as 20.3 B.t.u. in./hr. fL2 O F . after De Vrics
(17). The calculated values of conductivity versus dry density are plottccl in figure 2. Even with the 1.25 correction factor, the calculated values are somewhat loner than the measured values. This is in contrast with Ottawa sand and Potter's flint (20), for ~vllich the D e Vries formula with no correction factor gavc calculated con- ductivity values in good agreemcilt with measured values for both dry and saturated conditions.
hIOIST L E D h CLAY
Twelve-inch cell tests
Cell tests were performed on the clay a t moisture coiltents of 10.1 and 18.1 pcr cent (dry densities 61.4 and 66.1 lb./ft.", respectively). I n both tests, 60" F. liquid was circulated through both plates of the cell until the assenlbly was a t a uniform temperature. At time t = 0, the tempera- ture of the top plate was raised to 90" F. and maintained for the remainder of the test.
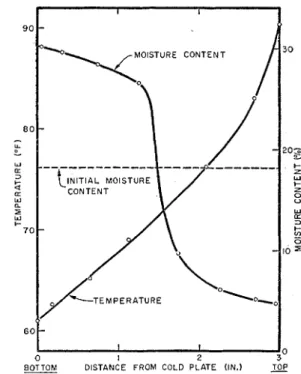
Pigurc 3 shows the temperature distribution in the sample with 18.1 per cent moisture content a t various times t after the cstablishrnent of the temperature difference. At t = 3 hours the tem- perature distribution changcd only very slowly, indicating a thermal quasi-steady state. Such a state has been called a stationary statc of the first ordcr in the thcrrnodynamics theory of irreversible processes (4).
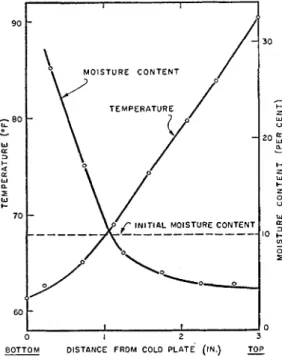
A stcacly state in the classic sense, however, had not been reached. Together with t h e flow of heat thcrc was a conti~iuous movcment of moisture (thermo-osmosis) and becausc the boundaries werc closed, the sample became wetter a t the cold side and clricr at the hot side, as is cviclent from the final moisture distribution presented in figure 4.
As a result of moisture rcdistribution, the thermal conductivity increased a t t h e bottom
H E A T T R A N S F E R I N A MOIST CLAY
169
-
IL P- W cc 3 t- 4 LT W a5
0 I 2 3BOTTOM D I S T A N C E FROM, C O L D PLATE ( I N . ) TOP
FIG. 3. Temperature distribution during test on
18 per cent moisture content clay in test cell. and decreased a t the top; the temperature clistri-
bution therefore changed slowly. A final steady
state was reached after t = 168 hours, when the
moisture distribution had also become stationary. This state may be called a stationary state of the second order. I n addition t o a constant tempera- ture gradient there was a constant moisture content gradient a t each level. Conditioils mere, however, far from uniform throughout the Sam-
ple, the moisture content varying between
5
and33 per cent.
Measurements of the heat flows a t different times during the test on the sample with 18.1 per cent moisture content are presented in figure 5. T h e heat flows in and out of the sample becanlc
approximately equal after t = 3 hours, indicating
the first-order stationary state. After this stage both flows decreased asymptotically toward a minimum value, which was attained after ap- proximately 168 hours.
Calculation of the thermal coilductivity k a t
the final steady state gives a value of k = 1.81.
This result, however, is far from representative of the uniform moisture distribution a t the begin-
ning of the test. A better value may be obtained
from the heat flows a t the first-order stationary
MOISTURE C O N T E N T
s
3 ODISTANCE FROM COLD PLATE (IN.) TOP
FIG. 4. Steady-state temperature and moisture
content distributions in clay sample with an initial uniform moisture content of IS per cent.
I 1 I I H E A T F L O W I N 1 0
OF
2:
,I0 :o :o :o I i Olo
1 TIME l H R 1FIG. 5. Time variation of heat inflow and out-
flow for cell test on 18 per cent moisture content clay.
state, when the moisture redistribution was still
very small. This leads to a value of k = 2.35. T h e
measured thermal conductivities include a
contribution due t o transfer of latent heat b y distillation of water vapor from warm t o cool regions of the specimen. The vapor permeability of the clay was measured a n d found to be 33.9 perm. inches (grains in./hr. f t . V n Hg). This leads to a calculated value of 0.15 B.t.u. in./hr
f t . 2 O F for t h e component of thermal conductiv-
ity due t o vapor flow (20) a t a m e a n tempera-
ture of 75"
F.
170
W O O D S I D E A N D Dl3 BRUYNdistributions obtained from the cell test on 10.1 per cent moisture content clay are shown in figure 6. Again the large redistribution of moisture is evident. Calculation of the thermal conductiv- ity a t the final steady state for this test gives k = 1.18, and for the first-order stationary state k = 1.55.
The magnitude of the moisture redistribution in a porous material resulting from an applied temperature gradient may be presented as the thermo-osmosis coefficient /3 = -(gradient m ) /
(gradient T) where m is the moisture content expressed as a fraction of the dry weight, and T is the temperature.
I n general this coefficient will be a function of the state variables of the material (m and T).
Similar coefficients have been used in investiga- tions on thermal diffusion in liquids and gases. Their relation to the ordinary and the thermal diffusion coefficients which play an important part in the thermodynamics theory of these ir- reversible processes has been described by De Groot (4).
Approximate values of
/3
for the final steady state in the cell tests on 10.1 and 18.1 per cent moisture content clay are presented in figure 7.FIG.
6. Steady-state temperature and moisturecontent distributions in cell test on 10 per cent moisture content clay.
it
0 OAT4 FROM TES: ON !O.l% M.C. CLAY'
e OAT4 FROM TEST ON 18.1% M.C. CL4V
-I
FIG.
7. Variation of the thermal osmosis coeffi-cient P for Leda clay with the moisture content expressed ns a fraction of the dry weight.
6 - 5 2 4 P 3 2
The maxiillurn moisture redistribution due to a temperature gradient occurs a t a moisture con- tent of approximately 19 per cent. Other in- vestigators (for example, Jones and Kohnke (lo), Gurr
et
al. (5), and Hadley and Eisenstadt (6)) have reported maximum moisture transfer at an intermediate moisture content. An explanation for this behavior has recently been advanced by Philip and De Vries (12).( 3 . - G R d O M = - b H ( . F ) . I
-
GRAD T 11 1-
-
--
-
-
P Probe testsO6-
L/
'10 MOISTUREoi
CONTENT .20 U ' 3 0Two probe tests on Leda clay a t 10.2 per cent moisture content and 61.4 lb./ft.Vdry density, as in the cell test, gave conductivities of
k
= 1.46 and 1.47 B.t.u. in./l:r. fL2 O F . Both values repre-sent averages for the 2- to 10-minute time inter- val after the probe heater had been switched on. They are higher than the result for the final steady state in the cell test (k = 1.18) b u t lower than that for the stationary state of the first order (k = 1.55).
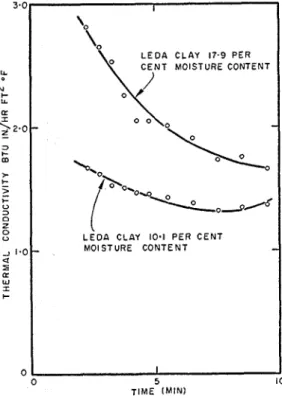
I n an examination of the probe temperature during one test it was found that the thermal conductivity varied continuously. Values were calculated for successive 1-minute intervals and plotted against time in figure 8. The thermal conductivity decreased during the probe test as in the cell test. The highest value found was k = 1.67.
Five probe tests were performed on the same sample of Leda clay a t 18.1 per cent moisture content and a dry density of 65.4 1b./fk3 (The probe was not removed from the sample during this period. The probe-sample assembly was allowed to stand approximately 24 hours between successive tests.) The results showed an apparent increase of the thermal conductivity from k =
HEAT TRANSFER IN 11 TVXOIST CLAY
171
FIG. 8. Variation of measured thermal conduc- tivity with time during probe tests on clay. 1.52 to 2.13. An explanation for this behavior has not been found.
The variation of conductivity for the fifth test is also shown in figure 8. The highest value ob-
tained for the first 1-minute interval was k =
2.81, which was even higher than the conductiv- ity calculated for therinal equilibrium in the cell test a t the same moisture content.
The decrease of thermal conductivity during each measurement probably has to be attributed to thermal migration of moisture away from the
probe (19).
Unijlow tests
I n the uniflow apparatus a sandwich, formed by two 8- x 8-inch guarded hot plates separated by a slab of thermal insulation, replaces the single heater plate of the conventional guarded hot plate apparatus. The two heater plates and their guard rings are all held a t the same tempera- ture automatically by varying the electrical power input to their respective heater elements. Two identical samples of clay were prepared in 8- by 8- by 1-inch lucite frames sinlilar to t h a t shown in figure 1. The clay samples had a
moisture content of 19.6 per cent and a dry density of '72.3 lb./ft.? The samples were placed one on each side of the double hot plate sand- wich, with 8- by 8-inch liquid-cooled nletal plates clampecl against the other faces of t h e samples. The plates and specimens mere stacked one above the other so that heat flow was in the vertical direction.
At steady-state the bottom hot plate produced a heat flow down\vards through the bottom sam- ple; the conductivity of the bottom sample could, therefore, be determined from the power input t o the test area of the bottom plate and the tempera- ture gradient applied to the samples. The top hot plate produced a heat flow upwards through the top sample, and its conductivity could be deter- mined in a sinlilar fashion. This is in contrast t o the conventional gualsded hot plate apparatus in which only the average of the concluctivities of the two samples can be measured.
Three experiments were performed on the same pair of clay samples using, in succession, tempera-
ture gradients of 5, 10, and 20" F./in., and a
constant mean temperature of '75"
F.
Con-ductivity values were calculated for the final steady-state reached after about 2 days. Moisture content profile measurements could not be taken, due to the small thickness of tlle samples. Thicker samples were not used because of the possibility of errors due to edge effects (18) in hot plates having the dilllensions of those used in the
u n i f l o ~ ~ ~ apparatus. The thermal conductivity
results are shown in table 1 and figure 9.
Thtrnlal conductivity values were far in cxccss of those fouild with the test cell and the probe.
Part of this discrepancy is due t o the slightly higher values for both the nloisture content and the dry density of the samples in the uniflow apparatus compared with the previous samples.
It
has already been established that the con-ductivity values determined with both the probe m d the test cell are too low, due to moistu~e redistribution during the measurements. Assum- ing this phenomenon to be less pronounced in the samples with higher inoisture saturation in the uniflow apparatus it would then be reasonable t o regard the uniflow values of the thernlal con- ductivity as more representative for the initial homogeneous moisture distribution. This view is supported by the fact that the uniflow values for the conductivity appeared to vary
HEAT TRANSFER IN A MOIST CLAY
173
of the initial uniform nloisture content appearedt o be impossible. Better results might be ob- tained by using a probe with a somewhat larger diameter in order t o decrease t h e disturbing effect of thermal nloisture redistribution in the soil by reducing the temperature gradient a t the surface of the probe.
Thermal conductivity values for Leda clay a t a moisture content of about 20 per cent and a dry density of about 72 lb./ft.3 obtained by means of a n 8-inch uniilow guarded h o t plate
apparatus a t temperature gradients of 5 , 10, and
20" F./in. successively showed a slight variation
from k = 3.7 t o 3.6 B.t.u. in./hr. f t . 2 O F . for the
top samples with heat flow up, a n d from k = 4.0
t o 3.8 B.t.u. in./hr. f t . 2 O F . for the bottom sam-
ples with heat flow down. Apparently little thermal redistribution of moisture took place during these tests because of the higher moisture saturation of this sample. This would also ex- plain the high value of the conductivity com-
pared with the values previously found a t 18 per
cent moisture content.
REFERENCES
(I) CARSLAW, H. S., AND JAEGER, J. C. 1948
Conduction of Heat in Solids. Oxford
Clarendon Press.
(2) EDEN, W. J., AND CRAWFORD, C. B. 1957
Geotechnical properties of Leda clay in the Ottawa area. Proc. 4th I n t e r n . Conf.
Soil Mech. Foundation E n g . 1, pp. 22-27.
(3) D'EUSTACHIO, D., A N D SCHREINER, R. E.
1952 A study of a transient method for measuring thermal conductivity. ASHVE Transactions 58, pp. 331-342.
(4) DE GROOT, S. R. 1951 Thermodynamics of
Irreversible Processes, chap. X . Interscience
Publishers Inc., New York.
(5) GURR, C. G., MARSHALL, T . J., A N D HUTTON,
J. T . 1952 Movement of water in soil due t o a temperature gradient. S o i l S c i . 74: 335345.
(6) HADLEY, W. A,, A N D EISENSTADT, R . 1955
Thermally actuated moisture migration in granular media. T r a n s . A m . Geophus.
U n i o n 36: 61S623.
(7) HOOPER, F. C., A N D LEPPER, F . R . 1950
Transient heat flow apparatus for the determination of thermal conductivities. ASHVE Transactions 56, pp. 309-324.
(8) HUTCHEON, N. B., A N D PAXTON, J. A. 1952
Moisture migration in a closed guarded hot plate. A S H V E Journal Section. Heatino
piping and A i r Conditioning ( ~ p r i l ) , pp".
113-122.
(9) HUTCHEON, W. L. 1955 Characteristics of
moisture movement in unsaturated soils.
National Research Council, C a n a d a , Divi- sion of B u i l d i n g Research, B u l l . 1 , pp. 74-85.
(10) JONES, H. E . , A N D KOHNKE, H . 1952 The
influence of soil moisture tension on vapor movement of soil water. Soil S c i . Soc.
A m e r . Proc. 16: 245248.
(11) IJACIIENBRUCH, A. H . 1957 A probe for
measurement of thermal conductivity of frozen soils in place. T r a n s . A m . Geophys.
U n i o n 38: 691-697.
(12) PHILIP, J . R., A N D DEVRIES, D. A. 1957
Moisture movement in porous materials under temperature gradients. T r a n s . A m .
Geophys. U n i o n 38: 222-232.
(13) ROLLINS, R . L., SPANGLER, M. G. A N D KIRK-
HAM, D. 1954 Movement of soil moisture
under a thermal gradient. H i g h w a y Re-
search Board Proc. 33: 49S508.
(14) SMITH, W. O., A N D BYERS, H. G. 1938 The
thermal conductivity of dry soils of certain of the great soil groups. Soil S c i . Soc.
A m e r . Proc. 3: 13-19.
(15) SOLVASON, I<. R . 1956 Moisture i n transi-
ent heat flow. T r a n s . A S H V E 62: 111-122. (16) DE VRIES, D. A. 1952 A non-stationary
method for determining thermal conduc- tivity of soil in situ. Soil S c i . 73: 83-89. (17) DE VRIES, D . A. 1952 Het warmtegeleid-
ingsvermogen van grond. Mededelingen van
de Landbouwhogeschool te Wageningen 52:
1-73.
(18) WOODSIDE, W. 1957 Analysis of errors due
due to edge heat loss in guarded h o t plates.
American Society for Testing Materials,
Symposium on Thermal Conductivity Measurements a n d Applications of Ther- mal Insulations, Special Technical Publica-
tion 21 7, pp .49-62.
(19) WOODSIDE, W. 1958 Study of a probe for
thermal conductivity measurement of dry and moist materials. A S H V E Journal
Section, H e a t i n g , P i p i n g , and Air-Condi- tioning, pp. 163-170, September, 1958.
(20) WOODSIDE, W., A N D CLIFFE, J. B . 1959
Heat and moisture transfer i n closed sys- tems of two granular materials. S o i l Sci. 87 : 75-82.