Publisher’s version / Version de l'éditeur:
The journal of physical chemistry. C, Nanomaterials and interfaces, 114, 31, pp.
13162-13167, 2010-08-12
READ THESE TERMS AND CONDITIONS CAREFULLY BEFORE USING THIS WEBSITE.
https://nrc-publications.canada.ca/eng/copyright
Vous avez des questions? Nous pouvons vous aider. Pour communiquer directement avec un auteur, consultez la
première page de la revue dans laquelle son article a été publié afin de trouver ses coordonnées. Si vous n’arrivez pas à les repérer, communiquez avec nous à PublicationsArchive-ArchivesPublications@nrc-cnrc.gc.ca.
Questions? Contact the NRC Publications Archive team at
PublicationsArchive-ArchivesPublications@nrc-cnrc.gc.ca. If you wish to email the authors directly, please see the first page of the publication for their contact information.
NRC Publications Archive
Archives des publications du CNRC
This publication could be one of several versions: author’s original, accepted manuscript or the publisher’s version. / La version de cette publication peut être l’une des suivantes : la version prépublication de l’auteur, la version acceptée du manuscrit ou la version de l’éditeur.
For the publisher’s version, please access the DOI link below./ Pour consulter la version de l’éditeur, utilisez le lien DOI ci-dessous.
https://doi.org/10.1021/jp100826g
Access and use of this website and the material on it are subject to the Terms and Conditions set forth at
Electronic conductivity and stability of doped Titania (Ti1-xMxO2, M =
Nb, Ru, and Ta)-A density functional theory-based comparison
Dy, Eben; Hui, Rob; Zhang, Jiujun; Liu, Zhong-Sheng; Shi, Zheng
https://publications-cnrc.canada.ca/fra/droits
L’accès à ce site Web et l’utilisation de son contenu sont assujettis aux conditions présentées dans le site LISEZ CES CONDITIONS ATTENTIVEMENT AVANT D’UTILISER CE SITE WEB.
NRC Publications Record / Notice d'Archives des publications de CNRC:
https://nrc-publications.canada.ca/eng/view/object/?id=97c4be9d-417a-4457-bbd9-83cfa5550b8d https://publications-cnrc.canada.ca/fra/voir/objet/?id=97c4be9d-417a-4457-bbd9-83cfa5550b8dElectronic Conductivity and Stability of Doped Titania (Ti
1-XM
XO
2, M ) Nb, Ru, and
Ta)
sA Density Functional Theory-Based Comparison
Eben Dy, Rob Hui, Jiujun Zhang, Zhong-Sheng Liu, and Zheng Shi*
Institute for Fuel Cell InnoVation, National Research Council of Canada, 4250 Wesbrook Mall, VancouVer, BC, V6T 1W5, Canada
ReceiVed: January 27, 2010; ReVised Manuscript ReceiVed: July 5, 2010
The structure, electrical conductivity, and stability of Nb-, Ru-, and Ta-doped titania were compared by density functional theory. Both anatase and rutile structures were investigated. Doping causes lattice expansion in all cases. The mechanism by which Ru-doping induces electrical conductivity in titania differs from those by Ta- and Nb-doping. Ru-doping fills the titania band gap primarily with its own d-electrons. On the other hand, Ta- and Nb-doping shift the Fermi level to the originally unfilled conduction states. Substitution free energy calculations indicate that a uniform Ti0.75M0.25O2 solution is favorable for Nb- and Ta-doping but
unfavorable for Ru-doping. In addition, we also considered the effect of dopant concentration on the electrical conductivity of doped titania in the rutile phase. For Nb- and Ta-doping, increasing dopant concentration above mole fractions of 0.0625 and 0.125, respectively, gives diminished increment in Fermi level electron density. On the other hand, electron density at the Fermi level of Ru-doped rutile is more linearly dependent on Ru mole fraction.
Introduction
Polymer electrolyte membrane fuel cells (PEMFCs) are promising power sources for the future because they do not emit greenhouse gases and are more efficient than internal combustion engines. At present, PEMFCs are approaching energy density levels sufficient for commercial viability. With that accomplish-ment, the focus of PEMFC research is moving toward long-term durability and development of key components to cope with the high-performance environment. For example, when modern fuel cells operate at higher current densities, they produce water at a faster rate and, consequently, require better water management to prevent flooding. A promising approach is to operate PEMFCs at a higher temperature (g120 °C). In addition, higher-temperature operation has advantages that include less vulnerability to CO poisoning, faster reaction kinetics, and recoverable heat.1Unfortunately, carbon materials
that support Pt catalysts in PEMFCs today (operating at around 80 °C) corrode easily under elevated-temperature and high-potential conditions. Ceramics provide an alternative to carbon-based catalyst support material for PEMFCs operating at 120-200 °C. Antolini and Gonzalez2have recently reviewed
studies in this area.
Doped titania (Ti1-XMXO2, where M is dopant metal and X
is dopant mole fraction) is the most viable candidate for ceramic catalyst support materials. Ti1-XMXO2 can have reasonable
specific surface area and acceptable electrical conductivity. Furthermore, it can hold catalyst particles dispersed in good sizes. Studies so far have shown that doped titania is stable in fuel cell conditions. Park and Seol3 demonstrated that Pt
supported on Nb-doped TiO2 has higher oxygen reduction
activity than those supported on Vulcan XC carbon. The conductivity of the prepared Nb-doped TiO2was reported to
be ∼0.1 Ω-1 cm-1. Garcia et al.4 prepared a PtRu catalyst
supported on Ti0.9Nb0.1O2. Tests in a direct methanol fuel cell
showed higher current (A/mgPt) for PtRu supported on Ti0.9Nb0.1O2than one supported on E-TEK carbon. Haas et al.5
prepared Ti1-XRuXO2 support for Pt electrode and showed
significant increase in electric conductivity for X g 0.27; however, they were unable to get a uniform solution at X < 0.5. Wang et al.6synthesized a Pt/Ti
0.9Ru0.1O2 electrode that
showed high electrocatalytic activity for oxygen reduction with much better stability than that of Pt/C in an antipolarization experiment. This result is quite different from that of Haas et al. who could not obtain a uniform solution at such a low dopant (X ) 0.1) mole fraction.
Aside from high-temperature PEMFC applications, titania (TiO2) has been the subject of many studies in both doped and
undoped forms. The rutile and anatase polymorphic phases of TiO2have particularly received much attention in recent years
due to their stability and high surface area. Their applications include photocatalyts,13-16heterogeneous catalyst support,17and
gas sensors.18,19 Transition electron microscopy, scanning
electron microscopy, atomic force microscopy, and X-ray diffraction studies have shown that transition metal-doped TiO2
can form uniform solution with no sign of phase separation.7-12
Crystal structures of the polymorphic rutile20 and anatase21
phases have been determined by X-ray diffraction and are illustrated in Figure 1. Doping TiO2with transition metals has
been shown to induce lattice expansion15,16,22-24and electrical
conductivity. Electrical conductivity has been reported to be in the range of ∼103Ω-1 cm-1 for Ti0.9Nb0.1O2,25∼103Ω-1cm-1 for Ti0.85Ta0.15O2,26and 0.78 Ω -1cm-1for Ti 0.7Ru0.3O2.27(Note
that these values are rough guides since sample preparation and morphology were quite different among authors.) In comparison, pure TiO2is a semiconductor with a conductivity of ∼10
-6
Ω-1
cm-1.28,29
Recently, our group compared the stability and oxygen reduction reactivity of Pt on several support materials: undoped TiO2, Nb-doped TiO2, H2-reduced TiO2, and a commercial
carbon.30 Our experiments showed that Pt on Nb-doped TiO 2
retained 60% of the electrochemically active surface area after
* Author to whom correspondence should be addressed. E-mail: zheng.shi@nrc.gc.ca.
J. Phys. Chem. C 2010, 114,
13162
10.1021/jp100826g 2010 American Chemical Society Published on Web 07/21/2010
1000 cycles. In comparison, Pt on H2-reduced TiO2retained
42% surface area, while Pt on undoped TiO2retained only 32%.
The Pt/C catalyst was the least stable and retained only 20% active surface area. On the other hand, the Pt/C had the highest initial oxygen reduction activity due to its larger specific area (17.1 m2g-1vs 5.0 m2g-1for Pt/Nb-doped TiO
2) and higher
conductivity. The Pt supported on both Nb-doped and reduced TiO2was more active than the one supported on undoped TiO2.
Clearly, Ti1-XMXO2is a promising catalyst support for
high-temperature PEMFCs; however, more research is required to understand and improve their electrical conductivity and stability.
With our promising experimental results, we now turn to density functional theory (DFT) computations on Ti1-XMXO2
to gain atomic-level understanding essential for the design of more stable and electrically conductive catalyst supports. Specifically, the objective of this paper is to compare undoped (TiO2) and doped titania from the theoretical perspectives of
conducting electron density and substitution reaction energy to gain insight into their electrical conductivity and stability with doping. Niobium (Nb)3,4and ruthenium (Ru)5,6were chosen as
dopants (M) because experimental studies have shown that titania doped with these metals can be deposited with Pt nanoparticles to produce a usable electrode. Tantalum (Ta) was also considered because this metal is stable in harsh electro-chemical environments and doping with this metal also improves titania’s conductivity.26,31 Both anatase and rutile phases of
titania were studied. Nb-, Ru-, and Ta-doped titania were compared to undoped titania and to each other in the aspects of structure, partial and total density of states (DOS), and free energy of substitution. In addition, Ru-, Nb-, and Ta-doped rutile at mole fractions of 0.0625 and 0.125 were also studied in order to know the optimal mole fraction with respect to electric conductivity. To our best knowledge, although there are several DFT studies on TiO2,32-36the study and discussions presented
in this paper are not available in literature.
Computational Models and Methods
Spin-polarized ab initio calculations based on DFT37,38were
performed using projector-augmented waves39,40as implemented
in the Vienna Ab-initio Simulation Package version 4.6.41-43
Generalized gradient approximation PW9144,45was used for the
exchange-correlation functionals. The cutoff energy was set at 520 eV. The three-dimensional Brillouin zone was automatically sampled with the Monkhorst-Pack method using 7 × 7 × 7
k-points; at that point, energy converged to less than 0.01 eV. Geometry optimizations were accomplished with the conjugate-gradient algorithm. The cell structures presented in this paper were plotted with VESTA.46 Densities of states were plotted
with Xmgrace47and P4VASP.48
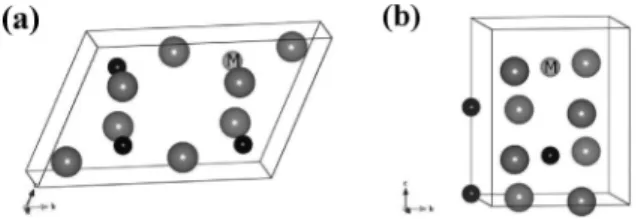
Structure, Electronic Density of States, and Free Energy of Substitution.TiO2was modeled by supercells that contain
1 × 2 × 1 unit cells of anatase (Figure 1a) and 1 × 1 × 2 unit cells of rutile (Figure 1b). Both rutile and anatase supercells have four titanium ions and eight oxygen ions. All structures were optimized and compared to previous studies20,21,34,35where
available as shown in Table 1. Ti1-XMXO2were modeled by
replacing one out of four Ti ions with Nb, Ta, and Ru as described in Figures 1a and 1b. This corresponds to a 0.25 mol fraction (X) doping, i.e., Ti0.75M0.25O2, where M ) Nb, Ta, and
Ru. Note that in Figure 1 the larger spheres represent oxygen ions while the smaller spheres represent titanium or dopant ions. In the cases of undoped titania (TiO2), all small spheres (dark
and lighter ones marked M) represent Ti ions. In the cases of Ti0.75M0.25O2, locations where dopants (Nb, Ta, and Ru) replace
titanium are represented by lighter spheres marked M. Effect of Dopant Concentration.The supercell was subse-quently expanded to contain 2 × 2 × 2 unit cells of rutile in order to study the effects of lowering dopant concentration. One (Figure 2a), two (Figure 2b), and four (Figure 2c) Ti ions were replaced with M to correspond to Ti1-XMXO2, where X ) 0.0625,
0.125, and 0.25, respectively. In Figure 2, metal ions (M ) Nb, Ru, and Ta) are represented by light-colored spheres marked M. Unmarked small spheres represent Ti ions while large spheres represent O.
Calculations for M ) Nb, Ru, and Ta were performed and compared. Only the rutile phase was chosen for this part because results obtained from the first set of calculations (using 1 × 2 × 1 for rutile and 1 × 1 × 2 anatase as described in the previous paragraph and Figure 1) show that metal doping yields similar electronic effects on the anatase and rutile phases. Furthermore, anatase supercells have higher volumes and are computationally too expensive.
Results and Discussion
Structure.We explored the structures of TiO2systems. This
also serves as a validation tool for our computational methodol-ogy. Table 1 shows experimental X-ray diffraction data and our calculation results for rutile and anatase structures. Results are reported as crystallographic data for direct comparison. Our calculations fall well within the expected range of accuracy for DFT-type calculations.
Experiments have shown that Nb-doping causes the titania lattice expansion.22,23From X-ray diffraction data, Ghicov et
al.22calculated that lattice constants a and c increased by 0.038
and 0.04 Å, respectively, for a Nb-doped anatase annealed from amorphous Ti0.26Nb0.13O0.61. Table 2 shows the optimized lattice
parameters of TiO2 versus Ti1-XMXO2, which demonstrates
lattice expansion with doping. Our results indicate that the lattice expansion can partly be attributed to the increase in ionic radii (r) of Ti ions as electrons move toward vacant Ti d-orbitals in the presence of dopantsssee detailed discussion in the following section. Lattice expansion can also be caused by a longer M-O
Figure 1. Supercell models for anatase and rutile phases: (a) 1 × 2 × 1 anatase model; (b) 1 × 1 × 2 rutile model. The larger spheres represent oxygen ions, while the smaller spheres represent titanium or dopant ions. In the cases of undoped titania (TiO2), all small spheres
(dark and lighter ones marked M) represent Ti ions. In the cases of Ti0.75M0.25O2, M is the location of the dopant (Nb or Ta or Ru).
TABLE 1: Experimental and Theoretical Structural Data for TiO2
our work exptl other calcd Rutile a(Å) 4.641 4.593620 4.54534 4.65335 c(Å) 2.971 2.958720 2.91934 2.96535 Anatase a(Å) 3.810 3.784221 c(Å) 9.671 9.514621
bond length compared to the Ti-O bond in pure titania; this is the case for Ru-doped titania where changes in Ti-O bond length and Ti d-orbital occupancy were not significant, and the lattice expanded due to a longer M-O distance.
Electronic Density of States.Semiconductivity, as that found in undoped titania, lies in the inability of valence electrons to cross the Fermi level due to the presence of a band gap. Doping can modify the electronic band structure and improve electrical conductivity by either narrowing or bridging the band gap at the Fermi level, or by shifting the Fermi level.
Figures 3a and b show the total DOS (density of states, up-spin plus down-up-spin electrons) of undoped and doped rutile and anatase. On the top of each figure is the total density of states of undoped rutile and anatase, respectively. As can be seen, the electron density (y-axis) at the Fermi level (E - Ef)0) is
practically zero for undoped rutile and anatase, which is expected as titania is a semiconductor.
The total density of states of Ru-, Nb-, and Ta-doped rutile and anatase are displayed below undoped titania in Figures 3a
and b, respectively. The theoretical DOS of rutile Ti0.75Ru0.25O2
has been previously reported by Glassford and Chelikowsky,36
which yields essentially similar results and agrees reasonably with experiment. However, we did not find any comparison of DOS for Ru- versus Ta- or Nb-doped titania in literature.
Doping perturbs the electronic structure, yielding good amounts of electrons at the Fermi level. Compared with the total DOS of titania, Ta- and Nb-doping shifted bands signifi-cantly to the left side. The DOSs of Ta- and Nb-doped titania are hardly distinguishable near the Fermi level, but there is an interesting difference between the DOS profile of Ru-doped versus Ta- and Nb-doped titania. The difference in the DOS profile implies a difference in the origin of electrical conductiv-ity. Our investigations into the local density of states reveal that Ru fills electrons into the band gap with its own d-electrons and perturbs some Ti d-electrons into the same region as shown in Figures 4a and b. On the other hand, Ta and Nb induce electronic conductivity by shifting the Fermi level to the originally unfilled bands of TiO2as shown in Figure 4c-f. In
contrast to Ti1-XRuXO2, the electrons at the Fermi level in Figure 2. Rutile phase supercell models with different dopant mole
fractions: (a) Ti0.9375M0.0625O2, (b) Ti0.875M0.125O2, (c) and Ti0.75M0.25O2.
Metal ions (M ) Nb, Ru, and Ta) are represented by light-colored spheres marked M. Unmarked small spheres represent Ti ions, while large spheres represent O ions.
TABLE 2: Optimized Structure of TiO2and Ti0.75M0.25O2
TiO2 Ti0.75Nb0.25O2 Ti0.75Ru0.25O2 Ti0.75Ta0.25O2 Rutile a(Å) 4.641 4.703 4.702 4.661 c(Å) 2.971 2.996 3.005 2.981 volume (Å3) 64.00 66.26 66.43 64.76 Anatase a(Å) 3.810 3.874 3.879 3.828 c(Å) 9.671 9.832 9.698 9.847 volume (Å3) 140.4 147.6 145.9 144.3
Figure 3. Computed total density of states of pure and doped titania (TiO2, Ti0.75Ru0.25O2,Ti0.75Nb0.25O2, and Ti0.75Ta0.25O2): (a) anatase phase,
(b) rutile phase. As can be seen in the top portion of (a) and (b), the electron density (y-axis) at the Fermi level (E - Ef)0) is practically
zero for pure rutile and anatase, which is expected as titania is a semiconductor. The total densities of states of Ru-, Nb-, and Ta-doped titania (second-from-top to bottom, respectively) are displayed below pure TiO2. For doped TiO2, the electron densities (y-axis) at the Fermi
level (E - Ef)0) are significant, confirming the fact that doping
induces electrical conductivity in TiO2.
Ti1-XNbXO2 and Ti1-XTaXO2 correspond primarily to Ti
d-orbitals (with Nb/Ta d-d-orbitals and O p-d-orbitals as minor contributors) as shown in Figures 4c-f. Note that Ru-doping also shifts the Fermi level of Ti1-XRuXO2versus undoped TiO2
but not enough to fill the conduction bands of titania. Both mechanisms are known to induce electrical conductivity in semiconductors. This is in agreement with the fact that Ta-, Nb-, and Ru-doped TiO2are electrically conductive. Electrical
conductivity has been reported to be in the range of ∼103Ω-1
cm-1
for Ti0.9Nb0.1O2,25∼103Ω-1cm-1for Ti0.85Ta0.15O2,26and
0.78 Ω-1
cm-1
for Ti0.7Ru0.3O2.27 (Note that these values are
rough guides since sample preparation and morphology were quite different among authors.)
Free Energy of Substitution.To investigate the stability of doped titania, we calculated the energies of substituting a Ti ion by a dopant metal ion in the TiO2lattice. The free energy
for the substitution reaction is defined as
i.e., energy of products minus reactants. Negative substitution energy would mean that the dopant stabilizes the TiO2lattice;
on the other hand, positive substitution energy would mean that the dopant destabilizes the TiO2lattice. The results are
sum-marized in Table 3. The positive energy value for Ru doping is
Figure 4. Computed partial density of states of doped anatase and rutile phases: (a) anatase Ti0.75Ru0.25O2, (b) rutile Ti0.75Ru0.25O2, (c) anatase
Ti0.75Nb0.25O2, (d) rutile Ti0.75Nb0.25O2, (e) anatase Ti0.75Ta0.25O2, and (f) rutile Ti0.75Ta0.25O2. Lines with triangles represent partial Ti d-electron
contribution, lines with squares represent partial dopant (Ru, Nb or Ta) d-electron contribution, and lines with diamonds represent partial oxygen p-electron contribution to the total density of states (simple lines).
ES)E
Ti3M1O8+ETi -ETi4O8- EM
consistent with the observations of Haas et al.,5Kameyama et
al.,49and Colomer and Jurado27who did not see the formation
of a uniform Ti1-XRuXO2solution at X ∼0.25 and below. This
is contrary to the study of Wang6et al. who claimed that they
synthesized Ti0.9Ru0.1O2catalyst support. There are two possible
explanations for this: first, the product obtained by Wang could be metastable, or second, doping at X ) 0.1 is favorable but not at X ) 0.25. The second case is unlikely because lowering the Ru concentration does not change the fact that Ru will still have to fit into the TiO2rutile lattice. Note that increasing X to
0.5, i.e., Ru0.5Ti0.5O2, would yield the RuO2 rutile lattice. Ta
and Nb, on the other hand, gave favorable (negative) substitution energies at X ) 0.25 mol fraction. The group of Chambers50
reported that Nb can occupy rutile (110) surface and form a uniform solution with molar fraction up to X ) 0.3 as a thin film. The lower substitution energy of Ta-doped titania is consistent with the work of Traversa et al.51who showed that,
when prepared by the same method, Ta is more soluble than Nb in the titania lattice.
The stability of doped titania can be rationalized by the perturbation of dopants on the electronic states of TiO2, as
clearly demonstrated in the DOS plots (Figures 3 and 4). Nb-and Ta-doping shift the DOS profile to the left side Nb-and lower the energy of the filled TiO2electronic states. Ru-doping, on
the other hand, does not lower the eigenstates’ energy as much while forming more high-energy states.
Effect of Dopant Concentration.We expected the conduc-tivity of Ru-doping to be more linearly dependent on Ru mole fraction (X) due to its prevailing contribution of electrons at the Fermi level. To study the effects of lowering dopant concentration on electric conductivity, our supercell was expanded to contain 2 × 2 × 2 unit cells of rutile. One, two, and four Ti ions in rutile were replaced with M (M ) Ru, Nb, or Ta) to model TiXM1-XO2with X ) 0.0625, 0.125, and 0.25,
respectively. The models for Ti0.9375M0.0625O2, Ti0.875M0.125O2,
and Ti0.75M0.25O2are shown in Figures 2a,b, and c, respectively.
The rutile phase was chosen for this section because anatase supercells have higher volumes and are computationally too expensive. Moreover, the results from the previous section show that metal doping yields similar electronic effects on anatase and rutile.
Based on the plotted results in Figure 5, we can conclude that increasing Nb-dopant concentration to above X ) 0.0625 gives diminished increment in Fermi level electron density, i.e., diminished improvements in conductivity. This value is very close to the solid solubility limit of Nb in TiO2 where the
conductivity maximum was observed experimentally by Sato et al.25In the case of Ta, increasing dopant concentration above
X )0.125 does not increase Fermi level electron density. As expected, Fermi level electron density in Ti1-XRuXO2has the
strongest dependence on concentration as compared to those of Ti1-XNbXO2and Ti1-XTaXO2.
Summary
There is a fundamental difference in the mechanism by which Ru-doping induces electrical conductivity in titania when compared with those of Ta- and Nb-doping. Our investigations
reveal that Ru fills the titania band gap region with its own d-electrons and perturbs some Ti d-electrons into the same region. On the other hand, Ta and Nb induce electrical conductivity primarily by shifting the Fermi level to the originally unfilled bands of titania. In contrast to Ti1-XRuXO2,
the electrons at the Fermi level in Ti1-XNbXO2and Ti1-XTaXO2
correspond mainly to Ti d-orbitals. Both mechanisms are known to induce electrical conductivity in semiconductors. Due to the differences in origin, the electrical conductivity of Ru-doped titania is more linearly dependent on dopant concentration while the Nb- and Ta-doped show diminished improvements with increased doping beyond X ) 0.0625 and 0.125, respectively. The formation of a uniform Ti0.75Ru0.25O2phase is
energeti-cally unfavored by ∼5 eV based on our calculations. Our calculations support the observations of Haas et al.,5Kameyama
et al.,49and Colomer and Jurado,27who did not see the formation
of a uniform Ti1-XRuXO2solution at X ∼0.25 and below. On
the contrary, the Nb- and Ta-doped TiO2yield favorable energies
at X ) 0.25.
Acknowledgment.This work is supported by the National Research Council CanadasInstitute for Fuel Cell Innovation. The authors thank Dr. Anna Ignaszak, Dr. Alex Bauer, and Dr. Chaojie Song for helpful discussions.
References and Notes
(1) Zhang, J.; Xie, Z.; Zhang, J.; Tang, Y.; Song, C.; Navessin, T.; Shi, Z.; Song, D.; Wang, H.; Wilkinson, D. P.; Liu, Z. S.; Holdcroft, S. High temperature PEM fuel cells. J. Power Sources 2006, 160 (2), 872– 891.
(2) Antolini, E.; Gonzalez, E. R. Ceramic materials as supports for low-temperature fuel cell catalysts. Solid State Ionics 2009, 180 (9-10), 746–763.
(3) Park, K. W.; Seol, K. S. Nb-TiO2supported Pt cathode catalyst
for polymer electrolyte membrane fuel cells. Electrochem. Commun. 2007,
9(9), 2256–2260.
(4) Garcia, B. L.; Fuentes, R.; Weidner, J. W. Low-temperature synthesis of a PtRu/Nb0.1Ti0.9O2 electrocatalyst for methanol oxidation. Electrochem. Solid-State Lett. 2007, 10 (7), B108–B110.
(5) Haas, O. E.; Briskeby, S. T.; Kongstein, O. E.; Tsypkin, M.; Tunold, R.; Borresen, B. T. Synthesis and characterization of RuXTi1-XO2as a
catalyst support for polymer electrolyte fuel cell. J. New Mater. Electrochem.
Syst. 2009, 11, 9–14.
TABLE 3: Calculated Free Energy (eV) for the Substitution of Ti with M in TiO2
Ti0.75Nb0.25O2 Ti0.75Ru0.25O2 Ti0.75Ta0.25O2
anatase -0.27 5.57 -2.11
rutile -0.46 5.04 -2.34
Figure 5. Computed electron density at the Fermi level as a function of dopant mole fraction for Ru-, Ta-, and Nb-doped rutile. Increasing Nb-dopant concentration to above X ) 0.0625 gives diminished increment in Fermi level electron density, i.e., diminished improvements in conductivity. Increasing Ta-dopant concentration above X ) 0.125 does not increase Fermi level electron density. Fermi level electron density in Ti1-XRuXO2 is the most linearly dependent on dopant
concentration.
(6) Wang, A.; Xu, H.; Lu, Y.; Hu, J.; Kong, X.; Tian, B.; Dong, H. Synthesis and characterization of ruthenium-titanium composite oxide and a platinum catalyst supported on it. Chin. J. Catal. 2009, 30 (3), 179–181. (7) Matsumoto, Y.; Murakami, M.; Shono, T.; Hasegawa, T.; Fuku-mura, T.; Kawasaki, M.; Ahmet, P.; Chikyow, T.; Koshihara, S.; Koinuma, H. Room-temperature ferromagnetism in transparent transition metal-doped titanium dioxide. Science 2001, 291, 854–856.
(8) Matsumoto, Y.; Takahashi, R.; Murakami, M.; Koida, T.; Fan, X.-J.; Hasegawa, T.; Fukumura, T.; Kawasaki, M.; Koshihara, S.; Koinuma, H. Ferromagnetism in co-doped TiO2 rutile thin films grown by laser
molecular beam epitaxy. Jpn. J. Appl. Phys. 2001, 40, L1204–L1206. (9) Wang, Z.; Tang, J.; Tung, L. D.; Zhou, W.; Spinu, L. Ferromag-netism and transport properties of Fe-doped reduced-rutile TiO2-δthin films. J. Appl. Phys. 2003, 93, 7870–7872.
(10) Kim, E. C.; Moon, S. H.; Woo, S. I.; Cho, J. H.; Joh, Y. G.; Kim, D. H. Mo¨ssbauer study and magnetic properties of Ti0.9957Fe0.01O2. Solid State Commun. 2004, 132, 477–480.
(11) Wang, Z.; Tang, J.; Chen, Y.; Spinu, L.; Zhou, W.; Tung, L. D. Room-temperature ferromagnetism in manganese doped reduced rutile titanium dioxide thin films. J. Appl. Phys. 2004, 95, 7384–7386.
(12) Wang, Z.; Tang, J.; Zhang, H.; Golub, V.; Spinu, L.; Tung, L. D. Ferromagnetism in chromium-doped reduced-rutile titanium dioxide thin films. J. Appl. Phys. 2004, 95, 7381–7383.
(13) Tryba, B.; Morawski, A. W.; Inagaki, M. Application of TiO2
-mounted activated carbon to the removal of phenol from water. Appl. Catal.,
B 2003, 41 (4), 427–433.
(14) Colo´n, G.; Maicu., M.; Hidalgo, M. C.; Navio, J. A. Cu-doped TiO2
systems with improved photocatalytic activity. Appl. Catal., B 2006, 67, 41–51.
(15) Ada´n, C.; Bahamonde, A.; Ferna´ndez-Garcı´a, M.; Martı´nez-Arias, A. Structure and activity of nanosized iron-doped anatase TiO2catalysts
for phenol photocatalytic degradation. Appl. Catal., B 2007, 72 (1-2), 11– 17.
(16) Yue, L.-H.; Shui, M.; Zhu, W.-L.; Xu, Z.-D. Photocatalytic activity of lanthanum doping TiO2. J Zhejiang UniV.-Sci. A 2001, 2 (3), 271–274.
(17) Amezcua, J. C.; Lizama, L.; Salcedo, C.; Puente, I.; Dominguez, J. M.; Klimova, T. NiMo catalysts supported on titania-modified SBA-16 for 4,6-dimethyldibenzothiophene hydrodesulfurization. Catal. Today 2005,
107-108, 578–588.
(18) Prabir, K. D.; de Lucia, M. F. Correlation of catalytic activity and sensor response in TiO2high temperature gas sensors. Sens. Actuators, B
2006, 115, 1–3.
(19) Barborini, E.; Bongiorno, G.; Forleo, A.; Francioso, L.; Milani, P.; Kholmanov, I. N.; Piseri, P.; Siciliano, P.; Taurino, A. M.; Vinaty, S. Thermal annealing effect on nanostructured TiO2microsensors by supersonic
cluster beam deposition. Sens. Actuators, B 2005, 111-112, 22–27. (20) Abrahams, S. C.; Bernstein, J. L. Rutile: normal probability plot analysis and accurate measurement of crystal structure. J. Chem. Phys. 1971,
55(7), 3206–3211.
(21) Horn, M.; Schwerdtfeger, C. F.; Meagher, E. P. Refinement of the structure of anatase at several temperatures. Z. Kristallogr. 1972, 136, 273. (22) Ghicov, A.; Yamamoto, M.; Schmuki, P. Lattice widening in niobium-doped TiO2 nanotubes: efficient ion intercalation and swift
electrochromic contrast. Angew. Chem., Int. Ed. 2008, 47 (41), 7934–7937. (23) Pan, H.; Chen, N.; Shen, S.; Huang, J. Preparation and character-istics of Nb5+, Ta5+/TiO
2nanoscale powders by sol-gel process using TiCl3. J. Sol-Gel Sci. Technol. 2005, 34 (1), 63–69.
(24) Wu, X.-W.; Wu, D.-J.; Liu, X.-J. Silver-doping induced lattice distortion in TiO2nanoparticles. Chin. Phys. Lett. 2009, 26 (7), 077809.
(25) Sato, Y.; Akizuki, H.; Kamiyama, T.; Shigesato, Y. Transparent conductive Nb-doped TiO2films deposited by direct-current magnetron
sputtering using a TiO2target. Thin Solid Films 2008, 516 (17), 5758–
5762.
(26) Hitosugi, T.; Furubayashi, Y.; Ueda, A.; Itabashi, K.; Inaba, K.; Hirose, Y.; Kinoda, G.; Yamamoto, Y.; Shimada, T.; Hasegawa, T. Ta-doped anatase TiO2epitaxial film as transparent conducting oxide. Jpn. J. Appl. Phys. 2010, 44 (34), L1063–L1065.
(27) Colomer, M. T.; Jurado, J. R. Structural, microstructural, and electrical transport properties of TiO2-RuO2ceramic materials obtained
by polymeric sol-gel route. Chem. Mater. 2000, 12 (4), 923–930. (28) Bally, A. R.; Korobeinikova, E. N.; Schmid, P. E.; L’evy, F.; Bussy, F. Structural and electrical properties of Fe-doped TiO2 thin films. J. Phys.
D: Appl. Phys. 1998, 31, 1149–1154.
(29) Garcia-Belmonte, G.; Kytin, V.; Dittrich, T.; Bisquert, J. Effect of humidity on the AC conductivity of nanoporous TiO2. J. Appl. Phys. 2003, 94, 5261.
(30) Bauer, A.; Lee, K.; Song, C.; Xie, Y.; Zhang, J.; Hui, R. Pt nanoparticles deposited on TiO2-based nanofibers: Electrochemical stability
and oxygen reduction activity. J. Power Sources 2010, 195, 3105–3110. (31) Walter, R.; Hans-Hermann, L. Untersuchungen an terna¨ren Oxiden der U¨ bergangsmetalle. II. Die Systeme TiO2;NbO2und TiO2;TiTaO4. Z. Anorg. Allg. Chem. 1964, 334 (3-4), 125–141.
(32) Sikora, R. Ab initio study of phonons in the rutile structure of TiO2. J. Phys. Chem. Solids 2005, 66 (6), 1069–1073.
(33) Errico, L. A.; Weissmann, M.; RenterLa, M. Ab initio study of the magnetic ordering in the semiconductors MnxTi1-XO2, CoxTi1-XO2and
FexTi1-XO2. Physica B 2004, 354 (1-4), 338–340.
(34) Montanari, B.; Harrison, N. M. Lattice dynamics of TiO2rutile:
influence of gradient corrections in density functional calculations. Chem.
Phys. Lett. 2002, 364 (5-6), 528–534.
(35) Glassford, K. M.; Chelikowsky, J. R. Structural and electronic properties of titanium dioxide. Phys. ReV. B 1992, 46 (3), 1284.
(36) Glassford, K. M.; Chelikowsky, J. R. Electronic structure of TiO2:
Ru. Phys. ReV. B 1993, 47 (19), 12550.
(37) Hohenberg, P.; Kohn, W. Inhomogeneous electron gas. Phys. ReV. 1964, 136 (3B), B864.
(38) Kohn, W.; Sham, L. J. Self-consistent equations including exchange and correlation effects. Phys. ReV. 1965, 140 (4A), A1133.
(39) Blochl, P. E. Projector augmented-wave method. Phys. ReV. B 1994,
50(24), 17953.
(40) Kresse, G.; Joubert, D. From ultrasoft pseudopotentials to the projector augmented-wave method. Phys. ReV. B 1999, 59 (3), 1758.
(41) Kresse, G.; Furthmuller, J. Efficient iterative schemes for ab initio total-energy calculations using a plane-wave basis set. Phys. ReV. B 1996,
54(16), 11169.
(42) Kresse, G.; Furthmuller, J. Efficiency of ab-initio total energy calculations for metals and semiconductors using a plane-wave basis set.
Comput. Mater. Sci. 1996, 6 (1), 15–50.
(43) Kresse, G.; Hafner, J. Ab initio molecular dynamics for liquid metals. Phys. ReV. B 1993, 47 (1), 558.
(44) Perdew, J. P.; Chevary, J. A.; Vosko, S. H.; Jackson, K. A.; Pederson, M. R.; Singh, D. J.; Fiolhais, C. Atoms, molecules, solids, and surfaces: Applications of the generalized gradient approximation for exchange and correlation. Phys. ReV. B 1992, 46 (11), 6671.
(45) Perdew, J. P.; Chevary, J. A.; Vosko, S. H.; Jackson, K. A.; Pederson, M. R.; Singh, D. J.; Fiolhais, C. Erratum: Atoms, molecules, solids, and surfaces: Applications of the generalized gradient approximation for exchange and correlation. Phys. ReV. B 1993, 48 (7), 4978.
(46) Momma, K.; Izumi, F. VESTA: a three-dimensional visualization system for electronic and structural analysis. J. Appl. Crystallogr. 2008,
41(3), 653–658.
(47) http://plasma-gate.weizmann.ac.il/Grace/.
(48) http://cms.mpi.univie.ac.at/odubay/p4vasp_site/news.php. (49) Kameyama, K.; Shohji, S.; Onoue, S.; Nishimura, K.; Yahikozawa, K.; Takasu, Y. Preparation of ultrafine RuO2-TiO2binary oxide particles
by a sol-gel process. J. Electrochem. Soc. 1993, 140 (4), 1034–1037. (50) Gao, Y.; Liang, Y.; Chambers, S. A. Synthesis and characterization of Nb-doped TiO2(110) surfaces by molecular beam epitaxy. Surf. Sci. 1996, 348(1-2), 17–27.
(51) Traversa, E.; Di Vona, M. L.; Licoccia, S.; Sacerdoti, M.; Carotta, M. C.; Gallana, M.; Martinelli, G. Sol-gel nanosized semiconducting titania-based powders for thick-film gas sensors. J. Sol-Gel Sci. Technol. 2000,
19(1), 193–196. JP100826G