Publisher’s version / Version de l'éditeur: ECS Transactions, 35, 30, pp. 81-95, 2011-11-18
READ THESE TERMS AND CONDITIONS CAREFULLY BEFORE USING THIS WEBSITE. https://nrc-publications.canada.ca/eng/copyright
Vous avez des questions? Nous pouvons vous aider. Pour communiquer directement avec un auteur, consultez la
première page de la revue dans laquelle son article a été publié afin de trouver ses coordonnées. Si vous n’arrivez pas à les repérer, communiquez avec nous à [email protected].
Questions? Contact the NRC Publications Archive team at
[email protected]. If you wish to email the authors directly, please see the first page of the publication for their contact information.
NRC Publications Archive
Archives des publications du CNRC
This publication could be one of several versions: author’s original, accepted manuscript or the publisher’s version. / La version de cette publication peut être l’une des suivantes : la version prépublication de l’auteur, la version acceptée du manuscrit ou la version de l’éditeur.
For the publisher’s version, please access the DOI link below./ Pour consulter la version de l’éditeur, utilisez le lien DOI ci-dessous.
https://doi.org/10.1149/1.3653926
Access and use of this website and the material on it are subject to the Terms and Conditions set forth at NOx Sensing with n-type WO3 - CuWO4 Composites
Gonzalez, Carlos M.; Post, Michael L.; Dunford, Jeffrey; Du, Xiaomei
https://publications-cnrc.canada.ca/fra/droits
L’accès à ce site Web et l’utilisation de son contenu sont assujettis aux conditions présentées dans le site LISEZ CES CONDITIONS ATTENTIVEMENT AVANT D’UTILISER CE SITE WEB.
NRC Publications Record / Notice d'Archives des publications de CNRC:
https://nrc-publications.canada.ca/eng/view/object/?id=f8db7565-6735-49a9-a66e-086237509e38 https://publications-cnrc.canada.ca/fra/voir/objet/?id=f8db7565-6735-49a9-a66e-086237509e38
NOx Sensing with n-type WO3 – CuWO4 Composites
Carlos M. Gonzalez, Michael L. Post, Jeffrey Dunford, and Xiaomei Du Institute for Chemical Process and Environmental Technology
National Research Council Ottawa, Ontario, K1A 0R6, Canada
Thin-films of WO3 : CuWO4 composites were used as sensing
materials for NO monitoring. The thin-films were prepared by the pulsed laser deposition technique using formulations with molar ratio spanning from 1 to 0. The sensing films were characterized by depth-profilometry, X-ray diffraction (XRD) and electron transport measurements. The transduction mechanism and its relation to the chemical surroundings, including temperature effects, were studied by monitoring the changes in electronic conductance (resistance) with temperature, gas-phase analyte chemical nature and concentration. Sensor performance studies were carried out. It was found that the best sensing material was composed of a nanometric layer of CuWO4. This formulation offers fast
response and short recovery times towards both O2 and NO,
with a response proportional to analyte concentration and excellent reproducibility.
Introduction
Nitrogen oxide species (NOx) comprise a particularly noxious family of gas-phase
pollutants. Nitrogen monoxide (NO) and nitrogen dioxide (NO2) are primarily formed
from fossil fuel combustion. In diesel engines, the lean nature of the combustion mixture (lower hydrocarbon concentration and O2 concentration above the stoichiometric ratio for
full combustion) promotes the formation of nitrogen oxides, specifically NO and NO2.
The increasing popularity of diesel vehicles given the superior power and higher efficiency per fuel volume has produced a fast increment of the atmospheric levels of NOx species (N2O, N2O3, N2O4, N2O5) and other associated such as ozone (O3), acidic
species including HNO3 and HNO2, and particulate matter.(1) Naturally, given the strong
possibility of a catastrophic scenario with the increment of operating diesel automobiles, government institutions around the globe have produced regulatory legislations to control NOx emissions and protect both public health and public welfare. The enforcement of
these legislations (with periodic adjustments lowering the legal levels of permissible NOx
emission) has pressured the automobile industry to start the quest for more reliable, selective and robust NOx sensors.(2,3)
The conductometric sensor is a well-established prototype for monitoring gas-phase species.( 4 , 5 , 6 ) The sensing mechanism is based on physical-chemical interactions between metal oxide semiconductor surface states (e.g. free electrons, vacancies, empty orbitals or holes) and a gas-phase analyte. The effect of such interactions on the sensing material electron transport properties is interpreted and quantified through the monitoring of changes in the conductivity (or resistivity) behaviour.
Previous studies have shown that WO3 is a material used for the real time monitoring
of some gas-phase pollutants (e.g. conductometric sensor prototype), and particularly for NOx monitoring technology.7 Specifically, two major strategies have been used to
improve WO3 conductometric sensor performance, i) in combination with catalytic
metals (8,9,10,11) and ii) composite formulations with other semiconductor oxides. (7,12,13,14,15,16) The present work reports the latter as the experimental strategy to complement the sensing profile of WO3, increasing by this means the range of sensing
functionality for NOx species.
For this study, thin-films with composition WO3 : CuWO4 with varying molar ratio
were prepared using the pulsed laser deposition technique (PLD). The crystallographic and structural features of the thin-films are discussed. The temperature effect on the electron transport properties of the thin-films was investigated and the sensing performance towards O2 and NO was evaluated.
Experimental
Materials
CuWO4 was prepared in situ in presence of an excess of WO3 by a solid-state reaction
between WO3 and CuO at high temperature. The reagents were used as received, WO3
(Alfa Aesar, 99.998%) and CuO (Alfa Aesar, 99.995%). Mixtures with different W : Cu molar ratio, were placed in alumina crucibles and annealed in two steps under oxygen. First, the metal oxides were allowed to react at 600 °C for 12 hours. Prior to a second thermal treatment, the resulting material was thoroughly ground and the resulting powder sintered at 750 °C for 24 hours under O2.
Laser targets were prepared in the form of compact pellets using the powders resulting from the thermal treatments described above. The pellets were sintered at 680 °C for 24 hours in O2. A pellet of CuWO4 (T-6) was prepared by annealing a CuO : WO3 mixture
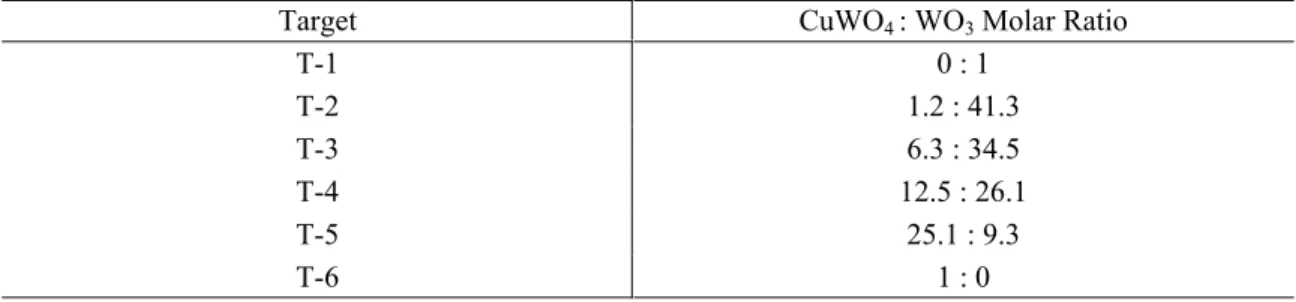
in a 1:1 stoichiometric ratio. The laser target compositions are listed in Table I. TABLE I. Pulsed Laser Deposition Target Composition (Molar Ratio)
Target CuWO4: WO3 Molar Ratio
T-1 0 : 1 T-2 1.2 : 41.3 T-3 6.3 : 34.5 T-4 12.5 : 26.1 T-5 25.1 : 9.3 T-6 1 : 0
Thin-films from targets in TABLE I were produced by the pulsed laser deposition technique (PLD) using a Lambda Physik LPX305i laser (Kr-F excimer laser with λ = 248 nm, ablation energy 600 mJ/pulse, pulse rate 8 Hz, pulse time 20 ns). Thin-films were deposited on single crystal sapphire substrates (α-Al2O3, 1— 1 02) in an isothermal
regime. Thin-films were produced by target laser ablation (20 minutes) at 600 °C in 100 mtorr O2 atmosphere. Following deposition, the chamber pressure was increased to 400
mTorr (O2) and the films were allowed to stand at 600 °C for 15 minutes. Finally, the
Physical-chemical Characterization
Laser targets and thin-films were characterized by powder-X-ray diffraction (P-XRD) using a Bruker-D8 diffractometer with parallel beam geometry and a sample holder kept stationary with both the XR-source tube and detector arms mobile. The XR-source was a cobalt tube (Co λ Kα1 = 1.78897 Å). No monochromator or filter were used. The
crystallographic studies of the PLD thin-films were done by spinning the sample at 15 rpm. XRDs for laser targets (pellets) were obtained with a stationary sample holder. The fingerprint methodology (Phase-ID, Search/Match routine) was used as a diagnostic tool for the identification of crystal phases and analysis of reaction products. The reference patterns used for the structural analysis were provided in the ICDD Powder Diffraction File (PDF) database (supplied as PDF-2 and compiled into DIFFRACTplus Reference Database format, release in 2002).
Thin-film thicknesses were measured using an XP-2TM profilometer (XP Series Stylus Profilometer, Ambios Tecnnology, Inc.).
The system for evaluating the sensing performance consisted of computer operated elements with a heater (powered using a Xantrex HPD 60-5 power supply), gas-supply manifold (MKS Type 1479A, Mass-Flo® controllers), sensing electrodes (gold electrodes connected to a sourcemeter, Keithley 2400) and a custom feedback temperature controller equipped with a K-type thermocouple. For sensing studies, gold electrodes were deposited onto the thin-films using a thermal vacuum procedure. Conductance (resistance) was monitored to detect changes in electron transport properties with changes in experimental conditions (e.g. temperature effects, interaction with gas-phase species,
etc.). In order to assure proper ohmic contacts, two small pads of gold were placed between the sensing electrodes and the film electrodes. For the experiments, the total gas flow rate was kept at 250 cm3/minute. The temperature range for the sensing functionality studies was between 100-500 °C.
Results and Discussion
Structural Characterization
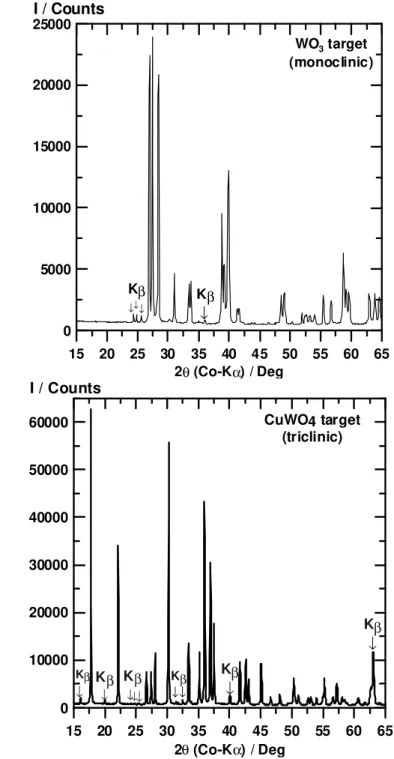
Formation of CuWO4 was confirmed by comparing the XRD laser target reflections
with database standards (DIFFRACTplus Reference Database). The limiting reagent within the molar ratio used for laser targets was CuO. In accordance with this, no reflections from CuO were observed. Figure 1 shows the XR-diffractogram for PLD targets containing pure samples, Figure 1a shows the XRD for CuWO4 XRD and 1b.
WO3 XRD. Excellent match for reflections were found for the targets (standards provided
by the DIFFRACTplus Reference Database format, 2002). WO3 features a monoclinic
15 20 25 30 35 40 45 50 55 60 65 2θ (Co-Kα) / Deg 0 5000 10000 15000 20000 25000 I / Counts Kβ ↓↓↓ Kβ ↓ WO3target (monoclinic) 15 20 25 30 35 40 45 50 55 60 65 2θ (Co-Kα) / Deg 0 10000 20000 30000 40000 50000 60000 I / Counts Kβ ↓ Kβ↓ Kβ Kβ ↓ Kβ ↓↓ CuWO4 target (triclinic) Kβ ↓ ↓↓↓
Figure 1. XRDs for PLD Targets. Figure 1a. WO3 XRD and 1b. CuWO4 XRD.
The XRD for the targets showed weak reflections arising from Co-Kβ wavelengths. For instance, for WO3 (Figure 1a) the corresponding XR-diffractogram shows a small
triplet centered at 24.9 °. Calculation of d-spaces using the corresponding 2θ angles and the wavelength for Co-Kβ line produced identical lattice parameter (d) values as for the triplet centered at 27.7 °. This is consistently the case, allowing to exclude the presence of impurities. The XRD of the targets for remaining formulations reflected the increasing content of CuWO4. The 2θ angles for both phases remained at the same position as for
the pure material pellets (XRD targets). 1b.
TABLE II lists the films thicknesses as measured using profilometry, film
composition, rate of thin-film growth, and deposition temperature. The values reported in
TABLE II corroborated the nanoscopic nature of the films. For some compositions, the
film deposition was carried out at both 600 °C and 20 °C. This was done to evaluate the effect of deposition temperature on lattice parameters. Material transfer from pellet to substrate surface (α-Al2O3) was considered to be nearly stoichiometric as it is often found
for this technique.(20) The thin-film composition in TABLE II (molar ratio Cu : W) reflects the latter assumption.
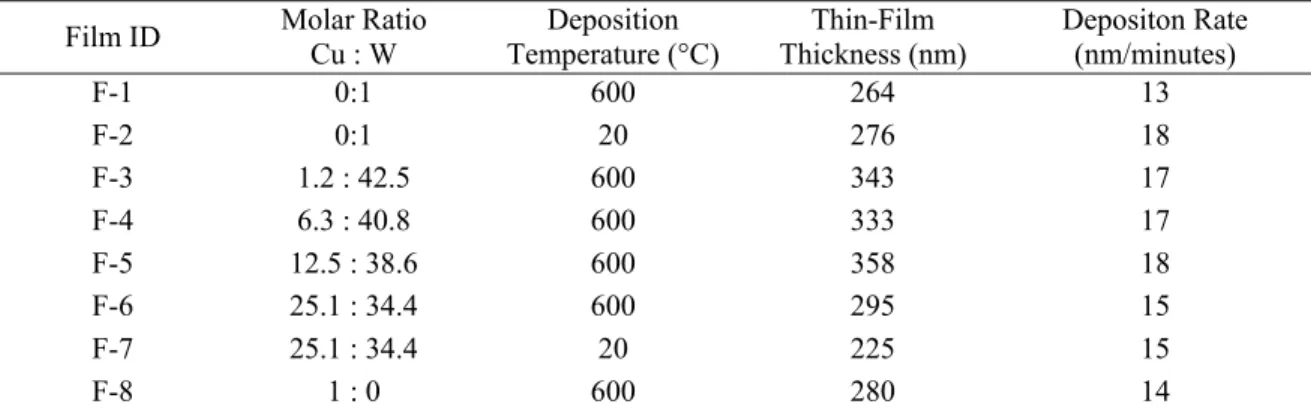
TABLE II. Thin-film Thickness Estimated by Profilometry, Laser Deposition Parameters and
Corresponding Film Composition (Cu : W molar ratio). Film ID Molar Ratio
Cu : W Deposition Temperature (°C) Thin-Film Thickness (nm) Depositon Rate (nm/minutes) F-1 0:1 600 264 13 F-2 0:1 20 276 18 F-3 1.2 : 42.5 600 343 17 F-4 6.3 : 40.8 600 333 17 F-5 12.5 : 38.6 600 358 18 F-6 25.1 : 34.4 600 295 15 F-7 25.1 : 34.4 20 225 15 F-8 1 : 0 600 280 14
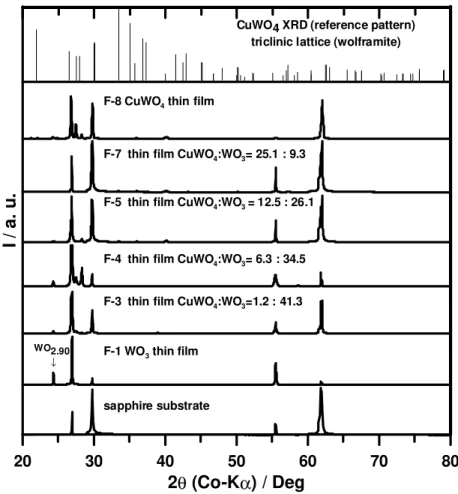
Figure 2 shows the XRDs for studied thin-films. The films prepared at room
temperature (F-2 and F-7, TABLE II) did not show reflections other than those due to the α-Al2O3 substrate. Further characterization of these films, shown by XRD to be
amorphous, was not carried out. As expected, the thin-film XRDs showed the substrate reflections. Note that both the substrate (α-Al2O3) and the thin-film material (WO3 and
CuWO4) display XRD patterns with reflections within similar 2θ angles. For instance, for
F-1 (Figure 2), overlap at 2θ ≈ 55.38 ° occurred. This fact is supported by the change in the observed order for relative intensity at the 2θ angles where the substrate reflections appeared (both arising from Kα1 and Kβ X-ray radiation). The thin-film XRDs display a
reduced number of reflections compared with the bulk material. The WO3 thin-film XRD
(F-1) revealed a preferential orientation for the PL deposited film along the (0, 0, 2n) axes (monoclinic WO3). For instance, the WO3 thin-film (F-1) displayed a medium to
low intensity reflection centered at 55.477 °, this reflection corresponds to the [0,0,4] plane, and a reflection at 26.932 ° corresponds to the [0,0,2] plane both in a WO3
monoclinic unit cell.
Comprehensive phase and composition identification based on the thin-film XRDs was not possible due to the preferential orientation and limited number of reflections. For instance, the F-1 XRD (WO3 thin-film XRD) shows reflections that can be assigned to
monoclinic WO3 (2θ = 26.932 ° and 55.477 °),21 while the reflection at 2θ=24.375 ° does
not correspond to WO3 (WO3 monoclinic unit cell). The WO3 thin-film (F-1) produced in
this study displayed a pale-blue color with a grayish tone. This colour is characteristic of oxygen-depleted tungsten oxides (WO3-δ).(17, 18, 19) In particular, WO2.90 has been
reported to be dark blue coloured. Based on the film colour, it is likely that there has been a formation of a non-stochiometric tungsten oxide phase (WO3-δ). The reflection at 2θ ≈ 24.38 ° supports this assumption (XRD for F-1). Phases with oxygen-to-tungsten ratio (3-δ) = 2.9 have been reported before for WO3-based thin-films. (22, 23, 10, 24, 25)
20 30 40 50 60 70 80 2θ (Co-Kα) / Deg I / a. u . sapphire substrate WO2.90 ↓
F-8 CuWO4thin film
F-7 thin film CuWO4:WO3= 25.1 : 9.3
F-5 thin film CuWO4:WO3= 12.5 : 26.1
F-4 thin film CuWO4:WO3= 6.3 : 34.5
F-3 thin film CuWO4:WO3=1.2 : 41.3
F-1 WO3thin film
CuWO4 XRD (reference pattern) triclinic lattice (wolframite)
Figure 2. XRDs for Representative Thin-Films of CuWO4 : WO3 Thin-film Sensing Performance Characterization
For the conductivity measurements, all the thin-film formulations displayed a change
in charge carrier behaviour with both temperature and gas-phase analyte exposure to O2
and NO. Thin-films with a WO3 excess did not show sensing properties suitable for
sensing applications. Although all the films containing WO3 displayed short response
times, a long time for signal stabilization upon analyte exposure (during and after gas exposure) and long recovery time were common features; e.g. in the case of the WO3
thin-film, for NO sensing study at 500 °C, the time elapsed for signal recovery was about 8 hours. In contrast, the thin-film with composition CuWO4 (F-8) showed excellent
sensing parameters for O2 and NO. Given the excellent sensing profile displayed by the
CuWO4 thin-film (F-8), the sensing performance discussion will focus on the results
obtained for this material.
For many semiconductor metal oxides, the sensing mechanism for gas-phase species is based on physical-chemical changes that interacting gas-phase species produce within the outer layer of sensing materials (e.g. electronic origin, change of composition and structure, etc.). Equation 1 summarizes the fundamental process that renders CuWO4
thin-film (F-8) suitable for sensing redox gas-phase species; that is, gas-phase species that undergo a redox change upon interaction with surface states within the semiconductor surface such as O2.(3, 4, 5, 7, 8)
(O0x) ⇄ 1/2 O2 + (V ..) + 2e– [1]
Interaction of reactive gas-phase species with semiconductor metal oxides at high temperature (T > 100 °C) modifies the surface electron transport properties through a change in surface defect concentration (chemisorption processes). Formation of ionized oxygen species at the semiconductor surface, at the expense of the removal of charge diffusion electrons, changes the physical–chemical properties of the surface (effect of gas-phase species on energy and chemical nature of surface states, band bending, formation of new species through chemisorption, segregation of both ionized oxygen adsorbates and oxygen-vacancies into deeper layers, etc.).(3, 4, 5, 7, 26) Monitoring changes in the charge carrier behaviour with temperature and gas-phase analyte using properties associated with the electron transport properties behavior (e.g. conductance / resistance) provides information that allows the evaluation of sensing potential.
Temperature Effect on the Electron Transport Properties
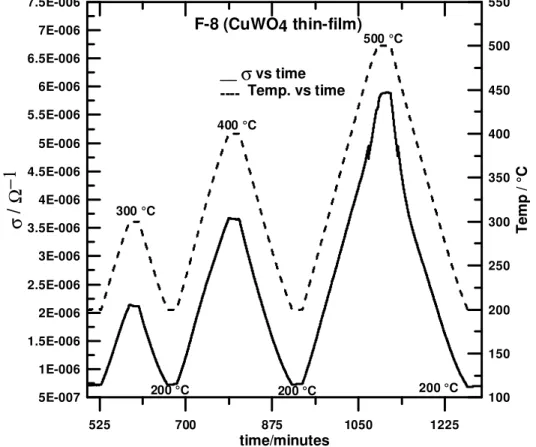
Figure 3 shows the temperature effect on the F-8 conductance σ (CuWO4 thin-film) in
the 200-500 °C range. As expected for semiconductor materials, the σ for this thin-film increased with temperature (Figure 3), which agrees with the intrinsic, activated nature of electron mobility and conductivity for metal oxide semiconductors.(27, 28, 29, 30, 31)
525 700 875 1050 1225 time/minutes 5E-007 1E-006 1.5E-006 2E-006 2.5E-006 3E-006 3.5E-006 4E-006 4.5E-006 5E-006 5.5E-006 6E-006 6.5E-006 7E-006 7.5E-006 σ /Ω −1 100 150 200 250 300 350 400 450 500 550 Te m p / °C F-8 (CuWO4 thin-film) __σvs time ---- Temp. vs time 200 °C 200 °C 500 °C 200 °C 400 °C 300 °C
Figure 3. Thermal Stability and Reference State (20 % O2 in N2) Conductance
Despite the cyclical thermal stress promoted by regular temperature changes, the film showed good reproducibility for σ in the reference gas (20 % O2 in N2). This indicates
that the film possesses good mechanical endurance and suitable thermal stability. Effect of Oxygen Concentration on the Electrical Properties of F-8 ( CuWO4 thin-film)
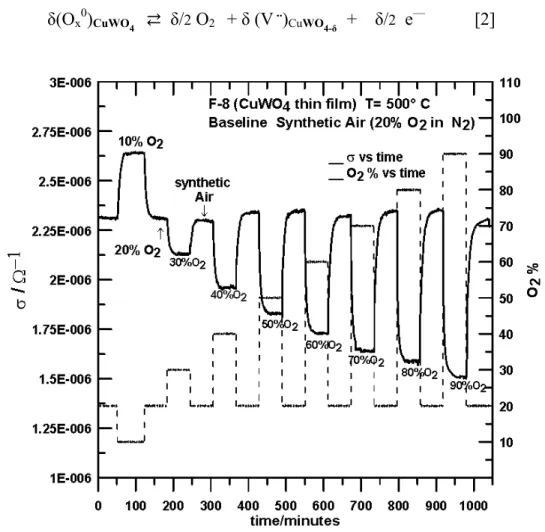
The decrease in conductance σ for the monitored metal oxide surface with increasing O2 concentration is a suitable evidence to establish the semiconductor nature.(32) Hence,
it is shown that CuWO4 behaved as an n-type semiconductor. Since n-type
semiconductor metal-oxides are characterized by the presence of oxygen vacancies, an increment in O2 concentration will promote the reduction of this type of surface state.
This process is confirmed by a change (reduction) in thin-film conductance. Equation 2 represents the process that controls the electronic behavior of CuWO4 thin-film (F-8) at
high temperature. Several measurements of σ profile vs. [O2] were done in order to study
the effect of [O2] at 300 and 500 °C. Figure 4 shows the effect of oxygen concentration
on the F-8 electrical transport properties at 500 °C. The electrical conductance σ at 300 ° displayed a similar behavior. The changes for σ at the latter temperature were less pronounced than for σ vs. [O2] at 500 °C. As expected, σ decreased with increasing O2
concentration, in accord with the expected behaviour for n-type semiconductor metal oxides ([O2] increases→ σ decreases).
δ(Ox0)CuWO4 ⇄ δ/2 O2 + δ (V ..)CuWO4-δ + δ/2 e— [2]
Reproducibility tests were performed in order to test the accuracy of the material response to O2 at 300 ° and 500 °C. Figure 5 shows the effect of cyclic O2 exposures on
the σ values at 500 °C. . 0 50 100 150 200 250 300 350 400 450 time/minutes 1.5E+006 1.65E+006 1.8E+006 1.95E+006 2.1E+006 2.25E+006 2.4E+006 2.55E+006 2.7E+006 2.85E+006 3E+006 3.15E+006 R/ Ω 10 20 30 40 50 60 70 80 90 100 O2 % __ R vs time ----O2 % vs time 20%O2 ↓ ↓ F-8 (CuWO4 thin-film) T= 500 °C Reference synthetic air (20% O2 in N2)
20%O2 ↓ ↓
Figure 5. Reliability Tests for F-8 (CuWO4 Thin-Film). The Plots Show the Change of
Resistance Values (R) with [O2], T=500 °C.
In general, the F-8 (CuWO4 Thin-Film) response towards O2 produced consistent
changes in electrical conductivity with oxygen concentration at both working temperatures. The values are reproduced within +/- 3 %. The response maxima occurred at exposure periods (~5 minutes) within the residence time for the gas flow apparatus used for data collection. For this study, the recovery time was defined as the time required for reaching a stationary state in the reference gas (20% O2 in N2) upon a change
in [O2] and was calculated using the relation δR/δt vs. t (time). At 300 °C, the estimated
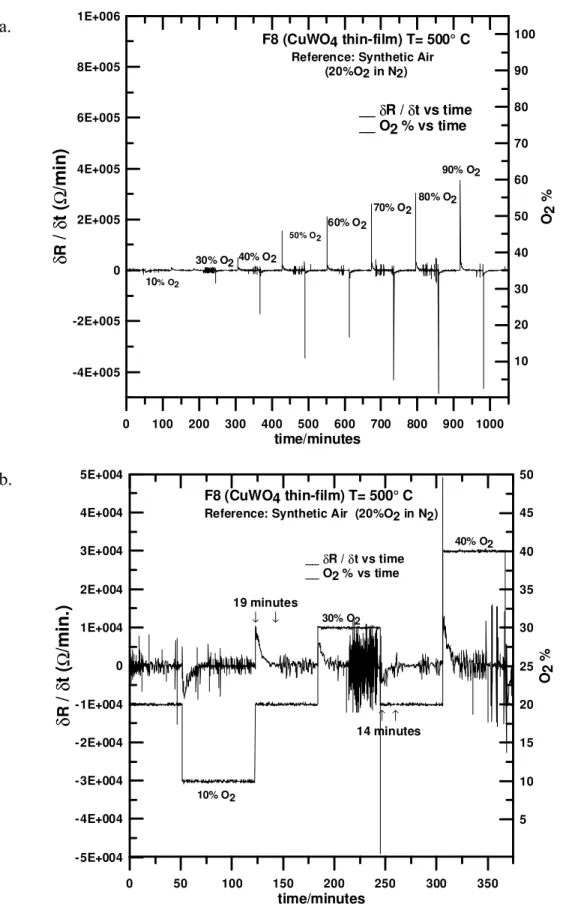
recovery time was approximately 45 minutes, whereas at 500 °C, a stationary state was reached within 20 minutes. Figure 6 shows the differential plot (δR/δt vs. time) for resistance change with both time and [O2]. The recovery time did not show a significant
0 100 200 300 400 500 600 700 800 900 1000 time/minutes -4E+005 -2E+005 0 2E+005 4E+005 6E+005 8E+005 1E+006 δ R /δt( Ω /m in ) 10 20 30 40 50 60 70 80 90 100 O2 % F8 (CuWO4 thin-film) T= 500° C
Reference: Synthetic Air (20%O2 in N2) __δR / δt vs time __ O2 % vs time 10% O2 30% O2 40% O2 50% O2 60% O2 70% O2 80% O2 90% O2 0 50 100 150 200 250 300 350 time/minutes -5E+004 -4E+004 -3E+004 -2E+004 -1E+004 0 1E+004 2E+004 3E+004 4E+004 5E+004 δ R /δt( Ω /m in .) 5 10 15 20 25 30 35 40 45 50 O2 % 10% O2 30% O2 40% O2 19 minutes ↓ ↓ ↑ ↑ 14 minutes F8 (CuWO4 thin-film) T= 500° C
Reference: Synthetic Air (20%O2 in N2)
__δR / δt vs time
__ O2 % vs time
Figure 6. Rates of Response and Recovery for O2 Exposure (CuWO4 Thin-Film). Figure 6a shows a derivative plot for R vs. [O2] with time at T=500 °C. Figure 6b shows an
expanded view for the 10 – 40 % [O2] range.
6b. 6a.
Sensing Performance for CuWO4 Thin-Film (F-8) toward Nitrogen Monoxide NO
The thin-film (F-8, CuWO4) displayed a change in conductance with gas-phase
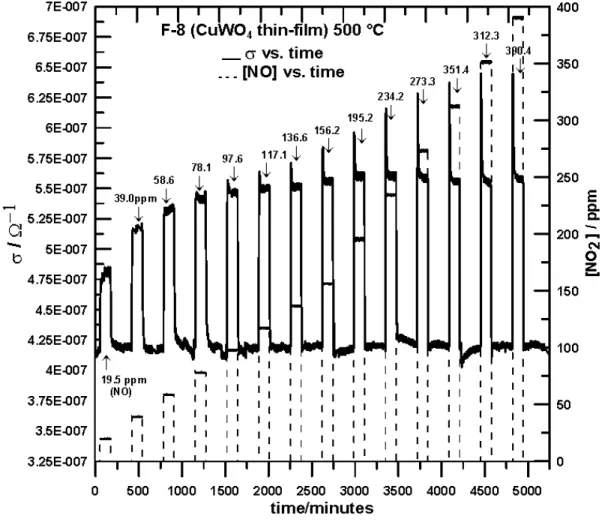
analyte concentration [NO], as shown in Figure 7. NO exposure promoted an enhancement for the electron transport of F-8. This is manifested by the stepwise increase of σ with increasing [NO]. The data profile consisted of a fast response upon initial NO exposure (~ 5 minutes). For the [NO] range investigated, this pattern was consistently observed. The elapsed time period for the latter parameter is consistent also with the estimated residence time (~ 4 minutes) in the measurement flow system, thus the response rate is considered very fast. The response time for the concentration range investigated did not show a significant dependence on [NO].
Figure 7. Sensor Response for F-8 (CuWO4 thin-film) to NO Exposure, T= 500 °C.
The σ profile shows a rather complex behaviour in the [NO] range studied. Upon NO exposure, the conductance underwent a sudden increase proportional to the [NO]. Shortly after the sudden conductance rise, a decrease is observed. This pattern suggests the occurrence of two parallel chemical processes. Commonly, interaction of reactive gas-phase species with semiconductor metal oxides modifies the surface electron transport properties by redox processes. The increase in σ with [NO] indicated that this species promotes the formation of new surface states (e.g. oxygen vacancies, surface electrons). For this event, a possibility is the oxidation of NO adsorbates at the material surface resulting in the transfer of charge carriers to the sensing material surface. The increase in resistance after the first stage is in agreement with a removal of charge carriers from the semiconductor surface by a product from the first, faster process. For the latter process, NO2 resulting from the oxidation of NO through the annihilation of surface O2- oxide
species (or O-) could promote the resistance increment. Consequently, NO2 should have
undergone a reduction process that produced NO or N2. Equations 3 and 4 are proposed
to satisfy the dynamics observed for this system.
NO + O2 ⇄ NO2 + 2e– [3]
NO2 + 2e– ⇄ NO + O2– [4]
Conclusions
CuWO4 thin-films, prepared by the pulsed laser deposition technique, show sensor
functionality toward NO and O2. The thermal stability and consistency of the
conductivity with temperature reveal the potential of CuWO4 thin-films for
high-temperature monitoring applications. The material showed satisfactory σ reproducibility, which is a fundamental property for the fabrication of a sensor prototype. The reproducibility for response indicates that the chemistry that controls the sensing mechanism to NO consists of reversible and temperature-dependent chemical interactions consisting of two overlapping processes. The reversible nature of interaction with O2
suggests that, with appropriate consideration for oxygen partial pressure, the material could be used for NO monitoring applications in oxidizing environments.
Acknowledgements
The authors thank the NRCan AFTER program for funding support for this work in activity C23.007. This article is recorded as National Research Council of Canada; NRCC# 53014.
References
1. Nitrogen cycles: past, present, and future. Galloway, J.N.; Dentener, F. J.; Capone D. G.; Boyer, E. W.; Howarth, R. W.; Seitzingers, S. P.; Asner, G. P.; Cleveland, C. C.; Green, P. A.; Holland, E. A.; Karl, D. M.;Michael, A. F.; Porter, J. H.; Townsend, A. R.; Vörösmarty, C. J. Biogeochemistry, 70, 153-226(2004).
2 . http://www.epa.gov/airquality/nitrogenoxides/index.html
3 . Thin-film gas sensors based on semiconducting metal oxides. Meixner, H.; Gerblinger, J.; Lampe, U.; Fleischer M. Sensors and Actuators B, 23, 119-125(1995). 4. Aswal, D. K. and Gupta, Sh. K. Science and technology of chemiresistors gas
sensors. Nova Science Publishers, Inc., (2007).
5. Korotcenkow, G. Chemical sensors, fundamentals of sensors materials (Volume 2). Ed. Momentum Press, LLC, (2010).
6. Critical review of nitrogen monoxide sensors for exhaust gases of lean burn
engines. Ménil, F.; Coillard, V.; Lucat, C. Sensors and Actuators B, 6, 1-23(2000).
7. Materials for high temperature electrochemical NOx gas sensors. Fergus, J. W.
Sensors and Actuators B, 121, 652-663 (2007).
8. Tungsten oxide-based semiconductor sensor for detection of nitrogen oxides in
combustion exhaust. Akiyama, M.; Zhang, Z.; Tamaki, J.; Miura, N.; Yamazoe, N.;
Noboru, H. Sensors and Actuators B, 14, 619–620(1993).
9. Ag doped WO3-based powder sensor for the detection of NO gas in air. Chen, L.;
Tsang, S.C. Sensors and Actuators B, 89, 68–75(2007).
10. Properties of metal doped tungsten oxide thin films for NOx gas sensors growth
by PLD method combined with sputtering process. Kawasaki, H.; Ueda, T.; Suda, Y.; Ohshima, T. Sensors and Actuators B, 100, 266-269(2004).
11. Gas sensors based on anodic tungsten oxide. Sensors and Actuators B, 153, 293-300(2011).
12. Impedancemetric gas sensor based on Pt and WO3 co-loaded TiO2 and ZrO2 as total NOx sensing materials. Shimizu, K.; Kashiwagi, K.; Nishiyama, H.; Kakimoto, S.; Sugaya, S.; Yokoi, H.; Satsuma, A. Sensors and Actuators B, 130, 707-712(2008).
13. Fast gas sensors based on metal oxides which are stable at high temperatures. Fleischer, M.; Meixner, H. Sensors and Actuators B, 43, 1-10(1997).
14 . Effects of NiO/TiO2 addition in ZnFe2O4-based gas sensors in the form of polymer thick films. Arshak, K.; Gaidan, I. Thin Solid Films, 495, 292-298(2006).
15. Semiconductor gas sensors and problems of the Earth’s ozonosphere. Gutman, E. E. Sensors and Actuators B, 23, 209-214(1995).
16. Nitrogen oxides-sensing characteristics of WO3-based nanocrystalline thick film gas sensor. Lee, D.-S.; Han, S.-D.; Huh, J.-S., Duk-Dong Lee, D.-D. Sensors and
Actuators B, 60, 57-63(1999).
17. A. Magneli, Acta Chem. Scand., 3, 88(1949).
18 . Non-stoichiometry and structural disorder in some families of inorganic
compounds. Magnéli, A. Pure & Appl. Chem., 50, 1261-1271(1978).
19 . Phase transformations in WO3 thin films during annealing. Al-Mohammad,
Gillet, A. M. Thin Solid Films, 408, 302-309(2002).
20. Pulsed laser deposition of thin-films. Ed. by Eason. R. John Wiley & Sons, Inc. Hoboken, New Jersey, USA. (2007).
21. Structure refinement of triclinic tungsten trioxide. Woodward, P. M.; Sleight, A. W.; Vogt, T. J. Phys. Chem. Solids, 56, 1305-1315(1995).
22. High crystalline tungsten trioxide thin layer obtained by SPD technique. Enesca, A.; Enache, C.; Duta, A.; Schoonmanb, J. J. Eur. Ceram. Soc., 26, 571-576(2006).
23. NO2 sensitivity of WO3 thin film obtained by high vacuum thermal evaporation.
Cantalini, C.; Sun, H.T.; Faccio, M.; Pelino, M.; Santucci, S.; Lozzi, L.; Passacantando, M. Sensors and Actuators B, 31, 81-87(1996).
24. Pulsed laser deposited WO3 thin films for gas sensor. Mitsugi, F.; Hiraiwa, E.;
Ikegami, T.; Ebihara, K. Surface and Coatings Technology, 169 -170, 553-556(2003).
25 . XPS studies of active elements surface of gas sensors based on WO3−x
nanoparticles. Shpak, A.P.; Korduban, A.M.; Medvedskij, M.M.; Kandyba, V.O. J.
Electron Spectroscopy and Related Phenomena, 156-158, 172-175(2007).
26 . Preparation and chemiresistive properties of nanostructured materials. Bochenkov, V.E.; Sergeev, G.B. Advances in Colloid and Interface Science, 116, 245-254(2005).
27 . Oxygen Vacancy: The Invisible Agent on Oxide Surfaces. Pacchioni, G.
ChemPhysChem., 4, 1041-1047(2003).
28. Electronic properties of two-dimensional systems. Ando, T. Rev. Mod. Phys., 54, 437-672(1982).
29. Disordered electronic systems. Lee, P. A. Rev. Mod. Phys., 57, 287-337(1985). 30. Granular electronic systems. Beloborodov, I. S.; Lopatin, A. V.; Vinokur, V. M.
Rev. Mod. Phys., 79, 469-518(2007).
31 . Electrical conduction via slow surface states on semiconductors. Statz, H.; Demars, G. A. Phys. Rev., 111, 169-182(1958).
32 . Metal oxides for solid-state gas sensors: What determines our choice? Korotcenkov, G. Materials Science and Engineering B, 139, 1-23(2007).
![Figure 5. Reliability Tests for F-8 (CuWO 4 Thin-Film). The Plots Show the Change of Resistance Values (R) with [O 2 ], T=500 °C](https://thumb-eu.123doks.com/thumbv2/123doknet/14127769.468631/10.918.189.739.166.614/figure-reliability-tests-cuwo-plots-change-resistance-values.webp)