Supporting information
Nanostructure Generation During Milk Digestion in
Presence of Cell Culture Models Simulating the Small
Intestine
Claudia Hempt1,2§, Mark Gontsarik3§, Tina Buerki-Thurnherr1, Cordula Hirsch1 and Stefan Salentinig4*
1Laboratory for Particles-Biology Interactions, Empa, Swiss Federal Laboratories for
Materials Science and Technology, Lerchenfeldstrasse 5, 9014 St. Gallen, Switzerland
2Department of Health Sciences and Technology, ETH Zürich, Zürich, Switzerland 3Laboratory for Biointerfaces, Empa, Swiss Federal Laboratories for Materials
Science and Technology, Lerchenfeldstrasse 5, 9014 St. Gallen, Switzerland
4Department of Chemistry, University of Fribourg, Chemin du Musée 9, 1700
Fribourg, Switzerland §Contributed equally
Lipid uptake assay
For the positive control investigations an advanced co-culture model consisting of Caco-2, HT-29 and Raji B lymphocytes, 22 d old, was treated with 50 µg/ml of the fatty acid synthesis inhibitor C75 for 24 h. After the treatment the medium was removed and the cultures were washed with PBS. Transwell inserts were incubated for 10 min with 250 µl of 20 µM BODIPY™ 500/510 C1, C12 fluorescent fatty acid analog (Thermo Fischer, D3823) in 0.1% BSA according to manufacturer’s protocol. Then Transwell inserts were washed with ice cold 0.1% BSA and complete DMEM made from phenol red free medium has been added to the apical and basal compartment. The cells were incubated for 1 h at standard growth conditions and the fluorescence was measured with a multi-well plate reader (Mithras2 LB943, Berthold Technologies) at 485/528 nm (excitation/emission).
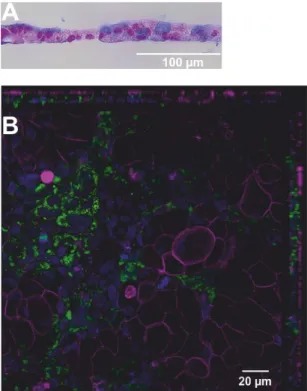
Figure S1. Physiological function of the Caco-2/HT-29 co-culture.
(A) Alcian blue staining of the Caco-2/HT-29 co-culture reveals the presence of a nearly continuous mucus layer on the cell surface. (B) Lipid uptake in Caco-2/HT-29/ Raji co-cultures. The cells are stained with phalloidin to visualise the F-actin in the cell membrane (magenta) and 4',6-diamidino-2-phenylindole to show cell nuclei (blue). The uptaken fluorescent lipid is shown in green.
Figure S2. SAXS curves of the apical digestion mixture before the addition of
pancreatin extract (black) and 70 min after (red) in the presence of cells.
Figure S3. Estimation of the digestion progress from the amount of NaOH titrated.
Triglycerides with an average of 44 carbons in the fatty acids was assumed for the calculation of initial concentration of fatty acids in milk [1,2].
Figure S4. Measured pH and the calculated lattice parameters of Im3m (◊), H2 (○), and Lα (∆) phases during the digestion of milk mixture in the presence of Caco-2/HT-29 co-cultures.
Figure S5. Comparison of SAXS curves from the digestion experiments in the
presence (red curves) or absence (blue and green curves) of the Ca2/HT-29 co-culture before addition of pancreatin extract before digestion, and after 35, 55, and 70 min of digestion.
Figure S6. Measured pH and the calculated lattice parameters of Im3m (◊), H2 (○), and Lα (∆) phases during the digestion of milk mixture without cells. After a brief initial ~6 min equilibration, the pH was constant at 6.5.
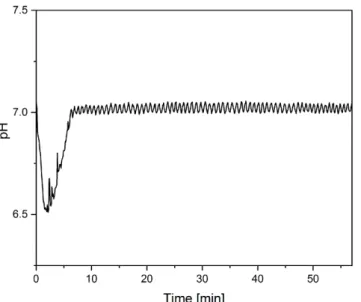
Figure S7. Measured pH of the control milk mixture digestion experiment at pH 7.0 in
the absence of cells.
References
[1] W.C. Breckenridge, A. Kuksis, Molecular weight distributions of milk fat triglycerides from seven species., J. Lipid Res. 8 (1967) 473–8. http://www.ncbi.nlm.nih.gov/pubmed/6049672 (accessed November 30, 2019). [2] M. Juarez, M. Ramos, SHEEP | Milk, Encycl. Food Sci. Nutr. (2003) 5198–5205.