HAL Id: inserm-02264015
https://www.hal.inserm.fr/inserm-02264015
Submitted on 6 Aug 2019
HAL is a multi-disciplinary open access archive for the deposit and dissemination of sci-entific research documents, whether they are pub-lished or not. The documents may come from teaching and research institutions in France or abroad, or from public or private research centers.
L’archive ouverte pluridisciplinaire HAL, est destinée au dépôt et à la diffusion de documents scientifiques de niveau recherche, publiés ou non, émanant des établissements d’enseignement et de recherche français ou étrangers, des laboratoires publics ou privés.
adipogenic, lipid metabolism and inflammatory genes is
positively associated with BMI and HOMA-IR
Daniel Castellano-Castillo, Pierre-Damien Denechaud, Lluis Fajas, Isabel
Moreno-Indias, Wilfredo Oliva-Olivera, Francisco Tinahones, Maria Isabel
Queipo-Ortuño, Fernando Cardona
To cite this version:
Daniel Castellano-Castillo, Pierre-Damien Denechaud, Lluis Fajas, Isabel Moreno-Indias, Wilfredo Oliva-Olivera, et al.. Human adipose tissue H3K4me3 histone mark in adipogenic, lipid metabolism and inflammatory genes is positively associated with BMI and HOMA-IR. PLoS ONE, Public Library of Science, 2019, 14 (4), pp.e0215083. �10.1371/journal.pone.0215083�. �inserm-02264015�
Human adipose tissue H3K4me3 histone
mark in adipogenic, lipid metabolism and
inflammatory genes is positively associated
with BMI and HOMA-IR
Daniel Castellano-Castillo1,2, Pierre-Damien Denechaud3,4,5, Lluis Fajas3,4, Isabel Moreno-IndiasID1,2*, Wilfredo Oliva-Olivera1,2, Francisco Tinahones1,2☯, Marı´a Isabel
Queipo-OrtuñoID1,2,6*, Fernando Cardona1,2☯
1 Unidad de Gestio´n Clı´nica de Endocrinologı´a y Nutricio´ n del Hospital Virgen de la Victoria, Instituto de Investigacio´n Biome´dica de Ma´laga (IBIMA), Universidad de Ma´laga, Ma´ laga, Spain, 2 Centro de
Investigacio´n Biome´dica en Red de Fisiopatologı´a de la Obesidad y la Nutricio´n, CIBERobn, Madrid, Spain, 3 Center for Integrative Genomics, University of Lausanne, Lausanne, Switzerland, 4 Department of Physiology, University of Lausanne, Lausanne, Switzerland, 5 Institut des Maladies Me´taboliques et Cardiovasculaires, Inserm UMR 1048, Toulouse, France, 6 Unidad de Gestio´n Clı´nica Intercentro de Oncologı´a Me´dica del Hospital Virgen de la Victoria, Instituto de Investigacio´ n Biome´dica de Ma´laga (IBIMA), Universidad de Ma´ laga, Ma´laga, Spain
☯These authors contributed equally to this work.
*maribelqo@gmail.com(MIQO);isabel_moreno_indias@hotmail.com(IMI)
Abstract
Introduction
Adipose tissue is considered an important metabolic tissue, in charge of energy storage as well as being able to act in systemic homeostasis and inflammation. Epigenetics involves a series of factors that are important for gene regulation or for chromatin structure, mostly DNA methylation and histone-tail modifications, which can be modified by environmental conditions (nutrition, lifestyle, smoking. . .). Since metabolic diseases like obesity and diabe-tes are closely related to lifestyle and nutrition, epigenetic deregulation could play an impor-tant role in the onset of these diseases and vice versa. However, little is known about histone marks in human adipose tissue. In a previous work, we developed a protocol for chromatin immunoprecipitation (ChIP) of frozen human adipose tissue. By using this method, this study investigates, for the first time, the H3K4 trimethylation (H3K4me3) mark (open chromatin) on the promoter of several factors involved in adipogenesis, lipid metabo-lism and inflammation in visceral adipose tissue (VAT) from human subjects with different degrees of body mass index (BMI) and metabolic disease.
Methodology
VAT was collected and frozen at -80˚C. 100 mg VAT samples were fixed in 0.5% formalde-hyde and homogenized. After sonication, the sheared chromatin was immune-precipitated with an anti-H3K4me3 antibody linked to magnetic beads and purified. H3K4me3 enrich-ment was analyzed by qPCR for LEP, LPL, SREBF2, SCD1, PPARG, IL6, TNF and E2F1
a1111111111 a1111111111 a1111111111 a1111111111 a1111111111 OPEN ACCESS
Citation: Castellano-Castillo D, Denechaud P-D, Fajas L, Moreno-Indias I, Oliva-Olivera W, Tinahones F, et al. (2019) Human adipose tissue H3K4me3 histone mark in adipogenic, lipid metabolism and inflammatory genes is positively associated with BMI and HOMA-IR. PLoS ONE 14 (4): e0215083.https://doi.org/10.1371/journal. pone.0215083
Editor: Susanne Kaser, Medical University Innsbruck, AUSTRIA
Received: November 26, 2018 Accepted: March 26, 2019 Published: April 8, 2019
Copyright:© 2019 Castellano-Castillo et al. This is an open access article distributed under the terms of theCreative Commons Attribution License, which permits unrestricted use, distribution, and reproduction in any medium, provided the original author and source are credited.
Data Availability Statement: All relevant data are within the manuscript and its Supporting Information files.
Funding: Marı´a Isabel Queipo-Ortuño was supported by the “Programa Nicolas Monarde”, Consejeria de Salud, Junta de Andalucı´a, co-funded by the Fondo Europeo de Desarrollo Regional-FEDER (C-0030-2018). Daniel Castellano-Castillo was supported by a grant “FPU” (FPU13/04211)
promoters. mRNA extraction on the same samples was performed to quantify gene expres-sion of these genes.
Results
H3K4me3 was enriched at the promoter of E2F1, LPL, SREBF2, SCD1, PPARG and IL6 in lean normoglycemic compared to morbid obese subjects with prediabetes. Accordingly H3K4me3 mark enrichment at E2F1, LPL, SREBF2, SCD1, PPARG and IL6 promoters was positively correlated with the BMI and the HOMA-IR. Regression analysis showed a strong relationship between the BMI with H3K4me3 at the promoter of E2F1 and LPL, and with mRNA levels of LEP and SCD. In the case of HOMA-IR, the regression analysis showed associations with H3K4me3 enrichment at the promoter of SCD1 and IL6, and with the mRNA of LEP and SCD1. Moreover H3K4me3 at the E2F1 promoter was positively associ-ated to E2F1 mRNA levels.
Conclusions
H3K4me3 enrichment in the promoter of LEP, LPL, SREBF2, SCD1, PPARG, IL6, TNF and E2F1 is directly associated with increasing BMI and metabolic deterioration. The H3k4me3 mark could be regulating E3F1 mRNA levels in adipose tissue, while no associations between the promoter enrichment of this mark and mRNA levels existed for the other genes studied.
Introduction
Obesity and related disorders have become one of the greatest health problems in developed countries. Obesity usually involves an increased risk of metabolic syndrome (MetS), insulin resistance, diabetes, cardiovascular failure, stroke and some sort of cancers [1].
Adipose tissue, which plays an important role as a lipid storage tissue, has emerged as an active tissue that can produce a multitude of signaling molecules (cytokines, adipokines, lipids, . . .) affecting whole body function and participating in the metabolic disruption observed dur-ing obesity [2]. In addition to its role in metabolic homeostasis, the endocrine-related activity of this tissue is being currently studied in the context of a large number of diseases like diabe-tes, MetS, cardiovascular disease or cancer [3,4]. Indeed, obesity is accompanied by an incre-ment in fat mass proportion, associated with adipose tissue dysfunction and increased inflammation [3,5]. Moreover, a limited lipid accumulation capacity of adipose tissue can pro-voke ectopic lipid accumulation, as muscle and liver lipid accumulation, which can result in insulin resistance, and eventually in type 2 diabetes mellitus [6].
A strong environmental component exists in obesity and related diseases. In this sense, epi-genetics has been postulated to be an important regulation landscape in this etiology as envi-ronment factors like lifestyle, smoking or diet have been proposed to modify epigenetic regulation [7]. Nevertheless, the role of adipose tissue epigenetic modifications in the etiology of obesity and metabolic disorders has been usually restricted to DNA methylation studies [8]. Adipose tissue chromatin immunoprecipitation (ChIP) for histone marks has been carried out mostly in mice, and especiallyin vitro in adipose-derived mesenchymal stem cells. Probably due to difficulties found in human adipose tissue manipulation, no studies have investigated (to our knowledge) direct histone modifications in human adipose tissue [8].
In a previous work, we developed a ChIP method to determine H3K4me3 chromatin immunoprecipitation in small pieces of frozen human adipose tissue [8]. In this study, we and a fellowship “Estancias breves FPU”,
Ministerio de Educacio´n, Cultura y Deporte co-funded by the Fondo Europeo de Desarrollo Regional-FEDER EST15/00657. Isabel Moreno-Indias was supported by a ‘‘Miguel Servet Type I’’ contract from the Instituto de Salud Carlos III (CP16/00163). Marı´a Isabel Queipo-Ortuño acknowledges support from the “Miguel Servet Type II” program (CPI18/00003). Fernando Cardona acknowledges support from the “Programa Nicolas Monarde”, Consejeria de Salud, Junta de Andalucı´a C-0032- 2016, and the Instituto de Salud Carlos III co-founded by Fondo Europeo de Desarrollo Regional - FEDER, PI11/ 02518; PI14/00082, Madrid Spain. The funders had no role in study design, data collection and analysis, decision to publish, or preparation of the manuscript.
Competing interests: The authors have declared that no competing interests exist.
Abbreviations: BMI, Body mass index; ChIP, Chromatin immunoprecipitation; E2F1, E2F transcription factor 1; ELISA, Enzyme immunoassay; H3K4me3, H3K4 trimethylation; IL6, Interleukin 6; Lean NG, Lean normoglycemicl; LEP, Leptin; LPL, Lipoprotein Lipase; MetS Var, Metabolic syndrome components; MetS, Metabolic syndrome; MO DB, Morbid Obese Diabetic; MO NG, Morbid Obese Normoglycemic; MO PD, Morbid Obese Prediabetic; PPARG, Peroxisome proliferator-activated receptor gamma; SAH, S-Adenosyl Homocystein; SAM, S-S-Adenosyl methionine; SCD1, Stearoyl-CoA desaturase 1; SREBF2, Sterol regulatory element-binding factor 2; TCA, tri-carboxylic acid cycle; TG, triglycerides; TNF, Tumor necrosis factor; VAT, visceral adipose tissue.
applied this method to analyze histone methylations in adipose tissue of a cohort of 39 patients with different metabolic profiles. We analyzed promoter H3K4me3 levels and the gene expres-sion of specific genes related to lipid metabolism, adipogenesis and inflammation, such as LEP, LPL, SREBF2, SCD1, PPARG, IL6, TNF and E2F1.
Methodology
Study population
This study was undertaken in 39 subjects, classified according to their BMI and glucose state as Lean Normoglycemic (Lean NG) (BMI<25 and glucose<100 mg/dl), Morbid Obese Nor-moglycemic (MO NG) (BMI>40 and glucose<100 mg/dl) and Morbid Obese Prediabetic (MO PD) (BMI>40 and glucose ranging �100 to <125). Study procedures included a com-prehensive physical examination and blood analysis. The metabolic parameters for the 3 groups are presented inTable 1.
Study subjects were recruited during 2012–2014 from patients that had undergone laparo-scopic surgery for elective cholecystectomy, hiatal-hernia surgery, or bariatric surgery. Exclu-sion criteria included the presence of cardiovascular disease, arthritis, acute inflammatory disease, infectious disease, renal disease or patients receiving drugs that could alter the lipid profile or MetS parameters at the time of study inclusion. Smoking habits and alcohol con-sumption were measured using a standardized questionnaire.
The study was conducted in accordance with the guidelines laid down in the Declaration of Helsinki. All participants gave their written informed consent and the study was reviewed and approved by the Ethics and Research Committee of Virgen de la Victoria Hospital.
Laboratory measurements
Serum parameters were measured following previous procedures [9]. Leptin and adiponectin were analyzed by enzyme immunoassay (ELISA) kits (DSL, Webster, TX, and DRG Diagnos-tics GmbH, Germany, respectively).
Table 1. Anthropometric and biochemical variables for each study group. Different letters mean significant differ-ences between groups (p<0.05).
Lean NG (n = 10) MO NG (n = 10) MO PD (n = 9) Age (years) 54.40±13.93 40.50±8.34 47.11±8.28 Gender (male/female) 4/6 3/7 3/6 BMI (kg/m2) 22,91±1.52a 50,70±8.78b 56.12±7.99b Waist (cm) 86.70±8.74a 134.70±20.27b 142.74±14.41b
Glucose (mg/dl) 91.10±6.04a 90,90±4.95a 111.89±4.37b
Insulin (pmol/L) 6.02±3.13a 20.26±15.61b 22.29±9.10b
HOMA-IR 1,34±0.69a 4.61±3.53b 6.14±2.48b Cholesterol (mg/dl) 226.30±56.60 183.10±48.66 190.44±25.48 HDL-C (mg/dl) 56.20±16.81a 41.20±9.37a,b 39.67±5.54b LDL-C (mg/dl) 144.46±45.19 120.84±45.76 120.16±22.17 Tg (mg/dl) 128.40±69.38 93.99±31.09 159.53±60.84 SBP (mm Hg) 129.90±25.00 135.44±30.73 141.29±15.15 DBP (mm Hg) 80.80±9.36 80.78±13.04 86.86±9.22
Body mass index (BMI); Homeostatic model assessment of insulin resistance (HOMA-IR); High-density lipoprotein cholesterol (HDL-C); Low-density lipoprotein cholesterol (LDL-C); Triglycerides (Tg); Postprandial triglycerides (Tg Post); Systolic blood pressure (SBP); Diastolic blood pressure (DBP).
Visceral adipose tissue RNA isolation
VAT was obtained during laparoscopic surgery. Biopsy samples were washed in physiological saline buffer and immediately frozen in liquid nitrogen. Biopsy samples were maintained at −80˚C until analysis.
Real-time quantitative PCR
RNA extraction and qPCR analysis was performed as described previously [9]. For the gene expression we used the following commercial assays LEP (Hs00174877_m1, RefSeq. NM_000230.2), LPL (Hs00173425_m1, RefSeq. NM_000237.2), SREBF2 (Hs01081784_m1, RefSeq. NM_004599.3), SCD1 (Hs01682761_m1, RefSeq. NM_005063.4), PPARG
(Hs01115513_m1, RefSeq. NM_005037.5, NM_015869.4, NM_138711.3, NM_138712.3), IL6 (Hs00174131_m1, RefSeq. NM_000600.4, NM_001318095.1), TNF (Hs01113624_g1, RefSeq. NM_000594.3) and E2F1 (Hs00153451_m1, RefSeq. NM_005225.2). PPIA (4326316E) was used as endogenous control.
Chromatin immunoprecipitation assay
ChiP was performed as previously described [8]. Briefly, 100 mg of frozen VAT was fixed in 0.5% formaldehyde for 5 minutes and the reaction was stopped by adding a final concentration of 0.125 mM of glycine and incubated for 5 minutes. After homogenizing the sample in cell lysis buffer the nucleus phase was pelleted and then suspended in nucleus lysis buffer [8]. Sam-ples were then sheared by sonication (Bioruptor UCD-300, Diagenode) and the chromatin concentration and chromatin fragments were checked using Nanodrop and 2% agarose gel. Then, samples were immunoprecipitated using an anti-H3K4me3 antibody (ab8580, abcam) linked to magnetic beads (Dynabeads Protein G, Thermofisher) and the DNA purified with MinElute PCR Purification Kit (Qiagen). Specific promoter H3K4me3 was performed using the primer sets depicted in [8] and the following primer set for E2F1 promoter quantification: Sense: AGGAACCGCCGCCGTTGTTCCCG, Antisense: CTGCCTGCAAAGTCCCGGC-CACTT. The normalized enrichment value was calculated as the subtraction of the IP relative value with the Input relative value. The IP and Input relative values were calculated by compar-ing the normalized enrichment values obtained from the standard curves.
Statistical analyses
Comparisons between groups were calculated using Kruskal-Wallis test for non-normal distri-bution variables, and Mann-Whitney U-test for the group-by-group comparisons. Spearman’s correlation coefficients were calculated to evaluate the association between the study variables in the whole population. The variable named “MetS variables” defined the number of MetS components present in each individual, which ranged from 0–5, as described by [10]. Values were considered to be statistically significant when P < 0.05. The analyses were performed with SPSS (Version 15.0 for Windows; SPSS).
Results and discussion
In this work, we studied for the first time the H3K4me3 histone mark at several gene promot-ers for genes associated with adipogenesis, lipid metabolism and inflammation in human adi-pose tissue. We identified histone modification (H3K4me3) in a population classified into three groups according to their BMI and glucose metabolic status: Lean NG, MO NG and MO PD. A description of the anthropometric and biochemical variables of these groups is given in
Fig 1. Group comparisons of H3K4me3 mark enrichment at the promoter of the study genes. Different letters indicate significant differences between the means of the different groups of subjects (p < 0.05; a: Lean NG vs. MO NG; b: Lean NG
Table 1. Statistical differences were observed between groups for BMI, waist circumference and the serum levels of glucose, insulin, HOMA-IR and HDL-C (Table 1).
Regarding enrichment of the H3K4me3 mark, we observed an increased enrichment at E2F1, LPL, SREBF2, SCD1, PPARG and IL6 promoters in the MO PD group compared to the Lean NG group (Fig 1). Concerning the gene expression, LPL, SCD1 and PPARG mRNA levels were lower in the MO PD group than the Lean NG group (Fig 2); whereas higher mRNA levels for IL6 and TNF genes were noted in MO PD compared to Lean NG subjects (Fig 2).
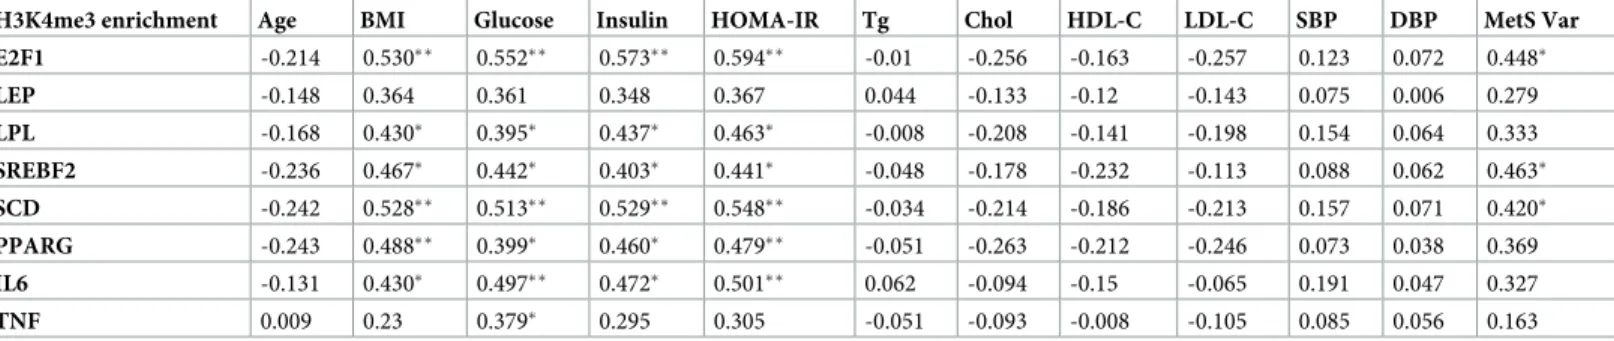
A positive correlation between the H3K4me3 mark at E2F1, LPL, SREBF2, SCD1, PPARG and IL6 promoters and the BMI and HOMA-IR was observed (Table 2andS1 Fig). Moreover, there was a positive correlation between glucose and H3K4me3 mark enrichment at the pro-moter of SCD1, PPARG, E2F1 and IL6 (Table 2andS1 Fig). The association between the H3K4me3 mark and glucose has been studied in the promoter of the inflammatory gene NFkB p65 in Set7 KD cells, where a decrease of the H3K4me3 mark associated with glucose supple-mentation was observed [11]. This is in agreement with our findings, showing a positive corre-lation between promoter H3H4me3 increase and the HOMA-IR. In addition, we also
observed a positive correlation between the H3K4me3 mark at E2F1, SREBF2 and SCD pro-moters and the number of MetS components (MetS Var) present (Table 2andS1 Fig).
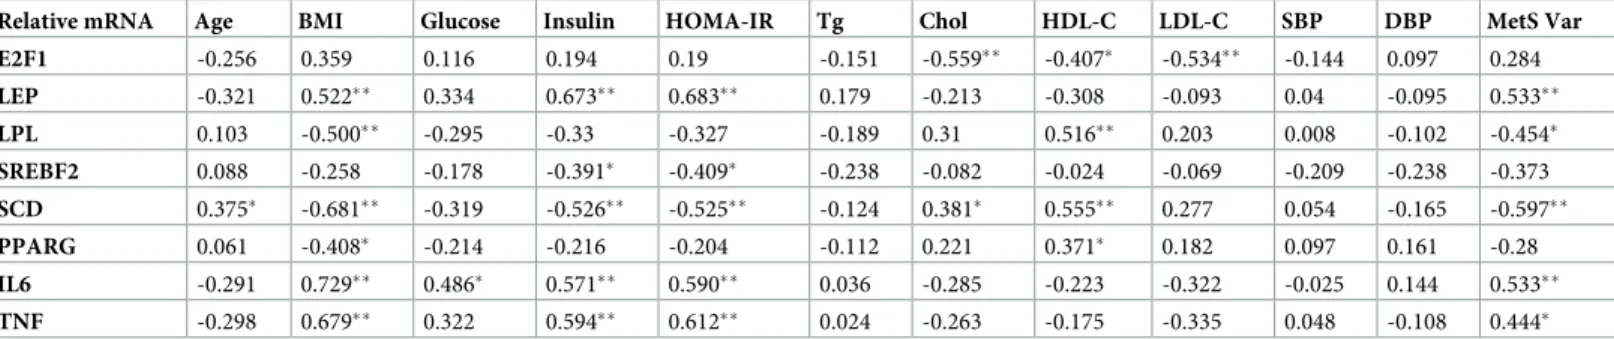
Regarding the correlation between the gene expression and clinical variables, BMI was posi-tively associated with LEP, IL6 and TNF mRNA levels while it was negaposi-tively correlated with LPL, SCD1 and PPARG mRNA (Table 3andS2 Fig). HOMA-IR correlated with LEP, IL6 and TNF mRNA positively, and negatively with SREBF2 and SCD (Table 3andS2 Fig). These results are in line with the scientific literature, since a negative association between LPL and PPARG mRNA and the BMI has been described previously [9,12]. In addition, BMI and insu-lin resistance have been associated with a low-grade inflammation in adipose tissue [13–15], which is in accordance with the positive relationship between these two parameters and the inflammatory markers measured in this work. Positive associations were described between HDL-C and LPL, SCD1 and PPARG gene expressions (Table 3andS2 Fig). Interestingly, E2F1 mRNA levels were negatively associated with all cholesterol variables, total cholesterol (Chol), HDL-C and LDL-C (Table 3). E2F1 has been shown to regulate lipid and cholesterol metabolism in the liver and to participate in cholesterol withdrawal [16,17].
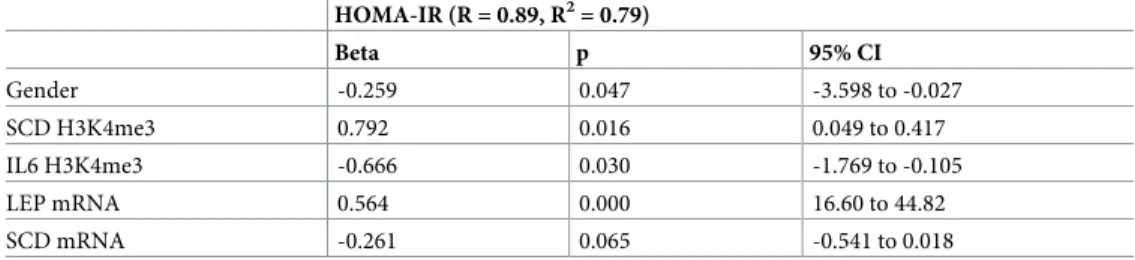
Finally, a harmonized lineal regression analysis showed that BMI was greatly explained by H3K4me3 enrichment levels at the promoter of E2F1 and LPL, and by the mRNA levels of LEP and SCD (Table 4). In this model, these four variables could explain up to 83% of the BMI variability present in our study population (Table 4). Similarly, another harmonized lineal regression analysis (with HOMA-IR as dependent variable) showed that H3K4me3 enrich-ment levels at the promoter of SCD1 and IL6, together with the mRNA levels of LEP and SCD1, could explain 79% of the variation observed in the HOMA-IR (Table 5).
The H3K4me3 level depends on the methylation and de-methylation processes, which are carried out by several methyltransferases and de-methyltransferases [7], and that in turn depend on substrate disposal [18]. S-Adenosyl methionine (SAM) is a methyl-group molecular donor for a wide range of reactions, including methylation processes and has been shown to be altered according to nutritional and cell metabolism status affecting H3K4me3 levels [19]. It has been shown that SAM levels increase with the BMI, and that this increase is associated vs. MO PD; c: MO NG vs. MO PD) according to Mann Whitney U test. Abbreviations: Lean Normoglycemic (Lean NG); Morbid obese normoglycemic (MO NG); Morbid obese prediabetic (MO PD); E2F transcription factor 1 (E2F1); Lipoprotein Lipase (LPL); Sterol regulatory element-binding factor 2 (SREBF2); Stearoyl-CoA desaturase 1 (SCD1); Peroxisome proliferator-activated receptor gamma (PPARG); Interleukin 6 (IL6); Tumor necrosis factor (TNF). https://doi.org/10.1371/journal.pone.0215083.g001
with adiposity [20]. Therefore, a possible increase in SAM associated with the BMI could explain the increase in the H3K4me3 mark found in E2F1, LPL, SREBF2, SCD1, PPARG and IL6 gene promoters of the MO PD group with respect to the Lean NG group. Moreover, in our population the differences in the H3K4me3 enrichment levels for the genes associated with BMI and HOMA-IR might be related to substrate fluctuations, even though it has been shown that sensitivity of histone methylation to methyl group availability is site-specific [18]. Accord-ingly, the fluctuation in the H3K4me3 mark observed in this study could be related with the metabolic status since energy and metabolic intermediaries have been related to histone meth-ylation, which could be in tune with adipose tissue dysfunction.
De-methylation processes can also modulate H3K4me3 mark levels. The reduction in fatty acid oxidation and glucose incorporation observed in insulin resistance states [21–23] together with the adipose tissue hypoxia in the context of metabolic diseases and insulin resistance [24] could affect H3K4me3 mark levels by down-regulating histone de-methyla-tion. In fact, hypoxia has been reported to increase H3K4me3 marks through reduction of de-methylation [18].
In order to analyze whether the promoter H3K4me3 mark levels could be related to gene expression we performed Spearman’s correlation analysis in the whole population between the mRNA levels and H3K4me3 mark at each gene. However, we did not observe any significant association between the promoter H3K4me3 levels and the mRNA levels for any gene excepting E2F1, in which a positive correlation was observed (r = 0.422, p = 0.04). H3K4me3 is a mark associated with a condition of open chromatin and consequently stimulates gene expression [25]. Thus, this positive association observed between this mark at the promoter of E2F1 and the mRNA levels for this gene suggests that this gene could be transcriptionally controlled by this epigenetic mark in adipose tissue. Adipose tissue E2F1 has been shown to be overexpressed in obesity, leading to inflammation and metabolic deterioration [26,27]. Thus, the H3K4me3 Fig 2. Group comparisons of the relative mRNA levels of the study genes. Different letters indicate significant differences between the means of the different groups of subjects (p < 0.05; a: Lean NG vs. MO NG; b: Lean NG vs. MO PD; c: MO NG vs. MO PD) according to Mann Whitney U test. Abbreviations: Lean Normoglycemic (Lean NG); Morbid obese
normoglycemic (MO NG); Morbid obese prediabetic (MO PD); E2F transcription factor 1 (E2F1); Lipoprotein Lipase (LPL); Sterol regulatory element-binding factor 2 (SREBF2); Stearoyl-CoA desaturase 1 (SCD1); Peroxisome proliferator-activated receptor gamma (PPARG); Interleukin 6 (IL6); Tumor necrosis factor (TNF).
https://doi.org/10.1371/journal.pone.0215083.g002
Table 2. Spearman correlation analysis between H3K4me3 mark enrichment at the study gene promoters and the anthropometric and biochemical variables.�and ��mean p<0.05 and p<0.01 respectively.
H3K4me3 enrichment Age BMI Glucose Insulin HOMA-IR Tg Chol HDL-C LDL-C SBP DBP MetS Var E2F1 -0.214 0.530�� 0.552�� 0.573�� 0.594�� -0.01 -0.256 -0.163 -0.257 0.123 0.072 0.448� LEP -0.148 0.364 0.361 0.348 0.367 0.044 -0.133 -0.12 -0.143 0.075 0.006 0.279 LPL -0.168 0.430� 0.395� 0.437� 0.463� -0.008 -0.208 -0.141 -0.198 0.154 0.064 0.333 SREBF2 -0.236 0.467� 0.442� 0.403� 0.441� -0.048 -0.178 -0.232 -0.113 0.088 0.062 0.463� SCD -0.242 0.528�� 0.513�� 0.529�� 0.548�� -0.034 -0.214 -0.186 -0.213 0.157 0.071 0.420� PPARG -0.243 0.488�� 0.399� 0.460� 0.479�� -0.051 -0.263 -0.212 -0.246 0.073 0.038 0.369 IL6 -0.131 0.430� 0.497�� 0.472� 0.501�� 0.062 -0.094 -0.15 -0.065 0.191 0.047 0.327 TNF 0.009 0.23 0.379� 0.295 0.305 -0.051 -0.093 -0.008 -0.105 0.085 0.056 0.163
E2F transcription factor 1 (E2F1); Leptin (LEP); Lipoprotein Lipase (LPL); Sterol regulatory element-binding factor 2 (SREBF2); Stearoyl-CoA desaturase 1 (SCD1); Peroxisome proliferator-activated receptor gamma (PPARG); Interleukin 6 (IL6); Tumor necrosis factor (TNF); Body mass index (BMI); Homeostatic model assessment of insulin resistance (HOMA-IR); Triglycerides (Tg); Total cholesterol (Chol); High-density lipoprotein cholesterol (HDL-C); Low-density lipoprotein cholesterol (LDL-C); Systolic blood pressure (SBP); Diastolic blood pressure (DBP); Number of MetS variables (MetS Var).
mark level might depend on the metabolic status of the patients, and the possible increase of this mark at E2F1 promoter could in turn be related to the worsening in the metabolic status through direct stimulation of E2F1 expression. With respect to the other genes studied, further studies will be necessary to explain their complex epigenetic regulation, for instance through the study together with other histone marks like H3K27m3 (related to heterochromatin and gene repression), the study of DNA methylation at their promoter or ChIP followed by deep sequencing (ChIPseq), which could highlight a more accurate regulatory state of the promoters [28,29]. Other authors have previously described that there are expressed genes where the mark is absent and genes with the mark that are not expressed, showing that the presence of the mark is neither necessary nor sufficient for gene expression even though genes marked with
H3K4me3 have a higher average levels of mRNA [30].
Nevertheless, chromosome conformation is important for the genetic regulation in adipo-cytes [31], a process that might be influenced by H3K4me3 mark modifications [32,33]. Chro-mosome deregulation has been widely associated with several diseases, some associated with H3K4me3 methylases or H3K4me3 modifier deregulation [7]. In fact, abnormal H3K4me3 marks in brain tissue have been observed in the context of Huntington’s disease without the existence of a correlation between the difference in H3K4me3 peaks observed with their asso-ciated gene expression [34], similar to our results in VAT. In this sense, histone modifications Table 3. Spearman correlation analysis between the relative mRNA levels at the study genes and the anthropometric and biochemical variables. �and��mean
p<0.05 and p<0.01 respectively.
Relative mRNA Age BMI Glucose Insulin HOMA-IR Tg Chol HDL-C LDL-C SBP DBP MetS Var
E2F1 -0.256 0.359 0.116 0.194 0.19 -0.151 -0.559�� -0.407� -0.534�� -0.144 0.097 0.284 LEP -0.321 0.522�� 0.334 0.673�� 0.683�� 0.179 -0.213 -0.308 -0.093 0.04 -0.095 0.533�� LPL 0.103 -0.500�� -0.295 -0.33 -0.327 -0.189 0.31 0.516�� 0.203 0.008 -0.102 -0.454� SREBF2 0.088 -0.258 -0.178 -0.391� -0.409� -0.238 -0.082 -0.024 -0.069 -0.209 -0.238 -0.373 SCD 0.375� -0.681�� -0.319 -0.526�� -0.525�� -0.124 0.381� 0.555�� 0.277 0.054 -0.165 -0.597� � PPARG 0.061 -0.408� -0.214 -0.216 -0.204 -0.112 0.221 0.371� 0.182 0.097 0.161 -0.28 IL6 -0.291 0.729�� 0.486� 0.571�� 0.590�� 0.036 -0.285 -0.223 -0.322 -0.025 0.144 0.533�� TNF -0.298 0.679�� 0.322 0.594�� 0.612�� 0.024 -0.263 -0.175 -0.335 0.048 -0.108 0.444�
E2F transcription factor 1 (E2F1); Leptin (LEP); Lipoprotein Lipase (LPL); Sterol regulatory element-binding factor 2 (SREBF2); Stearoyl-CoA desaturase 1 (SCD1); Peroxisome proliferator-activated receptor gamma (PPARG); Interleukin 6 (IL6); Tumor necrosis factor (TNF); Body mass index (BMI); Homeostatic model assessment of insulin resistance (HOMA-IR); Triglycerides (Tg); Total cholesterol (Chol); High-density lipoprotein cholesterol (HDL-C); Low-density lipoprotein cholesterol (LDL-C); Systolic blood pressure (SBP); Diastolic blood pressure (DBP); Number of MetS variables (MetS Var).
https://doi.org/10.1371/journal.pone.0215083.t003
Table 4. Harmonized lineal regression analysis with BMI as dependent variable. H3K4me3 mark enrichment at gene promoters and gene expression of genes that showed significant association in the Spearman correlation analysis were introduced in the model, which was corrected for age and sex.
BMI (R = 0.91, R2= 0.83) Beta p 95% CI E2F1 H3K4me3 0.979 0.001 0.844 to 2.922 LPL H3K4me3 -0.813 0.003 -3.640 to -0.840 LEP mRNA 0.344 0.002 38.32 to 152.97 SCD mRNA -0.516 0.000 -3.650 to -1.459
Body mass index (BMI); E2F transcription factor 1 (E2F1); Lipoprotein Lipase (LPL); Leptin (LEP); Stearoyl-CoA desaturase 1 (SCD1).
could not only be important for gene expression regulation but also for chromosome stability, DNA replication or chromosome segregation [35].
However, the cross-sectional nature of our study represents a limitation and more studies using ChiP-seq, metabolomic approaches and animal models are necessary to establish the role of the H3K4me3 mark in VAT and how the metabolic status could be affecting H3K4me3 (and other histone marks) levels.
As strengths, in this work we study for the first time H3k4me3 after ChIP in human adipose tissue, a metabolic tissue in which histone characterization is yet to be performed due to its lipid nature which hinders downstream manipulation [8].
In conclusion, we applied for the first time the adipose tissue ChIP protocol to determine the histone H3K4 trimethylation modification at the promoter of several adipogenic, lipid metabolism and inflammatory genes in human VAT in a population with different degrees of BMI and glucose metabolism. We found an increase in the H3K4me3 mark at E2F1, LPL, SREBF2, SCD1, PPARγ and IL6 promoters as the BMI and HOMA-IR increased. Moreover, enrichment at these promoters was positively associated with BMI, HOMA-IR and MetS wors-ening. Interestingly, E2F1 mRNA expression and the H3K4me3 mark level correlated posi-tively, suggesting a transcriptional control of this gene by this histone modification in VAT, contributing to VAT inflammation and deterioration in obesity and metabolic diseases. Thus, this work points out the importance of epigenetics in discerning complex metabolic diseases and obesity, and gives clues to a more comprehensive and in depth analysis about the possible role of adipose tissue histone code within the context of these disorders, which could lead to possible epigenetic therapies.
Supporting information
S1 Fig. Scatterplot showing the significant associations between H3K4me3 enrichment at the study genes and the metabolic parameters.
(DOCX)
S2 Fig. Scatterplot showing the significant associations between mRNA levels at the study genes and the metabolic parameters.
(DOCX)
Acknowledgments
The research group belongs to the “Centros de Investigacio´n en Red” [CIBER, CB06/03/0018] of the “Instituto de Salud Carlos III
Table 5. Harmonized lineal regression analysis with HOMA-IR as dependent variable. H3K4me3 mark enrich-ment at gene promoters and gene expression of genes that showed significant association in the Spearman correlation analysis were introduced in the model, which was corrected for age and sex.
HOMA-IR (R = 0.89, R2= 0.79) Beta p 95% CI Gender -0.259 0.047 -3.598 to -0.027 SCD H3K4me3 0.792 0.016 0.049 to 0.417 IL6 H3K4me3 -0.666 0.030 -1.769 to -0.105 LEP mRNA 0.564 0.000 16.60 to 44.82 SCD mRNA -0.261 0.065 -0.541 to 0.018
Homeostatic model assessment of insulin resistance (HOMA-IR); Stearoyl-CoA desaturase 1 (SCD1); Interleukin 6 (IL6); Leptin (LEP).
Author Contributions
Conceptualization: Fernando Cardona.
Data curation: Isabel Moreno-Indias, Francisco Tinahones. Formal analysis: Daniel Castellano-Castillo.
Funding acquisition: Fernando Cardona.
Methodology: Daniel Castellano-Castillo, Pierre-Damien Denechaud, Wilfredo Oliva-Olivera. Project administration: Fernando Cardona.
Resources: Lluis Fajas, Fernando Cardona.
Supervision: Isabel Moreno-Indias, Marı´a Isabel Queipo-Ortuño, Fernando Cardona.
Validation: Pierre-Damien Denechaud, Francisco Tinahones. Visualization: Lluis Fajas.
Writing – original draft: Daniel Castellano-Castillo.
Writing – review & editing: Pierre-Damien Denechaud, Isabel Moreno-Indias, Marı´a Isabel
Queipo-Ortuño.
References
1. Pi-sunyer X, Pi-sunyer X. The Medical Risks of Obesity. Postgrad Med. 2009; 121: 21–33.https://doi. org/10.3810/pgm.2009.11.2074PMID:19940414
2. Musi N, Guardado-Mendoza R. Adipose Tissue as an Endocrine Organ. Cell Endocrinol Heal Dis. 2014; 89: 229–237.https://doi.org/10.1016/B978-0-12-408134-5.00014–7
3. Hajer GR, Van Haeften TW, Visseren FLJ. Adipose tissue dysfunction in obesity, diabetes, and vascular diseases. Eur Heart J. 2008; 29: 2959–2971.https://doi.org/10.1093/eurheartj/ehn387PMID:
18775919
4. Divella R, De Luca R, Abbate I, Naglieri E, Daniele A. Obesity and cancer: The role of adipose tissue and adipo-cytokines-induced chronic inflammation. J Cancer. 2016; 7: 2346–2359.https://doi.org/10. 7150/jca.16884PMID:27994674
5. Blu¨her M. Adipose tissue dysfunction in obesity. Exp Clin Endocrinol Diabetes. 2009; 117: 241–250.
https://doi.org/10.1055/s-0029-1192044PMID:19358089
6. Bore´n J, Taskinen MR, Olofsson SO, Levin M. Ectopic lipid storage and insulin resistance: A harmful relationship. J Intern Med. 2013; 274: 25–40.https://doi.org/10.1111/joim.12071PMID:23551521
7. Mirabella AC, Foster BM, Bartke T. Chromatin deregulation in disease. Chromosoma. 2016; 125: 75– 93.https://doi.org/10.1007/s00412-015-0530-0PMID:26188466
8. Castellano-Castillo D, Denechaud P-D, Moreno-Indias I, Tinahones F, Fajas L, Queipo-Ortuño MI, et al. Chromatin immunoprecipitation improvements for the processing of small frozen pieces of adipose tis-sue. PLoS One. 2018; 13: e0192314.https://doi.org/10.1371/journal.pone.0192314PMID:29444131
9. Clemente-Postigo M, Queipo-Ortuño MI, Fernandez-Garcia D, Gomez-Huelgas R, Tinahones FJ, Car-dona F. Adipose tissue gene expression of factors related to lipid processing in obesity. PLoS One. 2011; 6: e24783.https://doi.org/10.1371/journal.pone.0024783PMID:21966368
10. Alberti KGMM, Eckel RH, Grundy SM, Zimmet PZ, Cleeman JI, Donato KA, et al. Harmonizing the Met-abolic Syndrome: A Joint Interim Statement of the International Diabetes Federation Task Force on Epi-demiology and Prevention; National Heart, Lung, and Blood Institute; American Heart Association; World Heart Federation; International. Circulation. 2009; 120: 1640–1645.https://doi.org/10.1161/ CIRCULATIONAHA.109.192644PMID:19805654
11. Brasacchio D, Okabe J, Tikellis C, Balcerczyk A, George P, Baker EK, et al. Hyperglycemia Induces a Dynamic Cooperativity of. 2009; 58: 1229–1236.https://doi.org/10.2337/db08-1666PMID:19208907
12. Motawi TK, Shaker OG, Ismail MF, Sayed NH. Peroxisome Proliferator-Activated Receptor Gamma in Obesity and Colorectal Cancer: The Role of Epigenetics. Sci Rep. Springer US; 2017; 7: 1–8.https:// doi.org/10.1038/s41598-016-0028-x
13. Lesna IK, Cejkova S, Kralova A, Fronek J, Petras M, Sekerkova A, et al. Human adipose tissue accu-mulation is associated with pro-inflammatory changes in subcutaneous rather than visceral adipose tis-sue. Nutr Diabetes. Nature Publishing Group; 2017; 7: e264–4.https://doi.org/10.1038/nutd.2017.15
PMID:28394364
14. Shimobayashi M, Albert V, Woelnerhanssen B, Frei IC, Weissenberger D, Meyer-Gerspach AC, et al. Insulin resistance causes inflammation in adipose tissue. J Clin Invest. 2018; 128: 1538–1550.https:// doi.org/10.1172/JCI96139PMID:29528335
15. Lawler HM, Underkofler CM, Kern PA, Erickson C, Bredbeck B, Rasouli N. Adipose tissue hypoxia, inflammation, and fibrosis in obese insulin-sensitive and obese insulin-resistant subjects. J Clin Endocri-nol Metab. 2016; 101: 1422–1428.https://doi.org/10.1210/jc.2015-4125PMID:26871994
16. Denechaud P, Lopez-mejia IC, Giralt A, Lai Q, Blanchet E, Delacuisine B, et al. E2F1 mediates sus-tained lipogenesis and contributes to hepatic steatosis. 2016; 126: 137–150.https://doi.org/10.1172/ JCI81542DS1
17. Lai Q, Giralt A, Le May C, Zhang L, Cariou B, Denechaud P-D, et al. E2F1 inhibits circulating cholesterol clearance by regulating Pcsk9 expression in the liver. JCI insight. 2017; 2: 1–16.https://doi.org/10. 1172/jci.insight.89729PMID:28515357
18. Fan J, Krautkramer KA, Feldman JL, Denu JM, States U. Metabolic regulation of histone post-transla-tional modifications. ACS Chem Biol. 2016; 10: 95–108.https://doi.org/10.1021/cb500846u.Metabolic
19. Detich N, Hamm S, Just G, Knox JD, Szyf M. The methyl donor S-Adenosylmethionine inhibits active demethylation of DNA. A candidate novel mechanism for the pharmacological effects of S-Adenosyl-methionine. J Biol Chem. 2003; 278: 20812–20820.https://doi.org/10.1074/jbc.M211813200PMID:
12676953
20. Elshorbagy AK, Jernere´n F, Samocha-Bonet D, Refsum H, Heilbronn LK. Serum S-adenosylmethio-nine, but not methioS-adenosylmethio-nine, increases in response to overfeeding in humans. Nutr Diabetes. 2016; 6: 2–5.
https://doi.org/10.1038/nutd.2015.44PMID:26807510
21. Oh W, Abu-Elheiga L, Kordari P, Gu Z, Shaikenov T, Chirala SS, et al. Glucose and fat metabolism in adipose tissue of acetyl-CoA carboxylase 2 knockout mice. Proc Natl Acad Sci U S A. 2005; 102: 1384– 9.https://doi.org/10.1073/pnas.0409451102PMID:15677334
22. Torchon E, Hulver M, McMillan R, Voy B. Fasting rapidly increases fatty acid oxidation in white adipose tissue (269.2). Faseb J. Taylor & Francis; 2014; 28: 269.2-.https://doi.org/10.1080/21623945.2016. 1263777PMID:28452587
23. Kusminski CM, Scherer PE. Mitochondrial dysfunction in white adipose tissue. Trends Endocrinol Metab. Elsevier Ltd; 2012; 23: 435–443.https://doi.org/10.1016/j.tem.2012.06.004PMID:22784416
24. Oliva-Olivera W, Moreno-Indias I, Coin-Araguez L, Lhamyani S, Alcaide Torres J, Fernandez-Veledo S, et al. Different response to hypoxia of adipose-derived multipotent cells from obese subjects with and without metabolic syndrome. PLoS One. 2017; 12: e0188324.https://doi.org/10.1371/journal.pone. 0188324PMID:29166648
25. Pekowska A, Benoukraf T, Zacarias-Cabeza J, Belhocine M, Koch F, Holota H, et al. H3K4 tri-methyla-tion provides an epigenetic signature of active enhancers. EMBO J. 2011; 30: 4198–4210.https://doi. org/10.1038/emboj.2011.295PMID:21847099
26. Denechaud PD, Fajas L, Giralt A. E2F1, a novel regulator of metabolism. Front Endocrinol (Lausanne). 2017; 8: 1–8.https://doi.org/10.3389/fendo.2017.00311PMID:29176962
27. Haim Y, Blu¨uher M, Slutsky N, Goldstein N, Klo¨ting N, Harman-Boehm I, et al. Elevated autophagy gene expression in adipose tissue of obese humans: A potential non-cell-cycle-dependent function of E2F1. Autophagy. 2015; 11: 2074–2088.https://doi.org/10.1080/15548627.2015.1094597PMID:
26391754
28. Dong X, Weng Z. The correlation between histone modifications and gene expression. Epigenomics. 2013; 5: 113–116.https://doi.org/10.2217/epi.13.13PMID:23566087
29. Barski A, Cuddapah S, Cui K, Roh TY, Schones DE, Wang Z, et al. High-Resolution Profiling of Histone Methylations in the Human Genome. Cell. 2007; 129: 823–837.https://doi.org/10.1016/j.cell.2007.05. 009PMID:17512414
30. Dai Z, Mentch SJ, Gao X, Nichenametla SN, Locasale JW. Methionine metabolism influences genomic architecture and gene expression through H3K4me3 peak width Ziwei. Nat Commun. Springer US; 2018; 9: 1955.https://doi.org/10.1038/s41467-018-04426-yPMID:29769529
31. Pan DZ, Garske KM, Alvarez M, Bhagat Y V., Boocock J, Nikkola E, et al. Integration of human adipo-cyte chromosomal interactions with adipose gene expression prioritizes obesity-related genes from GWAS. Nat Commun. Springer US; 2018; 9: 1512.https://doi.org/10.1038/s41467-018-03554-9PMID:
32. Jia R, Chai P, Zhang H, Fan X. Novel insights into chromosomal conformations in cancer. Mol Cancer. Molecular Cancer; 2017; 16: 1–13.https://doi.org/10.1186/s12943-016-0568-5
33. Klocko AD, Ormsby T, Galazka JM, Leggett NA, Uesaka M, Honda S, et al. Normal chromosome con-formation depends on subtelomeric facultative heterochromatin in Neurospora crassa. Proc Natl Acad Sci. 2016; 113: 15048–15053.https://doi.org/10.1073/pnas.1615546113PMID:27856763
34. Dong X, Tsuji J, Labadorf A, Roussos P, Chen JF, Myers RH, et al. The role of H3K4me3 in transcrip-tional regulation is altered in Huntington’s disease. PLoS One. 2015; 10: 1–23.https://doi.org/10.1371/ journal.pone.0144398PMID:26636336
35. Shin H-J, Baek K-H, Jeon A-H, Kim S-J, Jang K-L, Sung Y-C, et al. Inhibition of histone deacetylase activity increases chromosomal instability by the aberrant regulation of mitotic checkpoint activation. Oncogene. 2003; 22: 3853–3858.https://doi.org/10.1038/sj.onc.1206502PMID:12813458