Full Terms & Conditions of access and use can be found at
http://www.tandfonline.com/action/journalInformation?journalCode=yacb20
Download by: [109.88.253.65] Date: 05 December 2017, At: 22:17
Acta Clinica Belgica
International Journal of Clinical and Laboratory Medicine
ISSN: 1784-3286 (Print) 2295-3337 (Online) Journal homepage: http://www.tandfonline.com/loi/yacb20
Quantifying emergency department crowding:
comparison between two scores
Jérôme Jobé, Anne-Françoise Donneau, Béatrice Scholtes & Alexandre
Ghuysen
To cite this article: Jérôme Jobé, Anne-Françoise Donneau, Béatrice Scholtes & Alexandre Ghuysen (2017): Quantifying emergency department crowding: comparison between two scores, Acta Clinica Belgica, DOI: 10.1080/17843286.2017.1410605
To link to this article: https://doi.org/10.1080/17843286.2017.1410605
Published online: 05 Dec 2017.
Submit your article to this journal
View related articles
KEYWORDS
emergency department management; crowding; occupancy rate
© Acta clinica Belgica 2017
CONTACT Jérôme Jobé [email protected]
ORIGINAL PAPER
Quantifying emergency department crowding: comparison between two
scores
Jérôme Jobéa, Anne-Françoise Donneaub, Béatrice Scholtesc and Alexandre Ghuysena
aemergency Department, University Hospital of liege, liege, Belgium; bService of Biostatistics, Department of Public Health, University of liege, liege, Belgium; cDepartment of Public Health, University of liège, liege, Belgium
ABSTRACT
Introduction: Emergency department (ED) crowding is a major international concern with a
negative impact on both patient care and providers. Currently, there is no consensus regarding measure of crowding. Therefore, emergency physicians have to choose between numerous scoring systems, from simple to more complex. The aim of the present study was to compare the complex National Emergency Department Overcrowding Scale (NEDOCS) with the simple ED Occupancy rate (OR) determination. We further evaluated the correlation between these scores and a qualitative assessment of crowding.
Method: This study was conducted in two academic and one regional hospital in Liege Province,
in Belgium; each accounting for an ED census of over 40,000 patient visits per year. Crowding measures were sampled four times a day, over a two-week period, in January 2016.
Results: ED staff considered overcrowding as a major concern in the three ED. Median OR
ranged from 68 to 100, while NEDOCS ranged from 64.5 to 76.3. A significant correlation was found in each ED between the OR and the NEDOCS (Pearson r = 0.973, 0.974 and 0.972), as well as between the OR, the NEDOCS and the subjective evaluation by the ED staff (p = 0.001).
Conclusion: Crowding evaluation in ED requires validated scores. Our study in three different
hospitals demonstrates that simple OR appeared as accurate as more sophisticated NEDOCS. Furthermore, this measure is perfectly correlated with the feeling of ED staff.
1. Introduction
Emergency department (ED) crowding appears when the need for emergency services exceeds the resources. ED crowding has become an international concern with negative impact on patients and providers [1,2]. The impact of adaptative strategies and potential solutions has been difficult to measure due to the absence of an optimal definition or measurement and lack of consen-sus for a universal metric of crowding [3].
Historically, crowding was estimated by the fre-quency of ambulance diversion or an evaluation of the number of patients leaving without being seen (LWBS). However, such measures were not very reliable because criteria triggering ambulance diversion may vary between ED.
Consequently, numerous quantitative measures have been developed [4–11] but, in practice, their use has been limited by the requirement to gather large amounts of data [3].
Quantifying hospital crowding is measured by the hospital occupancy rate, the ratio between the total number of inpatients in the hospital and the total num-ber of hospital beds during a given period. McCarthy
et al. proposed a similar measure of ED occupancy rate (OR). The simple OR is the ratio of the total number of patients in ED to the total number of ED treatment beds [12].
Interestingly, previous work evaluating crowding measures revealed that the complex quantitative meas-ures shared high discriminatory power for predicting current ambulance diversion status, but none performed better than the simple OR. In the absence of a criteri-on-standard measurement of ED crowding, scales have also been evaluated by their ability to match ED clini-cians’ perception of crowding. In that perspective, most crowding scales lack scalability and do not perform as designed. However, in that perspective NEDOCS revealed the highest predictive power for instances of perceived ED crowding in comparison with READI, EDWIN and EDCS [13].
Such multidimensional scales work usually well in EDs where they were derived but commonly fail in the difficult challenge of capturing ED-specific variation across and within multiples EDs [3].
Moreover, global crowding measure may mask much of the variation in crowding that occurs within a 24-h period. In that perspective, a simple and parsimonious
2 J. JOBÉ ET AL.
score may be most adapted for real-time ED crowding monitoring.
These results reinforce the need for further evalua-tion of OR in various settings, with various crowding instruments and criteria, to determine if this simple score could ultimately measure ED crowding as reliably and validly as more sophisticated scores.
Therefore, the aim of this study is to conduct a compar-ative evaluation of OR and NEDOCS to measure crowd-ing. More specifically, we intended to determine their respective validity in comparison with the perception emergency providers in three different hospital facilities.
2. Methods
2.1. Study design and setting
This was a prospective study designed to assess the rela-tive interest of NEDOCS and OR to evaluate ED crowd-ing in different types of Belgian hospitals. The ethics committee of the University Hospital of Liege approved the study. This study was conducted in two facilities (CHUST and CHUNDB) of an academic hospital, the University Hospital of Liège and in a regional Hospital, the Centre Hospitalier Peltzer-La Tourelle (CHPLT) in Verviers. At the time of the study, the number of beds with hospital agreement was 426 in CHPLT, 263 in CHUNDB and 622 in CHUST. ED census in CHUST and CHUNDB is around 40,000 ED patients per year, while CHPLT receives annually 35,000 patients. CHUST is a tertiary care ED located in the suburban area of Liege, while CHUNDB and CHPLT are located in more urban zones and are secondary care hospitals.
The study was conducted in two phases. During the first, a qualitative retrospective assessment of overcrowd-ing was made through a specific form completed by staff members investigating their perception of crowding related to the past 3 months.
The second period was dedicated to a prospective sampling of data required to fulfil OR and NEDOCS in real time. In addition, a survey of the attending nurse on their actual perception of ED crowding level was made at corresponding sampling instances.
2.2. Data collection
2.2.1. Retrospective assessment, site sampling form
Staff members of the three hospitals received a detailed form at the beginning of January 2016, in order to eval-uate their feelings concerning overcrowding in their ED over the previous six months. Completion was on a vol-untary basis and staff were blinded to OR and NEDOCS score. Investigators developed the form on the basis of previous work, using multiple choices questions. Results were gathered at the end of February 2016.
2.2.2. Prospective assessment
Data required to calculate the scores were collected between 27 February and 11 March 2016. Measures were
made simultaneously in the three EDs, at 5–11 am–5 and 11 pm during two weeks for feasibility reason. Most of the data were collected though the department’s elec-tronic patient tracking system and investigators created a checklist to help the staff to collect the required data.
At corresponding sampling instances, the attending nurse in charge was surveyed to assess the perceived level of ED crowding, based on a simplified four-scale system: not busy at all (one point), steadily and easily keeping up (two points), busy (three points), over-crowded (four points).
2.2.2.1. NEDOCS model. NEDOCS was calculated
using the following formula:
Pbed = the number of patients in licensed beds and over-flow location, such as hallway beds or chairs, Bt = the number of licensed treatment beds, Padmit = the number of admitted patients, Bh = the number of hospital beds,
Wtime = the waiting time for the last patient put into bed, Atime = the longest time since registration among boarding patients and Rn = the number of respirators in use in the ED or the number of trauma beds. These items entered into the algorithm yielded a score between 1 and 200, with less than 100 considered not overcrowded and more than or equal to 100 considered overcrowded.
2.2.2.2. ED occupancy rate model. ED OR is the ratio of the total number of patients in ED to the total number of ED treatment beds:
Pbed is the number of patients in licensed bed and over-flow locations and Bt the number of licensed treatment beds.
OR over 100% identifies situations associated with exceeded ED capacity.
2.3. Statistics
Results were expressed as means and standard deviations for normally distributed data and as medians and inter-quartile range for skewed distributed data. Qualitative variables were summarized using counts and percent-ages. Quantitative variables were compared between the three EDs by an analysis of variance (ANOVA) followed by the application of a multiple comparison test or non-parametric Kruskal–Wallis. Chi-squared or Fisher exact tests were performed to compare qualitative variables between different EDs. Correlation coefficients (classical Pearson or non-parametric Spearman) were calculated to measure the association between two quan-titative variables.
NEDOCS =(Pbed∕Bt) × 85.8 + (Padmit∕Bh) × 600 + Wtime× 5.64 + Atime× 0.93
+ Rn× 13.4 − 20
Occupancy rate(OR) = 100 × Pbed∕Bt
The agreement between the crowding classification derived under NEDOCS and OR approaches was eval-uated in each ED using the Kappa Cohen coefficient and corresponding interval.
All results were considered to be significant at the 5% critical level (p < 0.05). Data analysis was carried out using SAS (Version 9.4 for Windows) statistical package.
3. Results 3.1. ED staff data
During the study period, the number of ED licensed treatment beds in CHPLT was 15, 25 in CHU NDB and 28 in CHUST. Thirty-nine nurses and 15 physicians in CHUST, 43 nurses and 17 physicians in CHUNDB, 32 nurses and 12 physicians in CHPLT composed staffs.
3.2. Retrospective ED crowding perception
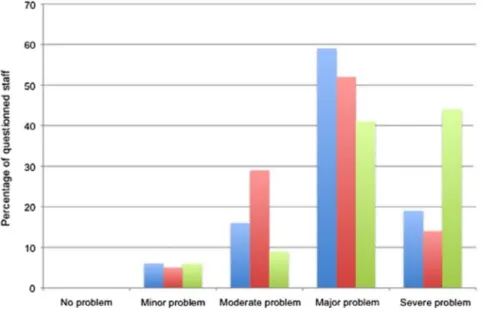
Seventy-one percentage of nurses and 63.6% of physi-cians completed the form. Mean age was 37 (35–40) years and 62.6% of nurses were women. Most members of staffs perceived crowding as a major, and sometimes severe, problem. This perception was correlated to seniority only in CHUST (CHPLT: r = 0.18 (p = 0.33); CHUNDB:
r = 0.48 (p = 0.001) and CHUST: r = 0.31 (p = 0.073)).
Crowding occurrence was reported weekly in CHUNDB and CHPLT, and every day in CHUST. ED staff from three institutions reported patients waiting in the ward for in-hospital bed admission daily. LWBS were reported once a week at least in CHUST and CHPLT and several times a week in CHUNDB. Full waiting rooms were described every day in CHUST and CHPLT, and several days a week in CHUNDB. This situation was correlated to LWBS patients in CHUST. Saturated short stay units were reported daily in CHUST and several times a week in CHUNDB and CHPLT. Patients staying
for more than 24 h in these units were also reported daily in CHUST and several times a week in CHPLT and once a week in CHUNDB (Figure 1).
3.3. Prospective crowding data
During the study period, 147 sampling instances were completed: 53 in CHPLT, 52 in CHUNDB and 41 in CHUST.
3.3.1. Perceived ED crowding
Global nurses perception of crowding ranged from 2.11 ± 0.81 in CHPLT, to 2.44 ± 0.85 in CHUNDB and 2.58 ± 0.98 in CHUST (p = 0.03). Nurses reported overcrowding in 3.7% of sample times in CHPLT, 11.5% in CHUNDB and 19.5% in CHUST. ED was reported as busy in 15% of samples times in CHPLT, 32.6% in CHUNDNB and 33.3% in CHUST.
3.3.2. NEDOCS
Median NEDOCS (First and third quartile) dur-ing the study period was 64.5 (32.0–91.3) in CHPLT, 53.4 (18.3–95.0) in CHUNDB and 76.3 (45.2–99.3) in CHUST (p = 0.062). Indeed, mean number of patients in licensed beds and overflow location was 12 ± 7 in CHUPLT, 18 ± 9 in CHUNDB and 28 ± 11 in CHUST (p < 0.0001).
Analysis of parameters used to complete the score revealed that the mean waiting time for the last patient put into a bed was 11.7 (3.00–45.0) minutes in CHPLT, 15.0 (1.80–42.6) minutes in CHUNDB, 19.8 (4.80–37.2) minutes in CHST (p = 0.45). The longest time since registration among boarding patients was 159.0 (60.0– 240.0) minutes in CHPLT, 147.3 (81.6–312.3) minutes in CHUNDB and 390.0 (250.2–480.0) minutes in CHUST (p < 0.0001). The mean number of respirators in use in ED was 2 ± 2 in CHPLT, 4 ± 4 in CHUNDB and 3 ± 3 in CHUST (p = 0.038).
Figure 1. Retrospective eD crowding perception.
4 J. JOBÉ ET AL.
(CHPLT: rs = 0.98, CHUNDB, rs = 0.97 and CHUST,
rs = 0.98).
3.4. Crowding scores and ED crowding perception 3.4.1. Retrospectively
Logistical regression analysis indicated a significant cor-relation between the level of NEDOCS and the percep-tion of crowding by staff members in CHPLT (p = 0.001, coefficient B = 0.804), CHUNDB (p = 0.001; B = 0.567) and CHUST (p = 0.001; B = 0.709). A significant cor-relation was also found for OR in CHPLT (p = 0.001;
B = 0.751), CHUNDB (p = 0.003; B = 0.595) and CHUST
(p = 0.001; B = 0.600).
3.4.2. During sample instances
A highly significant (p < 0.0001) positive correlation was observed between NEDOCS score and actual nurse per-ceptions about crowding in different locations (CHPLT:
rs = 0.80, CHUNDB, rs = 0.57 and CHUST, rs = 0.70). The same observation holds for OR (CHPLT: rs = 0.75, CHUNDB, rs = 0.59 and CHUST, rs = 0.70).
4. Discussion
Results from this study indicate a significant correlation between the two scores, independently of the facility studied. We also found similar performance of these scores in terms of staff perception of ED crowding.
In this work, we found a significant correlation between NEDOCS and OR during the study period, in every location. The median NEDOCS score originally reported in the validation study stood at 93 (72–112) [5], while another team reported higher values of 124 ± 44 (Mean ± SD) [14]. In our three facilities, the median NEDOCS noted during the study period appeared lower, ranging from 64.5 (CHPLT) to 76.3 (CHUST), a condi-tion with lower performance levels.
Although clinician perception of ED crowding has been the least commonly used type of crowding measure, correlation between this perception and other crowding measures have been widely used in validation studies. When describing the specific situation of their ED dur-ing the past 3 months, staff members of the three facil-ities perceived crowding as a major or severe problem. Calculation of the score identified varying
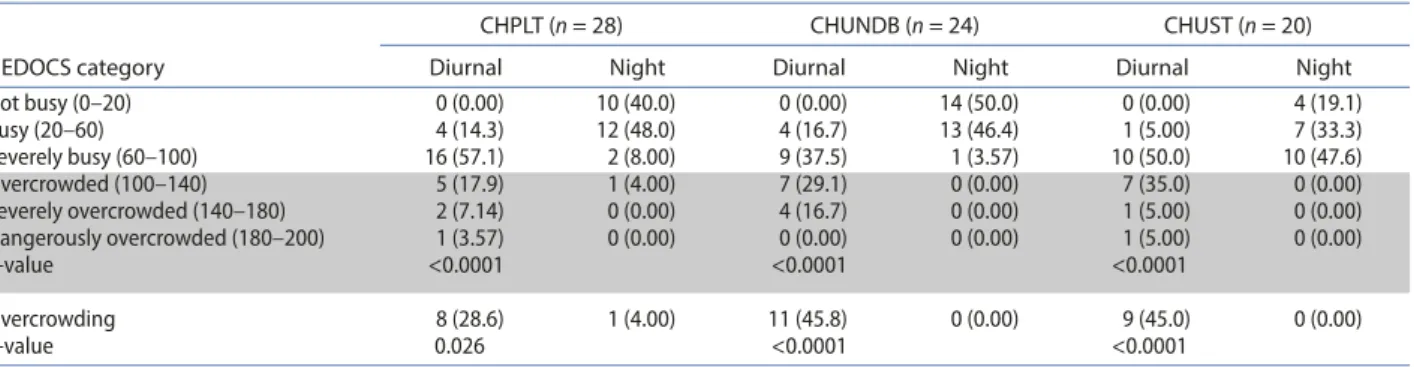
distribu-tion of the values, allowing crowding level categorizadistribu-tion (Table 1).
NEDOCS was above 100 in 17.0% of measurements in CHPLT, 21.2% in CHUNDB and 22.0% in CHUST (p = 0.81). Time varying analysis of NEDOCS indicates similar profile in the three EDs. In each, there was a sig-nificant (p < 0.05) difference between diurnal measures (11am and 5 pm) and night (11 pm and 5am).
Indeed, median diurnal NEDOCS was 84.5 (70.3– 102.8) in CHPLT, 100.1 (64.4–118.0) in CHUNDB and 99.5 (79.9–119.3) in CHUST (p = 0.28). NEDOCS was above 100 in 28.6% of measurements in CHPLT, 45.8% in CHUNDB and 45.0% in CHUST (p = 0.37).
Diurnal NEDOCS reported crowding in 28.6% of measurements in CHPLT, 45.8% in CHUNDB and 45.0% in CHUST (Table 2).
3.3.3. OR
Median OR (First and third quartile) during the study period was 73.3 (53.5–113.3) in CHPLT, 68.0 (40.0– 94.0) in CHUNDB and 100.0 (64.3–132.1) in CHUST (p = 0.0032).
OR was > 100% in 30.2% of measurements in CHPLT, 17.3% in CHUNDB and 48.8% in CHUST (p = 0.005). Median diurnal OR was 103.3 (86.7–120.0) in CHPLT, 96.0 (74.0–124.0) in CHUNDB and 132.1 (105.4–144.6) in CHUST (p = 0.010). Diurnal OR was < 100% in 50% of measurements in CHPLT, 37.5% in CHUNDB and 80% in CHUST (p = 0.016). Time varying analysis of OR indicates similar profile in the three EDs (Figure 2).
3.3.4. Correlation between NEDOCS and OR
Highly significant (p < 0.0001) positive correlation was observed between the two scores in different locations
Table 1. Overall distribution of the neDOcS score according to categorization.
Table 2. Diurnal and night distribution of the neDOcS score in each eD according to categorization.
length of stay (LOS). Indeed, patient flow in ED tends to increase with crowding, resulting in patients who can-not be admitted into treatment areas and are therefore placed in corridors, stigmatizing overcrowding and its corridors of shame [16]. In this study, the most crowded facility (CHUST) had the highest number of patients in licensed beds and overflow location and the longest mean patient LOS, 6 h on average a time delay largely exceeding the 3 to 4 h targeted by the British government as quality index.
Concerning output measures, the longest mean wait-ing time for the last patients to be put into a hospital bed and the longest stay in ED short stay unit pointed again to the CHUST as the facility, the most impacted by crowding.
Assessing crowding in ED remains very challenging. Indeed, apart from the global perception of staff mem-bers, necessarily subjective and reflecting the global and usual situation of the department, day-to-day, minute by minute situation and its permanent, apparently chaotic, fluctuation makes its approach difficult.
Time analysis of scores indicated similar profile in the three EDs and confirmed that crowding was mainly a diurnal phenomenon, sometimes extending to the evening, but rarely at night (Figure 2). However, though ED occupancy or demand may appear chaotic they are accurately forecastable. Indeed, time series analysis has been shown to provide useful, readily available tools for predicting emergency department workload that can be used to plan staff roster and resource. For that purpose, however, real-time data acquisition requires simple and easy to obtain measures such as OR.
This study did not intend to explore specifically the causes or consequences of OR in EDs studied. Indeed, we limited the evaluation of consequences of crowd-ing to data potentially revealcrowd-ing crowdcrowd-ing issues and it would have been interesting to explore this aspect more deeply. For technical reasons, data sampling occurred in We found a significant correlation, across all facilities,
between the level of crowding perceived retrospectively or in real time by ED staff and NEDOCS score levels measured at that moment.
Our results with the NEDOCS score are consistent with previous studies, notably those originally reported, demonstrating a high predictive power of perceived ED crowding with NEDOCS [5]. However, generali-zation of this performance across diverse ED settings has sometimes revealed some weakness and discrepan-cies. Indeed, an Australian team found no significant relationship between NEDOCS and subjective scores due to unreplicable patient flow or staff profiles [15]. Interestingly, in our study, the fit between the estima-tion of OR and ED crowding staff percepestima-tion shared the same performance as NEDOCS. Of note, nurses also perceived the highest LWBS patients occurrence in the facility with the highest OR and NEDOCS levels. However, we have to recognize that it was not a measure but was rather an ‘impression’ of the staff.
The most commonly described input measure reported previously is numerical counts or percentage of patients as they arrived to ED. The interest of facilities involved in the present work, was to share approximatively the same numerical ED census, but to have very different settings. Such constraints might account for qualitative discrepancies in terms of severity of illness notably, with a tertiary university hospital involved in complex and multi-morbid admissions and secondary urban and sub-urban facilities dealing with more ambulatory and fast track cases. We postulated that these differences would account for some variation in terms of crowding. Indeed, sub-analysis of NEDOCS data supports this idea, with a longest time since registration among boarding patients are significantly longer in CHUST.
In terms of ED crowding throughput measures, sev-eral indicators have been reported, from ED capacity measures to ED patient numerical counts or timing, ED
Figure 2. OR week profile for the three eDs.
6 J. JOBÉ ET AL.
[4] Bernstein SL, Verghese V, Leung W, et al. Development and validation of a new index to measure emergency department crowding. Acad Emerg Med. 2003;10:938– 942.
[5] Weiss SJ, Ernst AA, Nick TG. Comparison of the national emergency department overcrowding scale and emergency department work index for quantifying emergency department crowding. Acad Emerg Med. 2006;13:513–518.
[6] Weiss SJ, Derlet R, Arndahl J, et al. Estimating the degree of emergency department overcrowding in academic medical centers: results of the National ED overcrowding study (NEDOCS). Acad Emerg Med. 2004;11:38–50.
[7] Weiss SJ, Ernst AA, Derlet R, et al. Relationship between the national ED overcrowding scale and the number of patients who leave without being seen in an academic ED. Am J Emerg Med. 2005;23:288–294.
[8] Asplin BR, Rhodes kV, Flottemesch TJ, et al. Is this emergency department crowded? a multicenter derivation and evaluation of an emergency department crowding scale (EDCS). Acad Emerg Med. 2004;11:484– 484.
[9] Asplin BR, Rhodes kV, Crain L, et al. Measuring emergency department crowding and hospital capacity. Acad Emerg Med. 2002;9:366-a–367.
[10] Reeder TJ, Garrison HG. When the safety net is unsafe real-time assessment of the overcrowded emergency department. Acad Emerg Med. 2001;8:1070–1074. [11] Reeder TJ, Burleson DL, Garrison HG. The overcrowded
emergency department: a comparison of staff perceptions. Acad Emerg Med. 2003;10:1059–1064. [12] McCarthy ML, Aronsky D, Jones ID, et al. The
emergency department occupancy rate: a simple measure of emergency department crowding? Ann Emerg Med. 2008;51(1):15–24, 24.e1-2.
[13] Jones SS, Allen TL, Flottemesch TJ, et al. An independent evaluation of four quantitative emergency department crowding scales. Acad Emerg Med. 2006;13(11):1204– 1211.
[14] Richards JR, Ozery G, Notash M, et al. Patients prefer boarding in inpatient hallways: correlation with the national emergency department overcrowding score. Emerg Med Int. 2011;2011:840459.
[15] Raj K, Baker K, Brierley S, et al. National emergency department overcrowding study tool is not useful in an Australian emergency department. Emerg Med Australas. 2006;18(3):282–288.
[16] Weber EJ, Mason S, Carter A, et al. Emptying the corridors of shame: organizational lessons from England’s 4-h emergency throughput target. Ann Emerg Med. 2011;57(2):79-88.e1.
[17] Pines JM. Moving closer to an operational definition for ED crowding. Acad Emerg Med. 2007 ;14(4):382-3–383-4.
a limited period of time and further studies should be conducted to confirm our findings.
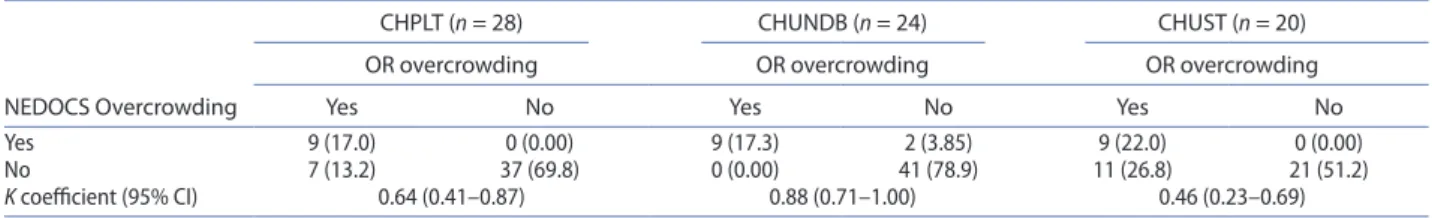
ED crowding has been reported to be like the ele-phant standing in the room, it is very difficult to describe how heavy he is, how bad he smells and just when the floor might give [17]. Moving one step closer to the ever-elusive operational definition of ED crowding, a call for standardization of overcrowding measures has recently emerged. To fulfil practical requirements and ED specifications, the best candidate should be simple, valid, reliable and sensitive to changes through times. We believe that OR is an easily available, simple and consistent measure that offer a real advantage in terms of generalizable estimation of ED crowding than more complex multidimensional measures. According to Table 3 making a cross-classification of both score in each ED, we could even advance that OR is more sensi-tive to crowding than NEDOCS. So, OR may not only challenge difficulties of specific variations across EDs from large, academic, inner city ED to more modest, rural or locals ED from district hospitals but also provide simple data for forecasting models.
5. Conclusion
Crowding evaluation in ED requires validated, easy-to-use and generalizable scores. In that perspective, our study in three hospitals facilities with various setting, simple OR appeared as accurate as more sophisticated NEDOCS, in quantifying overcrowding objectively. Furthermore, this measure is perfectly correlated with the perception of ED staff.
Disclosure statement
No potential conflict of interest was reported by the authors. References
[1] Claret PG, Bobbia X, Richard P, et al. Overcrowding in emergency departments: causes, consequences and solutions. Afr J Emerg Med. 2014;4(2):96–105.
[2] Di Somma S, Paladino L, Vaughan L, et al. Overcrowding in emergency department: an international issue. Intern Emerg Med. 2015;10:171–175.
[3] Hwang U, Weber EJ, Richardson LD, et al. A research agenda to assure equity during periods of emergency department crowding. Acad Emerg Med. 2011;18(12):1318–1323.
Table 3. cross-classification of both scores in each eD.
NEDOCS Overcrowding
CHPLT (n = 28) CHUNDB (n = 24) CHUST (n = 20)
OR overcrowding OR overcrowding OR overcrowding
Yes No Yes No Yes No
Yes 9 (17.0) 0 (0.00) 9 (17.3) 2 (3.85) 9 (22.0) 0 (0.00)
no 7 (13.2) 37 (69.8) 0 (0.00) 41 (78.9) 11 (26.8) 21 (51.2)
K coefficient (95% ci) 0.64 (0.41–0.87) 0.88 (0.71–1.00) 0.46 (0.23–0.69)