HAL Id: halshs-01401867
https://halshs.archives-ouvertes.fr/halshs-01401867v2
Submitted on 31 Dec 2018
HAL is a multi-disciplinary open access
archive for the deposit and dissemination of sci-entific research documents, whether they are pub-lished or not. The documents may come from teaching and research institutions in France or abroad, or from public or private research centers.
L’archive ouverte pluridisciplinaire HAL, est destinée au dépôt et à la diffusion de documents scientifiques de niveau recherche, publiés ou non, émanant des établissements d’enseignement et de recherche français ou étrangers, des laboratoires publics ou privés.
Copyright
Does the catering theory of dividend apply to the
French listed firms?
Kamal Anouar, Nicolas Aubert
To cite this version:
Kamal Anouar, Nicolas Aubert. Does the catering theory of dividend apply to the French listed firms?. Bankers Markets & Investors : an academic & professional review, Groupe Banque, 2016. �halshs-01401867v2�
1
Does the catering theory of dividend apply to the
French listed firms?
Kamal ANOUAR1 Nicolas AUBERT2
November 2016
Abstract:
This paper tests the catering theory of dividend in the French market. It investigates how prevailing investor’s demand for dividend payers proxied by the dividend premia affects the dividend policy. The dividend premia are measured at the market level and at the firm level. We find that the market demand for dividends measured by dividend premia affects the decision to start, to continue or to omit to pay dividends and the decision to increase the dividends. However, catering theory does not seem to affect the magnitude of the dividend changes since most results are not significant.
Key words: Dividends, Payout policy, Catering, Dividend premium, Behavioral corporate finance.
JEL code: G02, G35
1
Haute-Alsace University (GRM EA 4711).
2 1. Introduction
The decision to pay out dividend to shareholders is considered as strategic because it is related to other financial and investment decisions (Allen and Michaely; 2003). But dividend policy is still regarded as a puzzle even though it has been extensively investigated by academic literature. Several papers relaxed the hypotheses of Miller and Modigliani. Among them, Baker and Wurgler (2004a) developed the catering theory of dividend which takes into account investors’ rationality limits. According to them, “managers rationally cater to investor demand – they pay dividend when investors put higher prices on payers and they do not pay when investors prefer non payers” (Baker and Wurgler, 2004a; p. 1125). They regard this managerial strategy as a consequence of investors uninformed and time varying demand for dividend paying stock and the failure of arbitrage. Managers take advantage of the uninformed demand for dividends to boost the company’s share price. This strategy leads them to pay dividends when investors’ demand for dividends is high and conversely.
Baker and Wurgler (2004a) assume that the demand for dividends can be observed by the difference of valuation between dividend paying firms and non-dividend paying firms. A positive difference reflects the demand for dividend whereas a negative difference reflects that investors do not desire dividends. If companies’ valuation is proxied by the market-to-book ratio, the probability that a company starts or continues paying dividend is higher when its market-to-book ratio is lower than paying companies’ market-to-book ratio.
This paper tests the catering theory of dividend in the French market. Focusing on France is appealing for several reasons. The non-financial companies distribute on average about 10% of their EBITDA between 2001 and 2015 (data from the INSEE3). According to the Global dividend index published by Henderson, Europe is comfortably the second largest region in the world for dividends after northern America and the United Kingdom. Among European
3
countries, France holds the first position by paying 25% of the dividends representing 50 billion dollars in 2013. The same study points that France is the third dividend paying country in the world after the USA and the United Kingdom since 20094. In these two latter countries, previous studies emphasized that the catering theory of dividend applies because they are common law countries which is not the case for France. Besides this French singularity, France has an intermediary model of governance (Aste, 1999). For instance, the companies have the freedom to choose to adopt a unitary or dual board of directors (Belot et al, 2014); they do not have obligations to appoint financial experts on their board (Jeanjean and Stolowy, 2009); the board of directors can include employees (Ginglinger et al, 2011). Belot et al (2014) identify nine European countries5 whose legal code is inherited from the French civil law. La Porta et al (2000) consider that one of the principal remedies to the agency problem is law. According to them, common law countries offer the best legal protection against majority shareholders whereas in civil law countries, “investors’ protection is a good deal more precarious” (p. 4). They further argue that, among civil law countries, French law countries have the weakest protection. They assume that in these countries, dividend policy could be regarded as a substitute for law protection. In this substitution model, “dividends are a substitute for effective legal protection, which enables firms in unprotective legal environments to establish reputations for good treatment of investors through dividend policies” (p. 27). According to the Banque de France, another important feature of the largest French listed companies belonging to the CAC 40 index is that an important proportion of their market value is hold by foreign investors: 46, 7% at the end of 2013. This proportion reaches 42, 7% for all listed companies. More than half of the companies belonging to the CAC 40 index are actually controlled by foreign investors6. This exposure to foreign
4 http://www.henderson.com/getdoc.ashx?id=25805 accessed in March 2015.
5 Belgium, Greece, Italy, Lithuania, Luxembourg, the Netherlands, Portugal, Romania and Spain. 6
https://www.banque-france.fr/fileadmin/user_upload/banque_de_france/publications/BDF197-1_CAC40.pdf accessed in March 2015.
4
investment would make France particularly sensitive to the market pressure in terms of demand for dividends highlighted by the catering theory. These specific features make France an interesting case for studying dividend policy.
We use a 12 years panel data from 2001 to 2012 covering the largest French listed companies. We investigate the behavioral imperfection documented by Baker and Wurgler (2004a) to better understand the dividend policy decision. This paper is the first attempt to test the catering theory of dividend with recent French archival data. One innovation is to use firm level measures of the catering effect. Although we validate the catering theory for the binary decision to pay dividend and its extension by Li and Lie (2006) to the decision to increase the dividends. Most of the results regarding the magnitude of dividend changes are not significant.
The remainder of this paper is organized as follows. Section 2 presents the literature review. Section 3 describes the data and methodology. Section 4 presents the results. Section 5 discusses the results. Section 6 offers concluding remarks.
2. Literature review
After Miller and Modigliani (1961), the literature mainly relaxes three hypotheses of their model: the nonexistence of tax (Brennan, 1970; Elton et Gruber, 1970; Poterba et Summers, 1984; Hamon et Jacquillat, 1992), the information perfection (Bhattacharya, 1979, 1980; John et Williams, 1985; Miller et Rock, 1985; Rozeff, 1982; Easterbrook, 1984; Jensen, 1986) and the agents’ rationality (Shefrin et Statman, 1984). This last imperfection becomes a major source of interest with the growing influence of behavioral finance. Relaxing the investor’s perfect rationality assumption in corporate finance leads to the emergence of the behavioral corporate finance approach (Shefrin, 2001). In their recent updated survey on behavioral corporate finance, Baker et al (2013) divide the literature in two broad groups according to
5
who is assumed to be affected by irrationality. The “market timing and catering” approach considers that rational managers face irrational investors whereas the “managerial bias” approach assumes that irrational managers face rational investors. Our paper adopts the first point of view and we refer to catering as “any actions intended to boost share prices above fundamental value” (Baker et al, 2013, p. 353). The managers who are able to perceive mispricing will intervene to remove this misevaluation. The mispricing caused by irrational investors may affect the decision of paying dividends to shareholders. According to Baker and Wurgler (2004a), the catering theory of dividend “has three basic ingredients. First, for either psychological or institutional reasons, some investors have an uninformed and perhaps time-varying demand for dividend-paying stocks. Second, arbitrage fails to prevent this demand from driving apart the prices of payers and nonpayers. Third, managers rationally cater to
investor demand — they pay dividends when investors put higher prices on payers, and they
do not pay when investors prefer nonpayers” (p. 1125). They test the theory by relating the decision to pay dividends to the dividend premium. The dividend premium reflects the uninformed demand for dividend paying shares. Their measure of the dividend premium is the difference between the logs of the average market-to-book ratio of dividend payers and the logs of the average market-to-book ratio of non-payers. They confirm that the dividend premium is a strong predictor of the decision to initiate dividend payout in the US between 1962 and 2000 and validate the prediction that managers respond to investors’ demand. The higher the demand for dividend, the higher the propensity to pay. Baker and Wurgler (2004a) restrict the catering theory to the binary decision to pay or omit dividend. Li and Lie (2006) extend their model to the decision to increase or to decrease the dividends and the magnitude of this change. They validate their prediction empirically. Thereafter, several empirical studies validate the theory in other countries. Baker and Wurgler (2004b) establish themselves a close empirical link between the propensity to pay dividends and catering incentives.
6
Catering incentives are measured by the same dividend premium proxy as in Baker and Wurgler (2004a). They identified four waves of appearing and disappearing dividends which are closely related to their dividend premium proxy. Ferris et al (2006) also use aggregate data in the United Kingdom from 1988 to 2002 and validate the catering theory. They find that the dividends’ disappearance in the 1990s was related to a lower dividend premium. Ferris et al (2009) confirmed that managers rationally respond to the investor’s demand for dividend in common law countries. In contrast, in civil law countries (including France), companies do not follow the investor’s preference for dividend. Denis and Osobov (2008) investigated the determinants of dividend policy in six countries including France from 1994 to 2002 and do not find support for the catering theory of dividend outside of the US. Hoberg et al (2009) find that catering theory no longer explains payout policy in the US when risk is included in their regressions. Von Eije and Megginson (2008) also includes French companies in their sample of European companies and “find no systematic effects of a country-specific catering variable in EU companies, which suggests that catering is not an important factor influencing European payout policies” (p. 349). In France, Albouy et al (2012) use survey data to test several dividend theories and do not find support to the catering theory even though the items measuring how investors’ demands are well ranked by the managers.
3. Data and methods
We use data on French listed companies from 2001 to 2012. All the data were collected from Thomson Datastream. All the companies belong to the CAC All Tradable (CACT) index. This index replaced the SBF 250 in 2011. Although the CACT includes more than 300 firms, the SBF 250 used to include 250 firms. Our sample covers a period ending in 2012 – on year after the SBF 250 is replaced – and gathers data on most of companies belonging to this reference index. French listed companies are included in this index if they fulfil the Minimum Trading
7
Velocity requirement defined by NYSE Euronext7. We remove financial and utility companies and those with outliers or missing values. The CACT index experienced a turnover during this period. Many firms getting in and out of the index. Since our purpose is to investigate the time varying demand for dividend, we keep only companies we can track during the whole period of time. Our sample is then a balanced dataset comprising 2652 firm-year observations (12 firm-years 221 firms). As for the estimation method, we use random effects regressions following the result of the Hausman test. We use lagged values of all independent variables to measure how observation of investor’s demand for dividend in a given year by the managers affects their decision to cater dividends the following year.
3.1. Dependent variables: the dividend payout policy
Previous research measured payout policy as a binary decision (initiate/omit, increase/decrease) or as a continuous one (the change of the dividend). We follow the same path using: (i) a dummy variable “DpsBin” taking the value of 1 if a company pays a dividend for a given year and 0 otherwise; (ii) a dummy variable “Dividend increase” taking the value of 1 if a company increases the level of the dividend yield for a given year and 0 otherwise; (iii) two continuous variables measuring the changes of the dividend yield (the absolute value of the amount of decrease “DyDecrease” and the amount of increase “DyIncrease”). We use a log transformation of these last two variables to correct their positive skewness.
3.2.Independent variables: the dividend premia
We use firm level variables measuring the catering effect while previous papers used an annually aggregate measure of the investors’ demand for dividends. This is an innovation of this paper. The dividend premium is the main measure of the investors’ demand for dividend
7
More information can be found following this link:
8
in previous papers. This Baker and Wurgler dividend premium (DP) is computed as the annual aggregate difference between the logs of the dividend payers and nonpayers average market-to-book ratios. The intuition of Baker and Wurgler (2004a) is that a positive (respectively negative) dividend premium will incentivize managers to initiate (respectively omit) dividend payout. We compute the same variable “DP3” used by Baker and Wurgler (2004a). Thus, it takes a unique value each year for all companies thus measuring a market level catering effect affecting all the companies the same way. We also create two proxies of the dividend premium at the firm level: – a dummy variable “DP1” taking the value of 1 if the log of the dividend payers average market-to-book ratio for a given year is higher than the log of the average market-to-book ratio for a given company; – a continuous variable “DP2” measuring the difference between the log of the dividend payers average market-to-book ratio for a given year and the log of the average market-to-book ratio for a given company. With DP1 and DP2, the interpretation of the results depends on whether the firm already pays dividends or not. We therefore can identify four different situations according to the current dividend policy: i) If the firm pays dividends and DP1 equals 1 or DP2 is positive, the rational decision is to stop paying or to decrease the dividend; ii) If the firm pays dividends and DP1 equals 0 of DP2 is negative, the rational decision is also to stop paying or to decrease the dividend; iii) If the firm does not pay dividends and DP1 equals 1 or DP2 is positive, the rational decision is to start paying or to increase the dividend; iv) If the firm does not pay dividends and DP1 equals 0 of DP2 is negative, the rational decision is to not initiate paying dividend. From this point of view, there is only one case (iii) where there is an incentive to start to pay or increase the dividend. In most instances, we report negative coefficients.
We take equal and value weighted averages of the market-to-book ratios.
9
A set of control variables measure firms’ characteristics: the dividend yield, the investment opportunities, the profitability, the retained earnings to the total equity, the size, the free cash flow, the systematic risk and the specific risk. This set of control variables also aims at controlling how competing explanations of the dividend policy. Continuing to pay a dividend, increasing or decreasing it and the amount of the variation do not have the same meaning according the level of the dividend yield. Because we use lagged values on all the independent variables, the dividend yield also controls for the stickiness of the dividend policy that has long been documented in the literature (Lintner, 1956). Therefore, we include the dividend yield in our regressions. The dividend yield is used for instance by Li and Lie (2006). Fama and French (2001) use the total asset growth rates as a measure of the investment opportunities and the logarithm of the total assets to control for size. We expect that firms having more growth opportunities to pay out less dividend and large firms to pay more dividend. Fama and French (2001) find that firms that have never paid dividends have the best growth opportunities and that dividend payers are much larger than non-payers. As in Grullon et al. (2005), we use the return on assets (ROA) to measure the influence of profitability on the dividend decision. We expect managers of profitable firms to be more likely to initiate or to increase dividends. DeAngelo et al. (2006) and Von Eije and Megginson (2008) use the retained earnings to the total equity as a proxy of the life-cycle theory of dividends. We use the same variable and expect a positive link between the probability of paying dividend and the retained earnings to total equity ratio. The free cash flow (FCF) variable evaluates the capacity of company to pursue the investment opportunities in the interest of shareholders and comes with agency cost (Jensen, 1986). Firms with more free cash flow have more incentive to initiate or to increase dividends. Finally, we include two variables considering the systematic risk and the idiosyncratic risk following Hoberg and
10
Prabhala (2009). We expect managers to be more reluctant to pay or increase the dividends if the risks are high.
4. Empirical results 4.1.Descriptive analysis
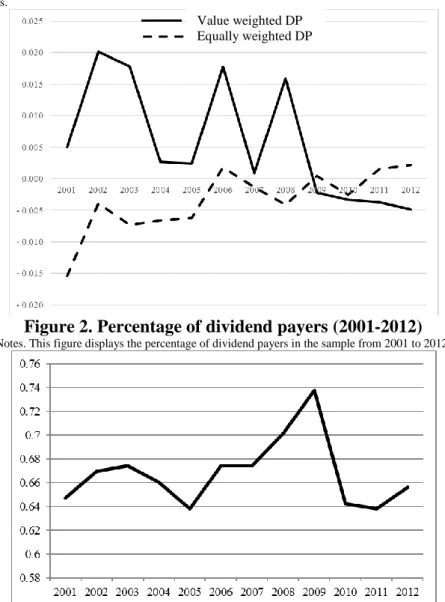
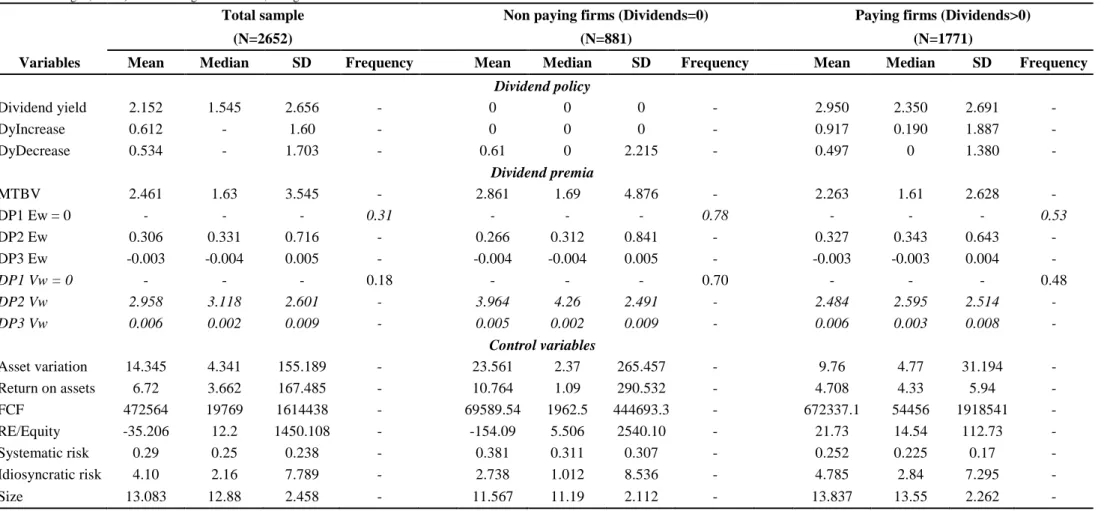
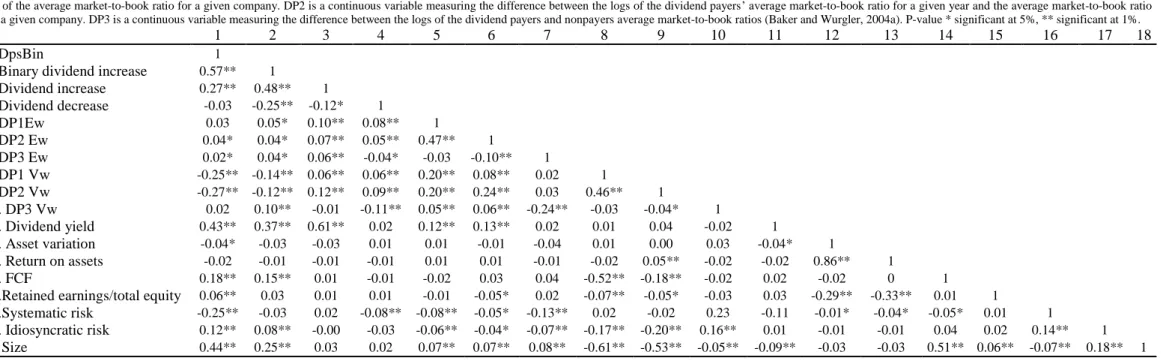
As a first descriptive analysis, Figure 1 plots the equally (dashed line) and value weighted (solid line) dividend premia of our sample in the manner of Baker and Wurgler (2004a). Recall that dividend premium proxies the investors’ demand for dividend. It shows that the dividend premium does not remain stable over time suggesting a time varying demand for dividends. The differences between the values of the equally and value weighted dividend premia are important even though the values vary in the same senses until 2007-2008. From this time, the equally weighed dividend premium increases whereas the value weighted dividend premium decreases. Figure 2 plots the proportions of dividend payers between 2001 and 2012 while Figure 3 displays the proportions of companies that increased the dividend between 2001 and 2012. The patterns of these curves are very similar showing that the decisions to pay dividend and to increase vary the same way. On the contrary, the relationship between figure 1 on one hand and figures 2 and 3 on another hand are not obvious. At an aggregated level, the comparison of these figures does not suggest support of the catering theory. Indeed, the proportion of dividend payers does not seem to be driven by the dividend premium. Table 1 provides summary statistics of all the variables for the whole period investigated. During the period studied, 66.78% of the companies pay dividends and 39.14% of the companies increase the dividends. The average increase is 0.61 euros (SD=1.60) and the average decrease is 0. 53 euros (SD=1.70). The average market-to-book ratio is 2.461 euros (SD=3. 545). As for our equally weighted (Ew) measures of the dividend premium, 31% of the companies have a higher market-to-book ratio than dividend payers
11
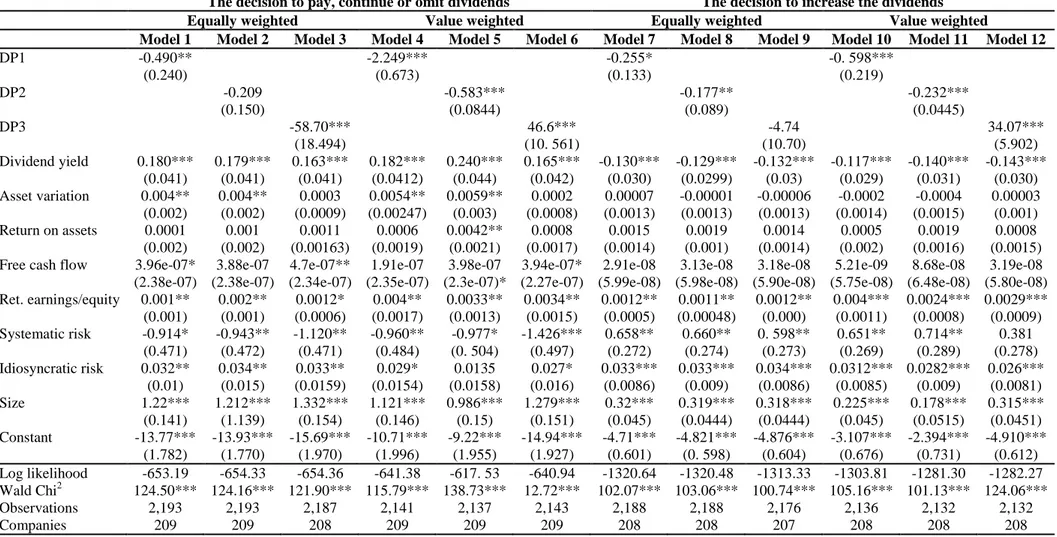
(DP1Ew=0:31%). DP2Ew – the variable measuring this difference – equals 0.306 on average (SD=0.716). The Baker and Wurgler aggregate annual equally weighted dividend premium equals -0.003 on average (SD=0.005) and 0.006 for the value weighted dividend premium (SD=0.009). Statistics on control variables are also reported in the table. Table 2 displays the correlation matrix between the variables included in the analysis. We do not have major collinearity issues except between the variables asset variation and return on assets. To check collinearity issue, we compute the variance inflation factors and report an average index smaller than 2.
4.2.The decision to pay, continue or omit dividends
We first examine how the prevailing investors’ demand for dividend payers as well as the financial firm’s characteristics affects the probability of starting or continuing to pay dividends. The results are reported in the columns labelled 1 to 6 of the Table 1. Columns 1 to 3 display the results for the 3 equally weighted dividend premia and columns 4 to 6 show the results for the 3 value weighted dividend premia. The dependent variable is coded 1 if the company pays a dividend and 0 otherwise. We run six binary logistic regressions of the decision to either start or continue paying dividend on each of our six dividend premium proxies and on our set of control variables. Five out of six coefficients associated to the dividend premia are significant indicating that the catering theory applies to the decision to pay, continue or to omit dividends. DP1 and DP2, the firm level measures of the dividend premium are always associated with negative coefficients. The coefficient of the Baker and Wurgler (2004a) dividend premium is negative when it is equally weighted and positive when it is value weighted. The coefficients associated to the size, the dividend yield and to the retained earnings are positive and significant. Firms are more likely to initiate or continue to pay dividend if they are large with a high past dividends and also when retained earnings
12
represent a large portion of total equity. The coefficients on free cash flow are significant and positive (models 1, 3 and 6). Indeed, firms are more likely to offer dividend to shareholders if they have a high level of free cash flows in order to reduce the asymmetry information and the agency cost. The coefficients on the investment opportunities measured by the asset growth rates are positive and significant, suggesting that firms tend to cut dividend when they have a poor growth opportunities. The coefficients on the variables reflecting systematic and idiosyncratic risks are negative and positive respectively. The negative coefficients indicate that managers are more reluctant to start or to continue paying dividends if the systematic risks are high. Conversely, the negative coefficients show that firms are more likely to pay dividends even though the idiosyncratic risk is high reflecting certain level of overconfidence. The coefficients associated to profitability are not significant.
4.3.The decision to increase the dividends
The second analysis studies the decision to increase or to decrease the dividends. The results are reported in the columns labelled 7 to 12 of the Table 1. Columns 7 to 9 display the results for the 3 equally weighted dividends premia and columns 10 to 12 show the results for the 3 value weighted dividend premia. Here, the binary dependent variable takes the value of 1 if a company increases its dividends and 0 otherwise. We run six binary logistic regressions of the decision to increase the dividend on each of our three dividend premium proxies and on our set of control variables. The results of the equally weighted (respectively value weighted) dividend premium proxies are reported in table 3 (models 7, 8 and 9) (respectively models 10, 11 and 12). Two out of our three dividend premium proxies – namely DP1 and DP2 – are significant and negative. These results are consistent with our predictions. Only the Baker and Wurgler (2004a) annual measure (model 12) is positive and significant suggesting that managers are increasing the level of dividends if the investors demand for dividends is high.
13
The coefficients associated to the dividend yield are negative and statistically significant. Firms with a weak past dividends are more likely to increase the dividends. The coefficients related to the retained earnings, risk and size are positive and significant. These results suggest that the larger the firms are, the more likely the increase is. Higher level of retained earnings and risk are associated to a higher probability to increase the dividends. All the other coefficients are not significant.
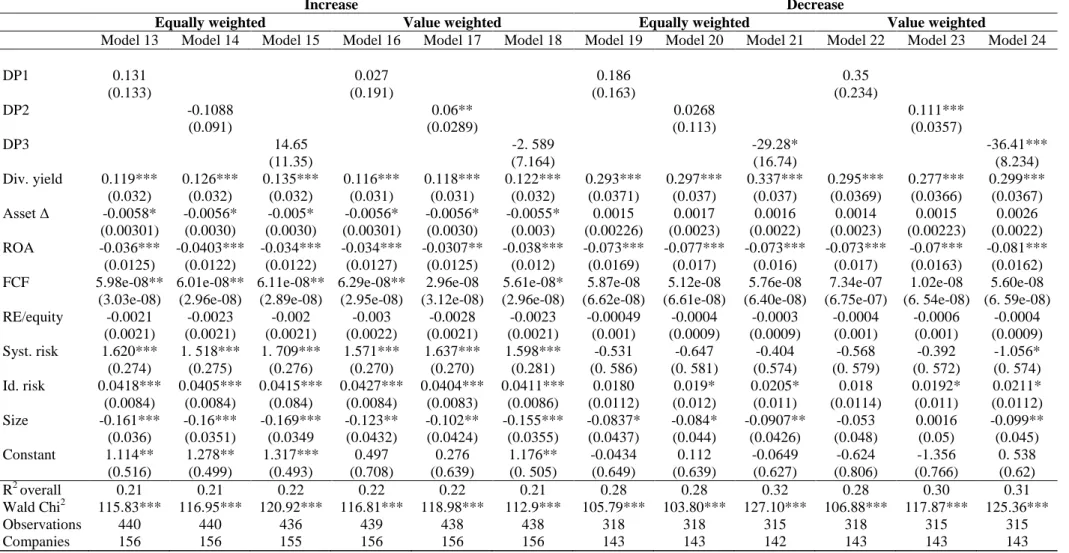
4.4.Determinants of the magnitude of dividends change
We now investigate what drives the magnitude of dividend changes. To do so, we use two continuous variables i.e. the increase and the decrease magnitude. We multiply this latter variable by minus one to get the absolute value of the decrease. Therefore, we run two separate regressions: One regression of the natural logarithm of the magnitude of the increase and the other of the natural logarithm of the magnitude of the decrease. These variables are regressed on the independent variables including our firm-level measures of the dividend premium (equally and value weighted). The results on the dividend magnitude increase are reported in table 4 (models 13 to 18). The coefficients related to our three dividend premium proxies are positive but not significant. Only the second firm level measure of the value weighted dividend premium (model 17) is significant at 5% level. The coefficients associated to the dividend yield, free cash flow and risk are positively related to the magnitude of the increase. Managers have incentives to pay more dividends if the past dividends and risk are high with an important level of free cash flows to reduce consequently the asymmetry information and the agency cost. The coefficients on the assets variation, profitability and size are negative and significant. This finding suggests that managers have no incentive to pay more dividends in the case of firms with poor profitability and even if the investments opportunities are weak to finance future investment opportunities. Finally, the coefficients on
14
the retained earnings are not significant. The result suggests that the magnitude of the dividends increase is not driven by this variable.
The results on the magnitude of the dividend decrease are reported in table 4 (models 19 to 24). Only the coefficients related to the value weighted DP2 (positive) and DP3 (negative) in models 23 and 24. Recall that we change the sign of the magnitude by multiplying the value decrease by minus one. Consequently, the signs must be interpreted in the other direction, that is negative for DP2 and positive for DP3. These latter results are then consistent with the previous findings reported in the table 3. The other coefficients related to our proxies are not significant. The coefficients associated to the dividend yield are positive and significant suggesting that managers tend to cut the dividend more if the past dividend is high. The coefficients on the profitability and size are negative and significant. Dividends’ decrease is lower for larger and low profitable companies. The coefficients on the investment opportunities, free cash flow, retained earnings and systematic risk are not significant. The results suggest that the magnitude of the dividends decrease is not driven by these variables.
5. Discussion
Our conclusions regarding whether the catering theory of dividend applies to France are mixed. The coefficients associated to the dividend premia suggest that the catering theory of dividend applies to France regarding the decision to start, continue or omit dividends (Baker and Wurgler, 2004a) and the decision to increase the dividend (Li and Lie, 2006). Overall, results for the value weighted dividend premia are stronger in terms of significance. Value weighted dividend premia are more accurate because they consider the relative market value of the companies in the calculations. It is very likely that the largest market capitalizations have stronger influence on the decisions to pay dividends. This is also true for the extended version of the theory of Li and Lie (2006) concerning the magnitude of the dividend decrease.
15
Results are less evidential for the increase where only one model displays significant result (model 17). For the magnitude of the dividend decrease, coefficients associated to the value weighted dividend premia are significant in two models out of three.
When we closer look at the three dividend premia measures, we observe that the results obtained for our firm level variables (DP1 and DP2) are consistent to what we expected. One innovation of the paper is to use firm level measures of the dividend premia. This new way of computing dividend premia brings a more comprehensive understanding of how dividend policy is defined. We interpret the consistency of the results as a confirmation that our approach is correct. Although we believe that these new measures are consistent with the catering theory, they cannot be interpreted in the same manner as the aggregated proxy of the dividend premium, all the firms face the same dividend premium for a given year. In most papers investigating the catering theory, both the dividend policy and the dividend premium are aggregated at a yearly level for decades. Our paper takes a different approach studying the company level dividend policy. By doing so, we assume that rational managers define their dividend payout policy by observing their market valuation and comparing it with the valuation of dividends paying firms.
If we compare our results regarding the first version of the theory to previous literature, our findings are different from Kuo et al (2013), Ferris et al (2009) and Denis and Osobov (2008) who find that catering theory does not apply in civil law countries including France. Unlike our paper, these papers use aggregated dividend premium measures. We use different measures of the dividend premium with a closer focus on the French market. Using survey data, Albouy et al (2012) do not find either that the catering theory applies to France. All these papers attempt to test the first version of the catering theory: the binary decision to start or continue to pay dividend. As for the prediction of the extended catering theory developed by Li and Lie (2006), our significant results for the value weighted dividend premia are in part
16
consistent with it regarding the magnitude of dividends changes decision. These authors use yearly aggregated measures of the dividend premium. They find that the dividend premium affects positively the magnitude of the increases and negatively the magnitude of the decreases. In the first instance, we have the same result for model 17. Having in mind that we multiplied the magnitude of the decrease by minus one, we report a positive association between the Baker and Wurgler dividend premium and the magnitude of the decrease. The latter variable is negatively related to the firm level dividend premium. These two results differ from Li and Lie’s (2006). We then find that the decisions regarding the amount of the dividend increase and the amount of the dividend decrease are not symmetric.
We run additional analyses to check the robustness of our results. One question is whether firms with small capitalizations take the dividend premium into account when they define their dividend payout policy. The catering theory assumes that managers are very sensitive to investors’ demand which may not be the case for small capitalizations. To check this effect, we run regressions on firms belonging to the CAC 40 index including the 40 largest French capitalizations. The dividend premium proxies are not associated with significant coefficients either. The clientele effect is another determinant of dividend policy according to the literature and a competing theory. For undiversified holders such as family, dividend represent an important source of income. As robustness checks, we run the regressions including the percentage of family ownership and the results do not change much. 16 out of the 24 regressions display the same results. The signs remain the same but are no longer significant for the remaining regressions. We believe it to be due to a smaller sample size because we collect data on family ownership only from 2001 to 2008.
Our results can also be explained by other factors. Baker et al (2013) distinguished two situations where agent’s rationality is assumed to be limited. We adopt the “market timing and catering” approach that considers that rational managers face irrational investors. We do not
17
investigate the dividend policy assuming managers’ irrationality. Some unexpected results might be affected by management’s irrationality and should be investigated by future researches. The use of firm level proxies of the dividend premium and the investigation of recent and exhaustive French data are two innovations of this paper. Using the dividend premium as a proxy of the time varying demand for dividend can be debated. The market-to-book ratio can capture other facts. For instance, it is often used as a proxy of investment opportunities but also as a strong proxy of mispricing (see, for example, Barberis and Huang, 2001; Daniel et al, 2001). As for the dividend policy decisions itself, we are aware that managers base their decision to pay dividend on perceived rather than actual demand for dividend. This can introduce measurement error as already pointed out by Li and Lie (2006).
Other behavioral factors are not measured by our study whereas recent evidence shows that
they can have strong influence on dividend policy. Indeed, Breuer et al (2014) investigate
dividend policy in 29 countries including France and emphasize that patience, ambiguity
aversion and loss aversion affect payout policy significantly. Finally, managers may look at a
dividend premium with a horizon shorter than the year. When they decide their payout policy,
they can be affected by valuation differences within the preceding month or even the
preceding month. One can have a closer look at how this short term demand for dividends
may affect dividend policy in forthcoming research.
6. Conclusion
This paper aims at testing the catering theory of dividend in France. This theory predicts that managers rationally cater dividend to investors when the demand for dividend is high and conversely. Baker and Wurgler (2004a) claim that the time varying demand for dividend can be proxied by the dividend premium they compute at an aggregate level in the USA. We use comparable measures of investors’ demand for dividend computed at the firm level and
18
investigate the dividend payout policy of a sample of French listed companies from 2001 to 2012. Although we validate the catering theory for the binary decision to pay dividend and its extension by Li and Lie (2006) to the decision to increase the dividends. Most of the results regarding the magnitude of dividend changes are not significant. These findings are in line with a stream of behavioral corporate finance that regards managers as responding rationally to irrational investors’ behavior.
References
1. Albouy, M., Bah R., Bonnet, C., & Thévenin, D. (2012), The perception of dividends by managers: Do French managers differ from their North-American peers, Bankers,
Market and Investors, 116, 1.
2. Allen, F., & Michaely, R. (2003). Payout policy. Handbook of the Economics of
Finance, 1, 337-429.
3. Aste, L. J. (1999). Reforming French corporate governance: A return to the two-tier board. George Washington Journal International Law & Economics, 32, 1.
4. Aubert, N. & Rapp, T. (2010), Employees’ investment behavior in a company based
savings plan. Revue Finance, 31, 1.
5. Baker, M. P., & Wurgler, J. (2013). Behavioral Corporate Finance: An Updated Survey, in Handbook of the Economics of Finance: Volume 2, Constantinides, G./Harris, M./Stulz, R. Eds.
6. Baker, M., & Wurgler, J. (2004a). A catering theory of dividends. The Journal of
Finance, 59(3), 1125-1165.
7. Baker, M., & Wurgler, J. (2004b). Appearing and disappearing dividends: The link to catering incentives. Journal of Financial Economics, 73(2), 271-288.
8. Barberis, N., & Huang, H. (2001), Mental accounting, loss aversion, and individual stock returns, Journal of Finance 56, 1247–1292.
9. Belot, F., Ginglinger, E., Slovin, M. B., & Sushka, M. E. (2014). Freedom of choice between unitary and two-tier boards: an empirical analysis. Journal of Financial
Economics, 112(3), 364-385.
10. Bhattacharya, S. (1979). Imperfect information, dividend policy, and" the bird in the hand" fallacy. The Bell Journal of Economics, 259-270.
11. Bhattacharya, S. (1980). Nondissipative signaling structures and dividend policy. The
quarterly journal of Economics, 95(1), 1-24.
12. Breuer, W., Rieger, M. O. & Soypak, K. C. (2014). The behavioral foundations of corporate dividend policy a cross-country analysis, Journal of Banking & Finance, 42, 247-265.
13. Brennan, M. J. (1970). Taxes, market valuation and corporate financial policy.
National Tax Journal, 23(4), 417-427.
14. Daniel, D., Hirshleifer, D., and Subrahmanyam, A. (2001). Overconfidence, arbitrage, and equilibrium asset pricing, Journal of Finance 56, 921–965.
19
15. DeAngelo, H., DeAngelo, L., and M. Stulz, R. (2006). Dividend policy and the earned/contributed capital mix: a test of the life-cycle theory, Journal of Financial
Economics 81, 227-254.
16. Denis, D. J., & Osobov, I. (2008). Why do firms pay dividends? International evidence on the determinants of dividend policy. Journal of Financial Economics,
89(1), 221-82.
17. Easterbrook, F. H. (1984). Two agency-cost explanations of dividends. The American
Economic Review, 74(4), 650-659.
18. Elton, E. J., & Gruber, M. J. (1970). Marginal stockholder tax rates and the clientele effect. The Review of Economics and Statistics, 52(1), 68-74.
19. Fama, E. F., & French, K. R. (2001). Disappearing dividends: changing firm characteristics or lower propensity to pay?. Journal of Financial economics, 60(1), 3-43.
20. Ferris, S. P., Sen, N., & Yui, H. P. (2006). God Save the Queen and Her Dividends: Corporate Payouts in the United Kingdom*. The Journal of Business, 79(3), 1149-1173.
21. Ferris, S. P., Jayaraman, N., & Sabherwal, S. (2009). Catering effects in corporate dividend policy: The international evidence. Journal of Banking & Finance, 33(9), 1730-1738.
22. Ginglinger, E., Megginson, W., & Waxin, T. (2011). Employee ownership, board representation, and corporate financial policies. Journal of Corporate Finance,17(4), 868-887.
23. Grullon, G., Michaely, R., & Thaler, R. (2005). Dividend changes do not signal changes in future profitability. Journal of Business, 78 (5), 1659-1682.
24. Hamon, J., & Jacquillat, B. (1992). Le marché français des actions: études empiriques
1977-1991. Presses Universitaires de France.
25. Hoberg, G., & Prabhala, N. R. (2009). Disappearing dividends, catering, and risk.
Review of Financial Studies, 22(1), 79-116.
26. Jeanjean, T., & Stolowy, H. (2009). Determinants of board members' financial expertise—Empirical evidence from France. The International Journal of
Accounting, 44(4), 378-402.
27. Jensen, M. C. (1986). Agency costs of free cash flow, corporate finance, and takeovers. The American Economic Review, 76(2), 323-329.
28. John, K., & Williams, J. (1985). Dividends, dilution, and taxes: A signalling equilibrium. The Journal of Finance, 40(4), 1053-1070.
29. Kuo, J. M., Philip, D., & Zhang, Q. (2013). What drives the disappearing dividends phenomenon? Journal of Banking & Finance, 37(9), 3499-3514.
30. La Porta, R., Lopez‐de‐Silanes, F., Shleifer, A., & Vishny, R. W. (2000). Agency problems and dividend policies around the world. The Journal of Finance, 55(1), 1-33 31. Li, W., & Lie, E. (2006). Dividend changes and catering incentives. Journal of
Financial Economics, 80(2), 293-308.
32. Lintner, J. (1956). Distribution of incomes of corporations among dividends, retained earnings, and taxes. The American Economic Review, 46(2), 97-113.
33. Miller, M. H., & Modigliani, F. (1961). Dividend policy, growth, and the valuation of shares. The Journal of Business, 34(4), 411-433.
34. Miller, M. H., & Rock, K. (1985). Dividend policy under asymmetric information. The
Journal of Finance, 40(4), 1031-1051.
35. Poterba, J. M., & Summers, L. H. (1984). New evidence that taxes affect the valuation of dividends. The Journal of Finance, 39(5), 1397-1415.
20
36. Rozeff, M. (1982). Growth, beta and agency costs as determinants of dividend payout ratios. Journal of Financial Research, 5(3), 249-259.
37. Shefrin, H. (2001). Behavioral corporate finance. Journal of Applied Corporate
Finance, 14(3).
38. Shefrin, H. M., & Statman, M. (1984). Explaining investor preference for cash dividends. Journal of Financial Economics, 13(2), 253-282.
39. Von Eije, H., & Megginson, W. L. (2008). Dividends and share repurchases in the European Union. Journal of Financial Economics, 89(2), 347-374.
21 Appendix
Figure 1. Dividend premium (2001-2012)
Notes. This figure plots the dividend premium defined by Baker and Wurgler (2004a) as the difference between the logarithm of market to book of dividend paying firms and the logarithm of the market to book of nonpaying firms. These differences are computed for equally (dashed line) and value weighted (solid line) portfolios.
Figure 2. Percentage of dividend payers (2001-2012)
Notes. This figure displays the percentage of dividend payers in the sample from 2001 to 2012.
Figure 3. Percentage of dividend increasers (2001-2012)
Notes. This figure shows the percentage of companies that increases their dividend from 2001 to 2012 Value weighted DP
22
Table 1. Descriptive statistics
Notes. Dividend increase and decrease gives the absolute value of the dividend’s variation. MTBV represent the market-to-book ratio. DP1 is a dummy variable taking the value of 1 if the log of the dividend payers’ average to-book ratio for a given year is higher than the log of the average to-book ratio for a given company. DP2 is a continuous variable measuring the difference between the logs of the dividend payers’ average market-to-book ratio for a given year and the average market-market-to-book ratio for a given company. DP3 is a continuous variable measuring the difference between the logs of the dividend payers and nonpayers average market-market-to-book ratios (Baker and Wurgler, 2004a). P-value * significant at 5%, ** significant at 1%.
Total sample Non paying firms (Dividends=0) Paying firms (Dividends>0)
(N=2652) (N=881) (N=1771)
Variables Mean Median SD Frequency Mean Median SD Frequency Mean Median SD Frequency
Dividend policy Dividend yield 2.152 1.545 2.656 - 0 0 0 - 2.950 2.350 2.691 - DyIncrease 0.612 - 1.60 - 0 0 0 - 0.917 0.190 1.887 - DyDecrease 0.534 - 1.703 - 0.61 0 2.215 - 0.497 0 1.380 - Dividend premia MTBV 2.461 1.63 3.545 - 2.861 1.69 4.876 - 2.263 1.61 2.628 - DP1 Ew = 0 - - - 0.31 - - - 0.78 - - - 0.53 DP2 Ew 0.306 0.331 0.716 - 0.266 0.312 0.841 - 0.327 0.343 0.643 - DP3 Ew -0.003 -0.004 0.005 - -0.004 -0.004 0.005 - -0.003 -0.003 0.004 - DP1 Vw = 0 - - - 0.18 - - - 0.70 - - - 0.48 DP2 Vw 2.958 3.118 2.601 - 3.964 4.26 2.491 - 2.484 2.595 2.514 - DP3 Vw 0.006 0.002 0.009 - 0.005 0.002 0.009 - 0.006 0.003 0.008 - Control variables Asset variation 14.345 4.341 155.189 - 23.561 2.37 265.457 - 9.76 4.77 31.194 - Return on assets 6.72 3.662 167.485 - 10.764 1.09 290.532 - 4.708 4.33 5.94 - FCF 472564 19769 1614438 - 69589.54 1962.5 444693.3 - 672337.1 54456 1918541 - RE/Equity -35.206 12.2 1450.108 - -154.09 5.506 2540.10 - 21.73 14.54 112.73 - Systematic risk 0.29 0.25 0.238 - 0.381 0.311 0.307 - 0.252 0.225 0.17 - Idiosyncratic risk 4.10 2.16 7.789 - 2.738 1.012 8.536 - 4.785 2.84 7.295 - Size 13.083 12.88 2.458 - 11.567 11.19 2.112 - 13.837 13.55 2.262 -
23
Table 2. Correlation matrix
Notes. DpsBin is a dummy variable taking the value of 1 if a company pays a dividend for a given year and 0 otherwise. Dividend increase is a dummy variable taking the value of 1 if a company increases the level of the dividend yield for a given year and 0 otherwise. Dividend variation gives the absolute variation of the dividend yield. DP1 is a dummy variable taking the value of 1 if the log of the dividend payers’ average market-to-book ratio for a given year is higher than the log of the average market-to-book ratio for a given company. DP2 is a continuous variable measuring the difference between the logs of the dividend payers’ average market-to-book ratio for a given year and the average market-to-book ratio for a given company. DP3 is a continuous variable measuring the difference between the logs of the dividend payers and nonpayers average market-to-book ratios (Baker and Wurgler, 2004a). P-value * significant at 5%, ** significant at 1%.
1 2 3 4 5 6 7 8 9 10 11 12 13 14 15 16 17 18
1. DpsBin 1
2. Binary dividend increase 0.57** 1
3. Dividend increase 0.27** 0.48** 1 4. Dividend decrease -0.03 -0.25** -0.12* 1 5. DP1Ew 0.03 0.05* 0.10** 0.08** 1 6. DP2 Ew 0.04* 0.04* 0.07** 0.05** 0.47** 1 7. DP3 Ew 0.02* 0.04* 0.06** -0.04* -0.03 -0.10** 1 8. DP1 Vw -0.25** -0.14** 0.06** 0.06** 0.20** 0.08** 0.02 1 9. DP2 Vw -0.27** -0.12** 0.12** 0.09** 0.20** 0.24** 0.03 0.46** 1 10. DP3 Vw 0.02 0.10** -0.01 -0.11** 0.05** 0.06** -0.24** -0.03 -0.04* 1 11. Dividend yield 0.43** 0.37** 0.61** 0.02 0.12** 0.13** 0.02 0.01 0.04 -0.02 1 12. Asset variation -0.04* -0.03 -0.03 0.01 0.01 -0.01 -0.04 0.01 0.00 0.03 -0.04* 1 13. Return on assets -0.02 -0.01 -0.01 -0.01 0.01 0.01 -0.01 -0.02 0.05** -0.02 -0.02 0.86** 1 14. FCF 0.18** 0.15** 0.01 -0.01 -0.02 0.03 0.04 -0.52** -0.18** -0.02 0.02 -0.02 0 1 15.Retained earnings/total equity 0.06** 0.03 0.01 0.01 -0.01 -0.05* 0.02 -0.07** -0.05* -0.03 0.03 -0.29** -0.33** 0.01 1
16.Systematic risk -0.25** -0.03 0.02 -0.08** -0.08** -0.05* -0.13** 0.02 -0.02 0.23 -0.11 -0.01* -0.04* -0.05* 0.01 1
17. Idiosyncratic risk 0.12** 0.08** -0.00 -0.03 -0.06** -0.04* -0.07** -0.17** -0.20** 0.16** 0.01 -0.01 -0.01 0.04 0.02 0.14** 1 18 Size 0.44** 0.25** 0.03 0.02 0.07** 0.07** 0.08** -0.61** -0.53** -0.05** -0.09** -0.03 -0.03 0.51** 0.06** -0.07** 0.18** 1
24
Table 3. The decision to pay, continue or omit dividends & The decision to increase the dividends
Notes. DpsBin (dependent variable) is a dummy variable taking the value of 1 if a company pays a dividend for a given year and 0 otherwise. Dividend increase (dependent variable) is a dummy variable taking the value of 1 if a company increases the level of the dividend yield for a given year and 0 otherwise. DP1 is a dummy variable taking the value of 1 if the log of the dividend payers’ average market-to-book ratio for a given year is higher than the log of the average market-to-book ratio for a given company. DP2 is a continuous variable measuring the difference between the logs of the dividend payers’ average market-to-book ratio for a given year and the average market-to-book ratio for a given company. DP3 is a continuous variable measuring the difference between the logs of the dividend payers and nonpayers average market-to-book ratios (Baker and Wurgler, 2004a). Standard errors are displayed in parentheses *** p<0.01, ** p<0.05, * p<0.1.
The decision to pay, continue or omit dividends The decision to increase the dividends Equally weighted Value weighted Equally weighted Value weighted
Model 1 Model 2 Model 3 Model 4 Model 5 Model 6 Model 7 Model 8 Model 9 Model 10 Model 11 Model 12
DP1 -0.490** -2.249*** -0.255* -0. 598*** (0.240) (0.673) (0.133) (0.219) DP2 -0.209 -0.583*** -0.177** -0.232*** (0.150) (0.0844) (0.089) (0.0445) DP3 -58.70*** 46.6*** -4.74 34.07*** (18.494) (10. 561) (10.70) (5.902) Dividend yield 0.180*** 0.179*** 0.163*** 0.182*** 0.240*** 0.165*** -0.130*** -0.129*** -0.132*** -0.117*** -0.140*** -0.143*** (0.041) (0.041) (0.041) (0.0412) (0.044) (0.042) (0.030) (0.0299) (0.03) (0.029) (0.031) (0.030) Asset variation 0.004** 0.004** 0.0003 0.0054** 0.0059** 0.0002 0.00007 -0.00001 -0.00006 -0.0002 -0.0004 0.00003 (0.002) (0.002) (0.0009) (0.00247) (0.003) (0.0008) (0.0013) (0.0013) (0.0013) (0.0014) (0.0015) (0.001) Return on assets 0.0001 0.001 0.0011 0.0006 0.0042** 0.0008 0.0015 0.0019 0.0014 0.0005 0.0019 0.0008 (0.002) (0.002) (0.00163) (0.0019) (0.0021) (0.0017) (0.0014) (0.001) (0.0014) (0.002) (0.0016) (0.0015) Free cash flow 3.96e-07* 3.88e-07 4.7e-07** 1.91e-07 3.98e-07 3.94e-07* 2.91e-08 3.13e-08 3.18e-08 5.21e-09 8.68e-08 3.19e-08 (2.38e-07) (2.38e-07) (2.34e-07) (2.35e-07) (2.3e-07)* (2.27e-07) (5.99e-08) (5.98e-08) (5.90e-08) (5.75e-08) (6.48e-08) (5.80e-08) Ret. earnings/equity 0.001** 0.002** 0.0012* 0.004** 0.0033** 0.0034** 0.0012** 0.0011** 0.0012** 0.004*** 0.0024*** 0.0029*** (0.001) (0.001) (0.0006) (0.0017) (0.0013) (0.0015) (0.0005) (0.00048) (0.000) (0.0011) (0.0008) (0.0009) Systematic risk -0.914* -0.943** -1.120** -0.960** -0.977* -1.426*** 0.658** 0.660** 0. 598** 0.651** 0.714** 0.381 (0.471) (0.472) (0.471) (0.484) (0. 504) (0.497) (0.272) (0.274) (0.273) (0.269) (0.289) (0.278) Idiosyncratic risk 0.032** 0.034** 0.033** 0.029* 0.0135 0.027* 0.033*** 0.033*** 0.034*** 0.0312*** 0.0282*** 0.026*** (0.01) (0.015) (0.0159) (0.0154) (0.0158) (0.016) (0.0086) (0.009) (0.0086) (0.0085) (0.009) (0.0081) Size 1.22*** 1.212*** 1.332*** 1.121*** 0.986*** 1.279*** 0.32*** 0.319*** 0.318*** 0.225*** 0.178*** 0.315*** (0.141) (1.139) (0.154) (0.146) (0.15) (0.151) (0.045) (0.0444) (0.0444) (0.045) (0.0515) (0.0451) Constant -13.77*** -13.93*** -15.69*** -10.71*** -9.22*** -14.94*** -4.71*** -4.821*** -4.876*** -3.107*** -2.394*** -4.910*** (1.782) (1.770) (1.970) (1.996) (1.955) (1.927) (0.601) (0. 598) (0.604) (0.676) (0.731) (0.612) Log likelihood -653.19 -654.33 -654.36 -641.38 -617. 53 -640.94 -1320.64 -1320.48 -1313.33 -1303.81 -1281.30 -1282.27 Wald Chi2 124.50*** 124.16*** 121.90*** 115.79*** 138.73*** 12.72*** 102.07*** 103.06*** 100.74*** 105.16*** 101.13*** 124.06*** Observations 2,193 2,193 2,187 2,141 2,137 2,143 2,188 2,188 2,176 2,136 2,132 2,132 Companies 209 209 208 209 209 209 208 208 207 208 208 208
25
Table 4. How much to increase or decrease dividend? Determinants of the magnitude of dividends change
Notes. ln(Dividend increase) or ln(Dividend decrease) are the dependent variables. Dividend increase - respectively decrease - gives the positive – respectively negative times minus one - variation of the dividend. DP1 is a dummy variable taking the value of 1 if the log of the dividend payers’ average market-to-book ratio for a given year is higher than the log of the average market-to-book ratio for a given company. DP2 is a continuous variable measuring the difference between the logs of the dividend payers’ average market-to-book ratio for a given year and the average market-to-book ratio for a given company. DP3 is a continuous variable measuring the difference between the logs of the dividend payers and nonpayers average market-to-book ratios (Baker and Wurgler, 2004a). Standard errors are displayed in parentheses *** p<0.01, ** p<0.05, * p<0.1.
Increase Decrease
Equally weighted Value weighted Equally weighted Value weighted
Model 13 Model 14 Model 15 Model 16 Model 17 Model 18 Model 19 Model 20 Model 21 Model 22 Model 23 Model 24
DP1 0.131 0.027 0.186 0.35 (0.133) (0.191) (0.163) (0.234) DP2 -0.1088 0.06** 0.0268 0.111*** (0.091) (0.0289) (0.113) (0.0357) DP3 14.65 -2. 589 -29.28* -36.41*** (11.35) (7.164) (16.74) (8.234) Div. yield 0.119*** 0.126*** 0.135*** 0.116*** 0.118*** 0.122*** 0.293*** 0.297*** 0.337*** 0.295*** 0.277*** 0.299*** (0.032) (0.032) (0.032) (0.031) (0.031) (0.032) (0.0371) (0.037) (0.037) (0.0369) (0.0366) (0.0367) Asset Δ -0.0058* -0.0056* -0.005* -0.0056* -0.0056* -0.0055* 0.0015 0.0017 0.0016 0.0014 0.0015 0.0026 (0.00301) (0.0030) (0.0030) (0.00301) (0.0030) (0.003) (0.00226) (0.0023) (0.0022) (0.0023) (0.00223) (0.0022) ROA -0.036*** -0.0403*** -0.034*** -0.034*** -0.0307** -0.038*** -0.073*** -0.077*** -0.073*** -0.073*** -0.07*** -0.081*** (0.0125) (0.0122) (0.0122) (0.0127) (0.0125) (0.012) (0.0169) (0.017) (0.016) (0.017) (0.0163) (0.0162) FCF 5.98e-08** 6.01e-08** 6.11e-08** 6.29e-08** 2.96e-08 5.61e-08* 5.87e-08 5.12e-08 5.76e-08 7.34e-07 1.02e-08 5.60e-08 (3.03e-08) (2.96e-08) (2.89e-08) (2.95e-08) (3.12e-08) (2.96e-08) (6.62e-08) (6.61e-08) (6.40e-08) (6.75e-07) (6. 54e-08) (6. 59e-08) RE/equity -0.0021 -0.0023 -0.002 -0.003 -0.0028 -0.0023 -0.00049 -0.0004 -0.0003 -0.0004 -0.0006 -0.0004 (0.0021) (0.0021) (0.0021) (0.0022) (0.0021) (0.0021) (0.001) (0.0009) (0.0009) (0.001) (0.001) (0.0009) Syst. risk 1.620*** 1. 518*** 1. 709*** 1.571*** 1.637*** 1.598*** -0.531 -0.647 -0.404 -0.568 -0.392 -1.056* (0.274) (0.275) (0.276) (0.270) (0.270) (0.281) (0. 586) (0. 581) (0.574) (0. 579) (0. 572) (0. 574) Id. risk 0.0418*** 0.0405*** 0.0415*** 0.0427*** 0.0404*** 0.0411*** 0.0180 0.019* 0.0205* 0.018 0.0192* 0.0211* (0.0084) (0.0084) (0.084) (0.0084) (0.0083) (0.0086) (0.0112) (0.012) (0.011) (0.0114) (0.011) (0.0112) Size -0.161*** -0.16*** -0.169*** -0.123** -0.102** -0.155*** -0.0837* -0.084* -0.0907** -0.053 0.0016 -0.099** (0.036) (0.0351) (0.0349 (0.0432) (0.0424) (0.0355) (0.0437) (0.044) (0.0426) (0.048) (0.05) (0.045) Constant 1.114** 1.278** 1.317*** 0.497 0.276 1.176** -0.0434 0.112 -0.0649 -0.624 -1.356 0. 538 (0.516) (0.499) (0.493) (0.708) (0.639) (0. 505) (0.649) (0.639) (0.627) (0.806) (0.766) (0.62) R2 overall 0.21 0.21 0.22 0.22 0.22 0.21 0.28 0.28 0.32 0.28 0.30 0.31 Wald Chi2 115.83*** 116.95*** 120.92*** 116.81*** 118.98*** 112.9*** 105.79*** 103.80*** 127.10*** 106.88*** 117.87*** 125.36*** Observations 440 440 436 439 438 438 318 318 315 318 315 315 Companies 156 156 155 156 156 156 143 143 142 143 143 143